
1. Background
Insufficient physical activity (PA) is a significant public health concern (1). The World Health Organization (WHO) (2) estimates that 81% of European adolescents do not meet the recommended 60 minutes of moderate-to-vigorous PA, affecting not only individuals throughout their lifespan but also health services and society (2). Physical activity has been consistently associated with improved cardiometabolic and mental health, physical fitness (PF), and well-being, while reducing the risk of unhealthy weight gain (3). Conversely, low levels of PA are directly related to reduced PF and poorer health outcomes (4).
There is an urgent need to increase health-related PA engagement among young people, and schools seem to provide an excellent environment for promoting regular PA (5). In school settings, particularly in physical education classes, motor skills are developed, and PA can be enhanced, facilitating engagement in various movements (6). Physical education classes can also improve PF levels (7) and motivation for PA engagement (8, 9). Thus, schools can be considered vital to the development of young people's physical literacy (PL).
Physical literacy is defined as a "disposition to capitalize on our human-embodied capability where the individual has the motivation, confidence, physical competence, knowledge, and understanding to value and take responsibility for maintaining purposeful physical pursuits and activities throughout the life course" (10). Whitehead (10) also points out that all individuals exhibit a potential for PL. However, its expression is unique to the culture in which they live, shaped by what characterizes them in terms of PA and their movement capabilities (10). Physical literacy assessment has grown in response to the challenges posed by the high prevalence of physical inactivity in society (11). Physical literacy consists of four domains: Physical domain (physical competence), cognitive domain (knowledge and understanding), affective domain (motivation and confidence), and behavioral domain (engagement in PA) (10). The affective domain can be considered the most important for lifelong participation in PA, including confidence, motivation, enjoyment, commitment, autonomy, self-esteem, and perceived physical competence (12). By providing individuals with these skills and promoting engagement in various PAs, PL can help counteract the trend toward sedentary behavior and encourage lifelong participation in PA.
Literature shows that PL can be a determinant of health mainly through improved PA engagement (13). Comprehending the association between PL and PA, and whether it is mediated by PF improvement, can be paramount to a better understanding of the role of PL as a health determinant; however, the current evidence remains controversial. A recent study showed a weak association between PF and PL (14). At the same time, other investigations found that children's cardiorespiratory fitness outcomes were positively associated with PL (15) and that adolescents with higher PL performed better in strength, power, flexibility, and cardiovascular endurance (16). These findings underscore the need to summarize the existing evidence on the association between PL and PF and clarify possible ramifications. Therefore, this systematic review aims to explore the relationship between PL and PF outcomes among children and adolescents.
2. Materials and Methods
This systematic review protocol was registered with PROSPERO (CRD42023470224) and was conducted according to the Preferred Reporting Items for Systematic Reviews and Meta-Analyses (PRISMA) guidelines (17).
2.1. Search Strategy
The following terms were searched in five online databases (PubMed, Web of Science, Scopus, Eric, and SPORTDiscus) on 16 October 2023: "physical literacy" OR "motor literacy" AND fitness OR strength* OR resistance OR cardiorespiratory OR aerobic OR endurance OR "body composition" OR "body mass index" OR BMI OR anthropometry* OR flexibility OR speed OR agility.
2.2. Study Selection
The study selection was based on the population, interventions, comparisons, outcomes, and study design (PICOS) strategy. For studies to be included in the review, the following eligibility criteria were applied: focused on children and adolescents (population criteria); PL assessed by a validated scale and PF objectively assessed (outcome criteria); having an observational study design (study design criteria). No intervention or comparator criteria were established. Exclusion criteria included studies written in languages other than English, literature reviews, non-peer-reviewed studies or opinion articles, book chapters, and studies focusing on adult or older adult populations and people with PA-limiting diseases.
Two researchers (PM and IM) screened titles and abstracts to identify articles that met the inclusion criteria. In addition, the same two co-authors read the articles and decided whether to include them in the analysis or exclude them.
2.3. Data Extraction
Articles meeting the inclusion criteria were incorporated into the data extraction process by two researchers (PM and IM). Data regarding the country where the study was conducted, design, participants' characteristics, outcomes, instruments, and the main results of the included studies were extracted into a structured Table. Both completed the Table by entering the information for each article and then deliberated upon the extracted data to create the final data extraction Table.
2.4. Methodological Quality Assessment
Two researchers (PM and IM) independently evaluated the methodological quality of the included studies. The Newcastle-Ottawa Scale (NOS) was employed (18). A final score was assigned to each study based on three broad perspectives: selection of the study groups, comparability among different groups, and the outcome. The results were compared, and any inconsistencies were discussed until a final score was reached. A third researcher was consulted in the event of a disagreement between the first two researchers. Studies with quality scores below 4 points were categorized as low-quality, whereas those with scores of 5 or higher were considered high-quality investigations.
3. Result
3.1. Study Selection
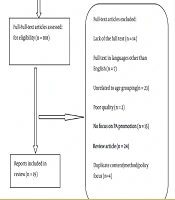
The database search identified 556 records; 328 duplicate entries were eliminated. Two hundred twenty-eight records were screened by title and abstract, and 138 studies were excluded. Thus, 90 studies were assessed for eligibility. After analyzing the eligibility criteria, 81 studies were eliminated. Only nine studies were included in the final systematic review (15, 16, 19-25). The PRISMA flowchart that summarizes the study identification process is shown in Figure 1.
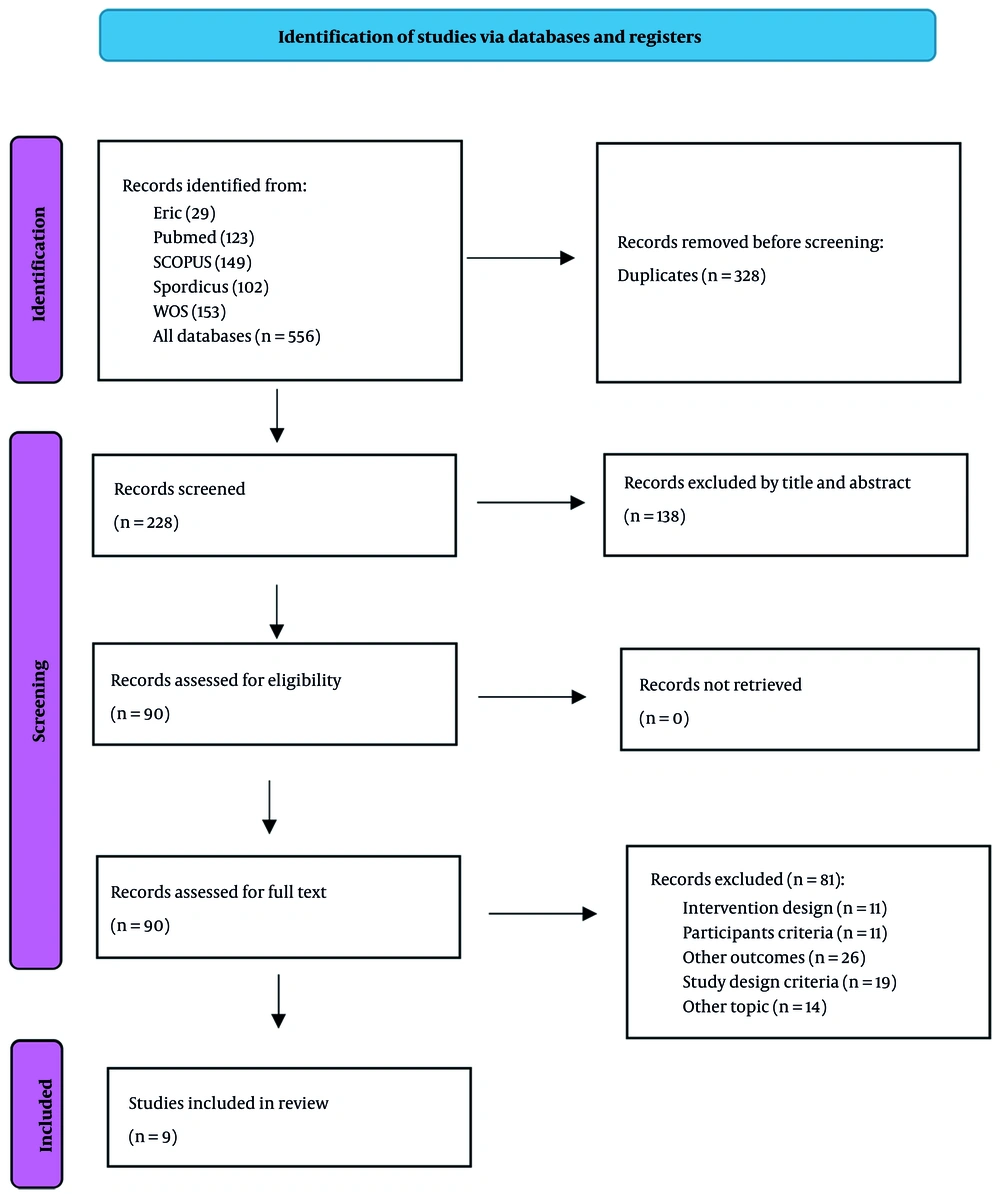
Figure 1.
PRISMA flowchart
3.2. Study Characteristics
The study characteristics are presented in Table 1. Regarding the publication date, there are three studies from 2018 (15, 20, 21), two from 2021 (23, 25), one study from 2020 (19), and one from 2022 (16). The most recent studies were from 2023 (22, 24). Concerning the places where the studies were conducted, three were from Canada (15, 19, 20), two were from Spain (23, 25), one from Croatia (16), one from the USA (21), one from France (24), and one from China (22). All study designs were cross-sectional.
Table 1.
Summary Table of Studies Included in the Systematic Review
| Author (y) | Objective | Sample | Instruments | Main Results |
|---|---|---|---|---|
| Lang et al. (2018), (15) | Examine links between cardi-orespiratory fit-ness (CRF) and PL domains. | 9,393 Canadi-an children aged 8–12. | 20m shuttle run test, CAPL as-sessment. | Higher CRF was positively as-sociated with all PL domains. |
| Gilic et al. (2022), (16) | Validate Croa-tian PL question-naires and relate them to PF. | 544 Croatian adolescents. | CAPL-2 KU, PLAYself, fitness tests (jump, sit-ups, endurance). | Higher cogni-tive and affective PL scores were linked to better PF. |
| Caldwell et al. (2020), (19) | Explore rela-tionships between PL, PA, and health in children. | 222 children, mean age 10.7 years. | PLAY tools, accelerometers, body fat, fitness tests, blood pres-sure, quality of life. | Higher physi-cal literacy was linked to better fitness, lower body fat, and higher quality of life; activity me-diated fitness on-ly. |
| Delisle Nystrom et al. (2018), (20) | Compare phys-ical literacy do-mains by weight status and their in-terrelations. | 8,343 Canadi-an children aged 8–12. | CAPL assess-ment across four domains. | Healthy-weight children scored higher; all do-mains were posi-tively related, with slightly stronger links in healthy-weight group. |
| Gu et al. (2019), (21) | Examine rela-tionships between motor compe-tence, PF, PA, and fit-ness knowledge in young children. | 408 preschool children, ages 4–6. | Motor skill tests, fitness tests, PA logs, fitness knowledge ques-tionnaire. | Motor compe-tence and fitness knowledge were positively associ-ated with PA and over-all fitness. |
| Liu et al. (2023), (22) | Investigate how body weight status relates to PL in Pakistani school children. | 3,204 children aged 8–12 years. | International PL Assessment (PAK-IPPL), BMI meas-urements. | Over-weight/obese children had lower PL scores, highlight-ing weight status as a factor influ-encing PL devel-opment. |
| Mendoza-Munoz et al. (2021), (23) | Assess the link between body composition and PL in children. | 135 Spanish children aged 8–12 years. | CAPL-2, body composition (BMI, fat percent-age). | Higher body fat was linked to low-er physical litera-cy scores. |
| Nezondet et al. (2023), (24) | Explore rela-tionships between perceived physi-cal literacy, fit-ness, body com-position, and ac-tivity levels. | 310 secondary school students. | Perceived PL Scale, cardi-orespiratory fit-ness test, body composition, ac-tivity question-naire. | Higher per-ceived PL was as-sociated with bet-ter fitness, health-ier body composi-tion, and more PA. |
| Pastor-Cisneros et al. (2021), (25) | Examine the re-lationship be-tween PL and self-perceived fitness. | 177 children and adolescents. | CAPL-2, self-perceived fitness questionnaire. | Strong positive link between PL and self-perceived fitness levels. |
Abbreviations: PA, physical activity; PF, physical fitness; PL, physical literacy.
3.3. Participant Characteristics
The total sample size of the nine included studies was 12228 children (girls, n = 6222; boys, n = 6006). Despite this, one study did not specify the number of girls and boys (20).
Five studies focused on children aged 8 to 12 years (15, 20, 22, 23, 25). The study by Nezondet (24) reported an average age of 12.1 ± 0.4 years (24). In Gu et al. (2018) (21), the participants' ages ranged from 8 to 9 years (21), Gilic et al. (2022) (16) focused on ages 14 to 18 years, and Caldwell et al. (2020) (19) included children aged 10 to 12.
3.4. Outcomes (Instruments)
Regarding PF outcomes, six studies evaluated body composition. The most used measure was BMI in four studies (19, 20, 22, 23). One study also evaluated body fat percentage (19). Two studies evaluated body composition with bioimpedance (24, 25).
Regarding the PF tests, CRF was evaluated in five studies (16, 19, 20, 24). The tests used differed across studies, including treadmill time, 60s heart rate recovery, multilevel endurance test, 15- or 20-meter shuttle run test, 20-meter adapted walk/shuttle run test, and Progressive Aerobic Cardiovascular Endurance Run (PACER). Muscular strength was assessed in three studies (16, 20, 25), by handgrip, abdominal plank, and sit-ups for 30 seconds. Other PF tests, such as the standing long jump, 30 seconds sit-ups, and sit-and-reach (16), were also used. One study used the FitnessGram and Motor Skill (PE Metrics™) batteries (21), and another study assessed resting systolic blood pressure (19).
Three studies evaluated PF components while also measuring PA levels, with two of these studies utilizing accelerometry to gather PA data (19, 21) and one using the Youth Risk Behavior Surveillance System Questionnaire (24).
Regarding PL, the most used questionnaire was the Canadian Assessment of PL -2, which was used in four studies (16, 22, 23, 25). The CAPL questionnaire was also used in two studies (15, 20). The PLAYself questionnaire was used in two studies (16, 19). The survey from Caldwell (2020) (19) also used two more questionnaires, PLAYfun and PLAYparent. Gu et al. (21) used a standardized written test. Finally, Nezondet et al. (24) used the Perceived PL Instrument (PPLI) Questionnaire.
3.5. Main Results
Five authors reached the same conclusions regarding the association between children with a healthy weight and children with an unhealthy weight and PL. Children with a healthy weight had higher PL scores than children with an unhealthy weight, despite being overweight or obese (19, 20, 22-24). By sex, one study found that boys had higher PL levels than girls, but in both sexes, PL was associated with PF (16). Another study also revealed a discrepancy in PL between sexes (21). Other studies also found an association between CRF and PL (15, 24, 25). One study found that PL and aerobic fitness are associated, with moderate-to-vigorous physical activity (MVPA) mediating the association (19). Also, the survey exploring systolic blood pressure and heart rate recovery found that both variables were positively associated with PL (19).
3.6. Quality Assessment
The NOS was used to assess the methodological quality of the included studies, as shown in the Table. The scores ranged from 2 to 3 on a 9-point scale. This reveals low quality among the studies. However, we must consider that six items were not scored because of the nature of the included studies. For example, the analysis of outcome item 7 was not scored because the studies used self-reported measures. Items 8 and 9 asked about follow-up, but no study considered it.
4. Discussion
This systematic review explored the relationship between PL and PF outcomes, particularly among children and adolescents. In summary, the present study found that PL is positively associated with PF, specifically with body composition and CRF outcomes, indicating that PL can be an essential influence on improving health and extending lifespan.
Our findings showed that children of average weight had significantly higher PL scores across all domain scores, except the knowledge domain. Other evidence supports this finding, such as an investigation with 1360 children, which found that children with average weight had significantly higher PL (22). This association between healthy weight and improved PL is likely mediated by PF, as overweight and obesity are associated with worse PF (26, 27). Weight status can significantly affect an individual's PF (22). For instance, Dumith et al. (2010) (26) found that higher BMI is inversely associated with PF indicators such as cardiovascular endurance and muscular strength.
Similarly, Ho et al. (2021) (27) reported that obese individuals often exhibit reduced aerobic capacity and muscle function. Furthermore, obese children perform less daily activity related to PA than non-obese children, and this directly impacts PF (28). Also, worse physical competence was shown in overweight children compared to those of average weight (29).
An examination of which PL domains are strongly associated with body composition reveals that confidence and motivation are more strongly associated with body composition than other domains (22). These results indicated that healthy-weight children exhibited higher levels of these psychosocial variables than unhealthy-weight children. However, a weak correlation was observed between knowledge and understanding and the other domains of PL in average-weight and overweight/obese children (23).
Another contribution to the PL field highlighted by our study is the association between CRF and PL. As expected regarding PL components, the three included studies found the strongest associations between CRF and physical competence, followed by motivation and confidence (15, 24, 25). Optimal CRF is crucial for maintaining and promoting overall health in children and adolescents, as it enhances cardiovascular efficiency, supports metabolic function, and reduces the risk of chronic diseases (30). One included study found that the association between PL and PF was mediated by moderate-to-vigorous PA (19). Thus, enhancing PA across different domains could be a promising strategy for improving PF and PL, such as strengthening active transportation to school or incorporating active breaks during class (13).
Two studies used the 20-meter SRT to assess CRF (PF outcome) and found a strong association with PL (15, 23). Lang (2018) (15) suggests that this test could be a straightforward screening tool for identifying children with low PF. This approach could save time and be a valuable resource in school-based settings.
Our systematic review identified that one of the included studies found that boys have significantly higher levels of PL than girls. This difference in PL during childhood may have long-term implications, potentially influencing engagement in PA and sports later in life. Empirical evidence indicates that men are generally more engaged in PA and sports during adulthood (European Commission, 2022) (31). Therefore, early differences in PL may contribute to sustained sex disparities in PA participation throughout the lifespan.
Regarding the instruments used to assess PL, the CAPL and the PLAY assessment tools are the most popular and commonly used in research (32). The CAPL aims to provide a reliable, feasible, and valid instrument to assess PL in children (33). The PLAY represents a series of assessment tools to evaluate the multiple domains of PL (32). The CAPL was created to address the lack of objective PL data and provides a robust and comprehensive aggregate assessment of PL.
One of the included studies, conducted in Croatia, reveals an important finding regarding PL domains, concluding that adolescents with higher cognitive and affective PL domains have better PF (16). Another study in Portugal supported this finding, revealing a strong association between cognition and PF (34). We believe that our study made an essential contribution to the field of PL and health, as PF is a health outcome. To our knowledge, this is the first systematic review that analyzed the association between PL and PF. We included studies from three continents (America, Asia, and Europe), providing comprehensive worldwide evidence.
Due to limitations, such as the cross-sectional design of the included studies, the findings should be interpreted cautiously, as causality cannot be established. Additionally, these studies did not account for potential confounding factors like biological maturation, socioeconomic status, or ethnicity, which may influence the outcomes.
The findings of our systematic review highlight crucial implications for enhancing PL and PF among children and adolescents. A key question emerges: what should be the primary focus of intervention efforts? Should we prioritize improving PF, PA, or PL? While PL serves as a foundational concept underpinning engagement in PA, evidence suggests a bidirectional relationship in which PA and PF can enhance PL, and improvements in PL can, in turn, promote greater PA and PF. Another recent investigation also demonstrated this bidirectional association (11).
4.1. Conclusions
Physical Literacy is suggested as the foundation for fostering an active lifestyle and serves as a prerequisite for engagement in PA. As PL is an emergent field of study, the evidence supporting associations between PL, PF, and health is limited. In this sense, this systematic review makes an excellent contribution by supporting more studies, mainly longitudinal studies, that link PL to health. The findings of this study have significant implications for children's health by offering policymakers and health professionals a more nuanced understanding of the relationship between PL and PF. This insight can guide the development of more effective public health strategies and educational programs that promote PL.