1. Background
Achilles tendon mechanical properties adapt to chronic increases (1) or decreases (2) in mechanical loading. Few data exist on the effects of physical training on Achilles-Tendon mechanical properties on children (3, 4). Recently, it has been shown that Achilles tendon stiffness significantly increased (29%) after a 10-week resistance training in pre-pubertal children (3, 4)) whereas throughout the same study no change in tendon CSA has been mentioned (4). Therefore, the immature human Achilles tendons respond to short-term resistance training similarly to mature tendons (5).
It is worth mentioning that the tendon stiffness has a great impact on the rate of force development (RFD). This is due to the fact that the time a stiff tendon needs to stretch is shorter, affecting the movement performance (6). Previous studies with adult participants have demonstrated that there are simultaneous increases in tendon stiffness and RFD after a period of resistance training (RT) (7, 8). However, no change has been found in RFD and strain in children after resistance training (5) because of the reduced capacity of motor unit recruitment as adults (9). Thus the above findings (6, 10) make it clear enough that training adaptations on the mechanical properties of muscle-tendon complex are quite different in children compared to adults. However, there has not been related study so far.
Plyometric training appears to induce favourable neuromuscular and also musculo-tendinous adaptations to children as well as to adults (7, 11). Previous studies showed an increase in AT stiffness in adults after PL training (12), while other studies found no significant changes (7). Controversial results may be due to methodological differences or differences in adaptations between various elements of the muscle-tendon complex (13). A few research studies in children showed improvement in running (14, 15) and jumping abilities (16, 17), and rate of force development (18) after plyometric training. Such effects may be accompanied by alteration of tendon mechanical properties which partially explain performance improvements (13, 17). However, plyometric training may increase the risk of muscle or tendon injuries, especially in children. Therefore, the use of guidelines for a safe application of such training has been proposed (19).
Plyometric exercises on soft surfaces may potentially reduce the mechanical load on the musculoskeletal system and improve the training effect of the muscle-tendon complex simultaneously (17). Previous research studies in adults suggested that jumping on a mini-trampoline is accompanied by a reduced crouching action, it facilitates movement speed (20, 21), leg stiffness (22) and proprioception (23). The impact of mini trampoline exercises on Achilles tendon properties and strength performance in healthy pre-pubertal children have been not investigated yet. Examination of the effects of plyometric training on a trampoline may be useful as far as safety and effectiveness on children are concerned.
2. Objectives
The aim of this study was to examine the impact on Achilles tendon strain and explosive isometric force production after plyometric training on two different surfaces in children. The research hypothesis was that plyometric training on a trampoline (TPL) may result in greater changes of Achilles tendon (AT) mechanical properties and explosive force production capacity than a traditional plyometric (GPL) program.
3. Methods
3.1. Subjects
Twenty one girls and fifteen boys (age = 9.30 ± 0.55 years, height = 130 ± 8.15 cm and mass = 36.30 ± 8.32 kg) volunteered to participate in this study. The anthropometric characteristics of the participants are described in Table 1. None of the participants had any previous musculoskeletal injury of lower limbs while they had not previously taken part in systematic training. They were allocated randomly to 1 of 3 groups: ground plyometric training group (GPLG, 6 girls and 6 boys, n = 12), Trampoline plyometric training group (TPLG, 7 girls and 5 boys n = 12) and control group (CG, 8 girls and 4 boys n = 12). The GPLG and TPLG groups followed a plyometric training protocol on different landing surfaces while the CG attended the standard physical education curriculum at school. The local University Ethics Committee approved the study. All parents or legal guardians signed a consent form, prior to participation.
Table 1.
Characteristics of the Study Participants
| Groups | Age, y | Height, cm | Weight, kg |
|---|---|---|---|
| TPLG (6 girls and 6 boys) | 9.25 ± 0.45 | 136 ± 4.18 | 33.83 ± 4.06 |
| GPLG (7 girls and 5 boys) | 9.17 ± 0.54 | 136.67 ± 8.15 | 36.67 ± 11.04 |
| CG (8 girls and 4 boys) | 9.50 ± 0.64 | 140.83 ± 10.22 | 38.42 ± 8.39 |
| TOTAL (21 girls and 15 boys) | 9.30 ± 0.54 | 137.84 ± 7.51 | 36.26 ± 23.49 |
3.2. Procedure
Both training groups (GPLG and TPLG) performed only the intervention protocols during the course of physical education at the primary school, whereas the control group (CG) followed their regular physical education lessons (3 sessions per week) during the 4-week training period. Both the physical education teacher at school and one of the researchers of this study were always available during the training to check that the suitable technique and total of repetitions were strictly followed and recorded.
All children were encouraged to continue their daily activities during the intervention period. All groups were tested pre and post training period and there were no significant differences between control and experimental groups’ descriptive data. The maximum plantar flexion torque and tendon properties were evaluated before and immediately after the training period.
3.3. Training Protocol
3.3.1. Plyometric Training Protocols (TPLG and GPLG)
The training period lasted 4 weeks. The participants performed 3 training sessions (each lasting 45 min) per week. All experimental groups performed a standardized 10-min warm-up including jogging, stretching exercises of lower limb muscles and low intensity plyometric exercises. Both training groups performed 10 sets of 8 jumps (hopping in place) (10 X 8) during the first 2 weeks, 10 sets of 10 jumps (10 X 10) during the third week and 10 sets of 12 jumps (10 X 12) during the fourth week. The TPL group performed double-leg hops on a mini trampoline while the GPL group performed the same jumping exercise on the ground surface. The rest interval between sets was 2 minutes.
3.4. Testing Procedures and Instrumentation
3.4.1. Ankle Joint Torque Testing
The ankle joint torque was determined using an isokinetic dynamometer (Cybex Humac Norm, CSMI, MA, USA). The analog signals (torque, angular position and angular velocity) from the dynamometer were amplified using a DA 100 B amplifier (Biopac Systems. Inc., Goleta, CA, Common mode rejection ratio > 90 db, bandwidth = 0.05 - 500Hz). The subjects lied supine with relative internal hip, knee and ankle angles of 180º, 180º and 90º respectively. In this joint modulation the gastrocnemius muscles were at mechanically advantageous length for maximal force production (24). The axis of their right ankle was aligned with the axis of rotation of the dynamometer. The subjects were stabilized with straps on the isokinetic dynamometer with the knee fully extended and a twin axis electronic goniometer (Biopac ss21) was used to record joint angle during isometric testing.
The isometric torque of the ankle plantar flexors was evaluated at the angles of -15° (dorsiflexion), 0° (neural position) and 15° (plantar flexion). Prior to test, they performed five submaximal isometric plantar flexion contractions (MVC) to become accustomed to the test procedure. In each condition, the subject was initially asked to relax the plantar flexors and they were instructed to push as hard and fast as possible. The subjects then performed three plantar flexion MVCs with a maximum RFD at each angle with at least 1 min between trials. These contractions were followed by three ramp contractions, each lasting 10 s with a 4 minutes rest between trials. During each ramp contraction, the participants gradually increased their level of effort from rest to 20, 40, 60, 80 and 100% of MVC with visual feedback of the target torque displayed on a computer monitor at eye level. Before each plantar-flexion the axis of rotation of the dynamometer was defined to be parallel to the axis of rotation of the ankle joint.
3.4.2. Measurement of Achilles Tendon Elastic Properties
An ultrasonic apparatus (Aloka SSD 3500, Japan) with a 7.5 MHz linear array ultrasound probe was used to visualize the distal myotendinous junction (MTJ) region and the aponeurosis of the gastrocnemius medialis (MG). The ultrasound videos were recorded at 25 Hz and stored digitally. Both Cybex and ultrasound videos were interfaced to a Biopac MP100 Data Acquisition unit. The video images were digitized and analyzed by Max TRAQ lite software (Max Traq Lite version 2.09, Innovision Systems,Inc., Columbiaville, Michingan. U.S.A). GM MTJ positional data were low-pass filter educing a fourth-order, zero-lag Butterworth filter with a 3.25-Hz cut-off frequency (Figure 1).
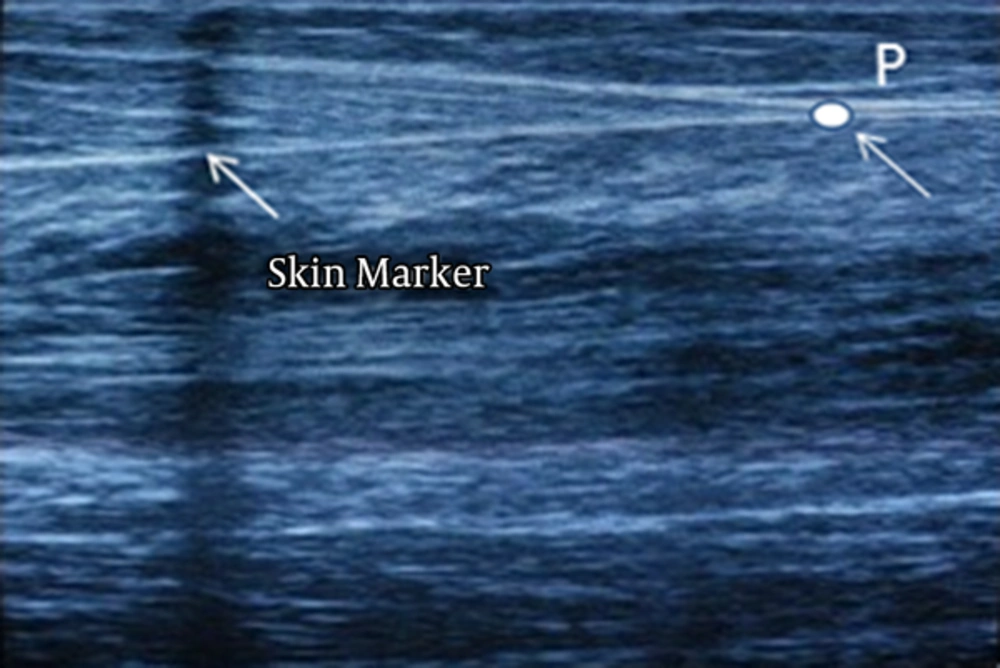
Figure 1.
The displacement of the analyzed cross-point in relation to the skin marker was defined as measured elongation of the tendon.
The ultrasound probe (US) was secured with special straps on the limb to avoid any displacement. A visual skin marker was placed between the skin and probe, providing a reference point (P) , to ensure no displacement of the probe during the measurement of GM MTJ and clearly displaying both the separation between the aponeuroses of the GM and the tendon (MTJ) simultaneously (24) (Figure 1). During the analysis, a continuously visible point (P) where particular deep aponeuroses were attached at the tendon was chosen.
3.4.3. Joint Correction
The displacement of the GM MTJ was measured during rest and several levels of effort. The passive mode data were used to correct the elongation of MTJ caused by ankle rotation during the main isometric testing (24). Consequently, before isometric tests, a passive motion test at 5°/s in a range of motion (80° and 135°) was performed. The displacement of each ultrasound (US) image point marker during the passive joint movement was used to correct MTJ elongation values caused by ankle rotation during the main isometric testing (24). Subsequently, the video images obtained during ramp contraction were used to digitize (in each frame) the following points: the MTJ and tendon. The examined parameters (torque and AT strain) were analyzed at 20% increments, from 0% to 100% MVC.
3.4.4. Rate of Torque Development (RTD)
RTD was defined as the rapid slope of the torque-time curve obtained during isometric contractions. We defined as RTD the mean slope of the torque-time curve between 20 and 80% of the maximal torque.
3.4.5. Calculation of Tendon Strain
Resting length of the AT was measured as the linear distance between its insertion on the calcaneal tuberosity and the GM MTJ, measured at a neutral ankle position under passive mode. The elongation was measured as the displacement of the distal myotendinous junction of the MG in the transition from a resting state to MVC (24). Peak tendon strain was defined as the relative elongation of the tendon associated with peak tendon force relative to its resting length (Figure 1).
One week before the main test, the subjects completed the whole testing procedure to familiarize with the tests. Before the test, the participants performed a standardized warm up. They then performed three submaximal plantar flexion efforts. The repeatability of plantar flexors’ torque measurements was investigated in a preliminary study with 20 boys and girls on two separate days. The ICC was 0.87 for peak plantar-flexion torque, and 0.83 for tendon strain estimation, respectively.
3.5. Statistical Analysis
A three-way repeated measures analysis of variance (Group X Time X Level of MVC) was used to examine the effects of time (PRE - POST), group (TPLG, PPLG, Control) and level of MVC effort (5 levels) at each of three different angles (-15°, 0°, 15°) on each dependent variable. Post hoc Tukey tests were used to examine significant effects. The level of significance was set at P < 0.05.
4. Results
4.1. Achilles Tendon Strain
The present findings indicate that plyometric training performed on a mini-trampoline or ground surface decreases tendon strain in children. Furthermore, Post-Hoc analysis revealed that the strain decreased for both experimental groups at 0°, 15° positions for all levels of effort.
However, the ANOVAs showed non-statistically significant three-way interaction effects (P > 0.05) on tendon strain for all angular position tests.
The results for AT strain at neutral position (0o) are presented in Figure 2. The ANOVA indicated a significant main effect of time (F1,33 = 20,434 P = 0.001) and significant “Group X Time” interaction effect on strain at the neutral position (0°) (F 2,33 = 3,531, P = 0.04). Post-Hoc analysis revealed a significant decline in AT strain for the two experimental groups, but not for the control group. Furthermore, there was a significant main effect for “Level of effort” and interaction effect for “Level of Effort X time” on strain (F 4,132 = 929,763, F 4,132 = 9,762, P = 0.001, respectively). Post-Hoc analysis showed that strain significantly decreased for the TPLG and GPLG but not for the control group. There were no statistically significant effects for “Effort Level X Group” (F 8,132 = 0,584, P = 0.539).
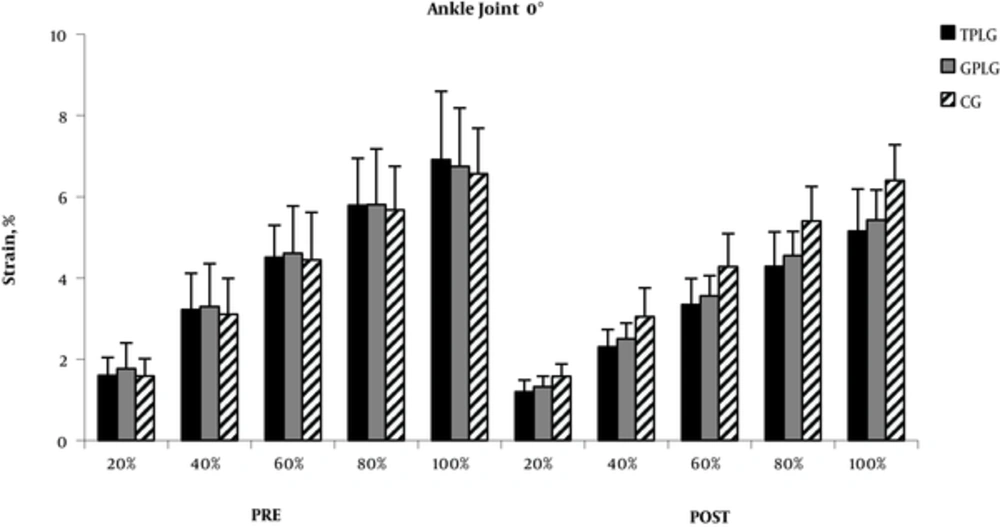
Figure 2.
Mean Changes in Tendon Strain Using Ramp Isometric Contraction in the 0°angle of ankle, in 5 Different Force Levels (20-40-60-80-100%) After Plyometric Training for Trampoline (TPLG), Ground (GPLG), and Control (CG) Group, Before (PRE) and After (POST) the Training *P < 0.05.
For the test performed at 15° ankle plantar flexion, the ANOVA indicated a statistically significant “Time” and “Level of Effort” main effect (F 1,33 = 7,250, F 4,132 = 881,153, P = 0.011, P = 0.001, respectively). Post-Hoc analysis showed a decreased strain after training for both experimental groups but not for the control group. There were no statistically significant effects of “Group X Time” and “Effort Level X Group” (F 2,33 =1,815, F 8,132 = 0,296 P = 0.179, P = 0.611, respectively), as well as for the “Level of Effort X Time” (F 4,132 = 0,952, P = 0.386).
For the -15° ankle angle (dorsiflexion), the ANOVA also showed a statistically significant effect of “Time” (F 1,33 = 18,899, P = 0.001) and “Group X Time” (F 2,33 = 3,466, P = 0.043) on strain. Post-Hoc analysis showed that only the two experimental groups showed a decreased strain after training. There were also significant effects for “Level of Effort” (F 4,132 = 900,253, P = 0,001) and “Effort Level X Group” (F 8,132 = 5,141, P = 0,004), and for “Level of Effort X Time” (F 4,132 =11,579, P = 0,001). Post-Hoc analysis revealed that the strain decreased for both experimental groups for all levels of effort but there was no difference in AT strain between two experimental groups whereas strain was unchanged for control group
4.2. Ankle Joint Torque and RTD
The main findings of this study showed that both training groups had increased PAT and RTD, for all angular positions, post training. Furthermore, statistically significant increases in PAT (30%) and RTD (14%) (P < 0.05) were found for the TPLG while for the GPLG group the increase was 19 % and 8% for PAT and RTD, respectively (P < 0.05).
The results for recorded torque for all angular position tests before and after training are presented in Table 2. For all angular position tests, the ANOVA designs showed a statistically significant main effect of Time (for neutral position, F 1,33 = 32,063, P = 0,001, , for 15° ankle plantarflexion, F 1,33 = 39,321 P = 0,001 and for -15° ankle dorsiflexion, F1,33 = 8,874, P = 0.004 ) and a ‘Group X Time” interaction effect (for neutral position, F 2,33 = 11,825, P = 0,001, for 15° ankle plantarflexion, F 2,33 = 12,517, P = 0,001 and for -15° ankle dorsiflexion, F 2,33 = 3,159, P = 0.056 ). Post-Hoc analysis showed that two experimental groups improved joint torque after training (P < 0.05) while no change for the control group was observed. For the neutral position test, the TPLG showed a greater torque increase than the GPLG after training but this increase had no statistical significance.
Table 2.
Pretraining and Posttraining (mean ± SD) changes of Maximum Ankle Torque (PAT) and Rate of Torque development (RFD) measured at 3 different ankle angles (0°, 15°, -15°)
| PEAK TORQUE (Nm) | Rate of Torque Development, Nm.sec-1 | |||
|---|---|---|---|---|
| PRE | POST | PRE | POST | |
| Ankle Joint Angle 0° | ||||
| TPLG | 31,23 ± 10,18 | 42,58* ± 9,53 | 62,18 ± 9,082 | 70,31* ± 10,72 |
| GPLG | 31,5 ± 9,05 | 37,72* ± 6,79 | 61,29 ± 9,652 | 65,63* ± 12,18 |
| GPLG | 31,59 ± 10,85 | 31,04 ± 8,95 | 61,45 ± 4,797 | 62,54 ± 9,611 |
| Ankle Joint Angle 15° | ||||
| TPLG | 23,11 ± 7,31 | 34,39* ± 7,6 | 57,52 ± 12,344 | 65,37* ± 9,656 |
| GPLG | 23,8 ± 6,19 | 30,80* ± 7,43 | 56,76 ± 10,849 | 61,75* ± 11,42 |
| GPLG | 23,12 ± 5,4 | 22,82 ± 4,51 | 57,29 ± 3,920 | 57,71 ± 12,85 |
| Ankle Joint Angle -15° | ||||
| TPLG | 38,16 ± 13,99 | 49,95* ± 8,66 | 65,68 ± 8,947 | 75,13* ± 12,21 |
| GPLG | 37,53 ± 18,37 | 42,46*± 7,02 | 65,29 ± 8,747 | 70,37* ± 12,26 |
| GPLG | 37,19 ± 7,84 | 37,39 ± 8,4 | 65,18 ± 6,437 | 65,73 ± 10,42 |
For the RTD measurements, there was a non-statistically significant “Group X Time” effect (F 2,33 = 1,33, P = 0,278) for the neutral position test. In contrast, the ANOVA showed a statistically significant “Group X Time” interaction effect on RTD at 15° plantarflexion (F 2,33 = 6,195 P = 0.019) and 15° dorsiflexion angle (F 2,33 = 6,523, P = 0.03). Post-Hoc analysis showed that there was no difference in RTD between two groups, TPLG and GPLG after training in three different ankle angles. No other significant interactions were found (P > 0.05) (Figures 3 and 4).
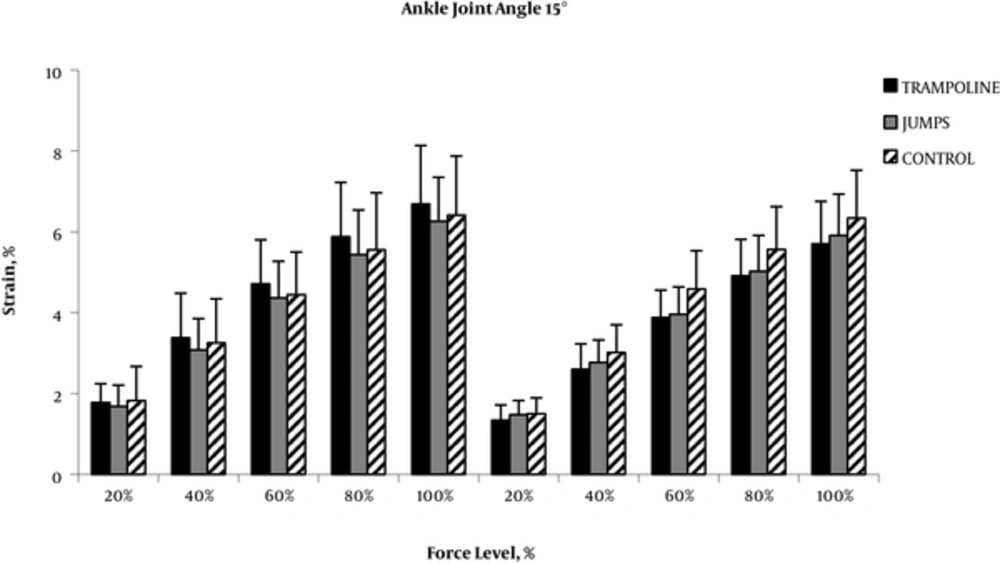
Figure 3.
Mean changes in tendon strain using ramp isometric contraction in the 15° angle of ankle, in 5 different force levels (20-40-60-80-100%) after plyometric training for Trampoline (TPLG), Ground (GPLG), and Control (CG) groups, before (PRE) and after (POST) the training *P < 0.05.
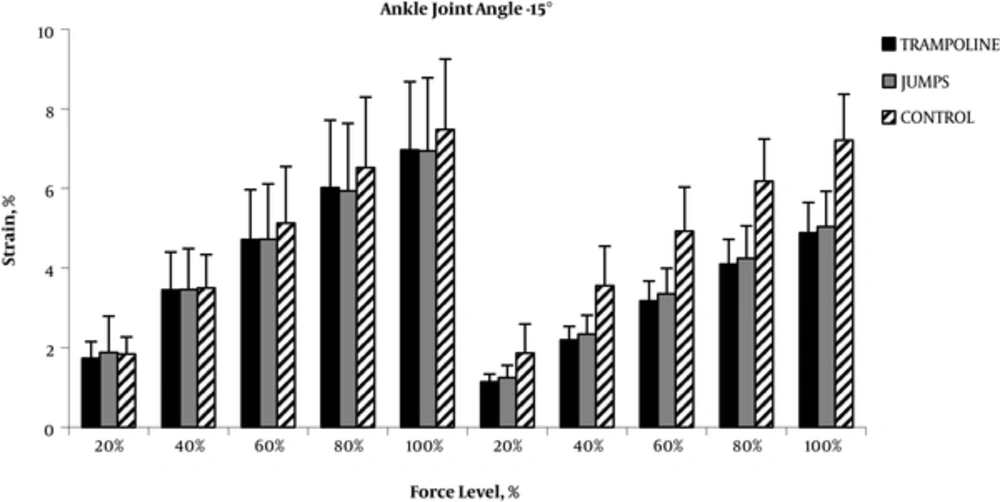
Figure 4.
Mean changes in tendon strain using ramp isometric contraction in the -15° angle of ankle, in 5 different force levels (20-40-60-80-100%) after plyometric training for Trampoline (TPLG), Ground (GPLG), and Control (CG) groups, before (PRE) and after (POST) the training *P < 0.05.
5. Discussion
The main finding of this study was that AT strain decreased after plyometric training performed on a mini-trampoline or ground surface. This was accompanied by an increase in maximum ankle MVC torque and an increase in RTD (at selected positions) for both experimental groups. Secondly, there was no difference in AT strain and strength adaptations between the experimental groups. To our knowledge, this is the first study which compares tendon adaptations in children after plyometric training performed at different surfaces.
5.1. Strain
The present findings indicate that plyometric training decreases tendon strain in children, which is indicative of an increase in tendon stiffness after training. These results confirm previous suggestions that children’s immature tendons adapt to training stimuli in a similar way as adults (1, 4, 12). For instance, previous studies in adults (1, 12)) have shown that AT stiffness increased after 6 and 8 weeks of plyometric training, respectively. Similarly, in pre-pubertal children, Wauge et al. (5) reported that 10-weeks resistance training resulted in a significant increase of AT stiffness although no change in tendon CSA has been reported (4). Several factors may account for this observation. Particularly, the increased tendon stiffness after plyometric training has been attributed to increases in tendon cross-sectional area (25) or by neural adaptations (26). Further, increased stiffness might be a result of changes in the tendon’s structure such as alterations in collagen fiber’s internal alignment (27).
In the present study, our expectation was that plyometric training on an elastic surface would affect tendon strain more than training on a rigid surface. However, the results did not confirm our research hypothesis, as no differences in tendon strain adaptations between plyometric training performed on a trampoline and training performed on the ground were found. To our knowledge, the effects of plyometric training on an elastic surface on mechanical properties of AT in children have not been previously investigated. Studies in adults reported that subjects who exercise on elastic surfaces first extend the legs and then compress exactly out of phase with surface deformation, increasing leg stiffness and rebound gain (28). Crowther et al. (29) also have shown that landing on a trampoline is accompanied by “stiffer” joint technique via optimization of the lower impact forces and the elasticity of trampoline. This may improve the transfer of training gains to maximal plantar flexor performance within a specific ankle range of motion (28). Our results indicate that despite any differences in plyometric exercise technique between mini-trampoline and ground surface, AT strain adaptations did not differ after a 4-week program in children. Nevertheless, it was interesting that that tendon’s strain at 0° and 15° joint angles showed a 25% decrease for the TPL group which is almost double the corresponding decrease (15%) for GPL group. This indicates that perhaps the intervention period might have been too short to induce significantly different adaptations in tendon strain between the two plyometric programs. Another possible explanation is that plyometric training on different surfaces induces specific adaptations in different parts of the muscle-tendon complex (30).
5.2. PAT and RTD
The results of this study showed that both training groups had increased PAT and RTD post training. This is in agreement with previous findings (17, 31) which suggest that short-term intensive plyometric training increases plantar flexor muscle strength and rate of strength development in children. A review of literature in adults also confirmed the relative increase in ‘explosive’ muscle strength following a plyometric intervention (26). In contrast, Wauge et al. (5) reported insignificant changes in RFD after resistance training using slow movement velocities in pre-pubertal children. This difference could be attributed to a different type of training (resistance training at slow speed) applied by Wauge et al. (5) compared to fast plyometric exercises performed by the experimental groups in the present study. We can assume that because both plyometric exercises involve explosive force development, the increase in RTD after plyometric training may be explained by the training-specificity principle. In addition, the improvement of RTD observed in this study might also be explained by the decline of tendon strain. Particularly, a reduction in tendon strain indicates that a greater muscle fiber shortening velocity is needed to take up tendon slackness. In fact, the significant relationship between tendon slack length and electomechanical delay, and, hence, RFD was confirmed by Muraoka et al. (32) and Waugh et al. (6). The relation between changes in RFD and tendon stiffness has been demonstrated in children as well as in adults (6). Collectively, the changes in rapid torque development accompanied with the decreases in tendon strain indicate that changes in tendon stiffness elicited by the plyometric training (≈ 25%) are sufficient enough to affect RFD in children.
It has been suggested that the training surface form during plyometric workout could affect the SSC kind being performed (extended technique), indicating different responses (28). For example, Moritz et al. (28) reported that the ankle joint assumes a more flexed posture during hopping on elastic surfaces that increase joint mechanical work output during takeoff by changing the timing of peak muscle moments. Therefore, it may be proposed that depending on the type of jumping stimulus, one may expect analogous plyometric training adaptations in peak torque and RTD. However, in contrast to our research hypothesis, both plyometric training programs resulted in similar increases in PAT and RTD (Table 2). There are two factors which might have contributed to this result. First, as already explained, the length of the intervention might have not been long enough to induce significant differences between the two plyometric training groups. This is supported by the observation that the increase in PAT and RFD at some angular positions displayed after training by the TPLG was almost double the increase observed after GPLG training. Second, it is possible that the similar increase in explosive force output after both training programs might be due to different neuromuscular adaptations. This is based on the finding that training on elastic surfaces improves sensorimotor control as well as the proprioception (33) while plyometric training on rigid ground may rely on a more effective use of the stretch-shortening cycle (26).
The use of plyometric training in children is often considered less safe (19). Trampoline surfaces have rebound characteristics and the impact forces experienced by the body when landing on trampoline might be different to those experienced when landing on the ground (29). The above partly explain performance improvements after plyometric training in compliant surfaces without increasing the risk for muscle or tendon injuries in childhood (19) Furthermore, training surface is a major factor concerning the differences in tendon behavior because it allows a greater protection in immature tendon structure by the imposed stress during the plyometric training without minimizing the efficiency of muscle-tendon complex (19, 23). If this is the case, then plyometric training on a mini trampoline results in similar AT strain and explosive strength adaptations to plyometric training on a rigid (ground) surface, probably with a lower injury risk. Therefore, such training may be well preferable over ground plyometric training for pediatric populations. However, further research is therefore required to understand better the effects of training on elastic surface in children regarding to both neural and mechanical adaptations. In addition, the training period might have been short enough to induce differences in adaptations between the two programs.
In summary, the present findings suggest that the developing Achilles tendon is at least as, if not more, capable of chronic increases in jumping as mature tendons. In the current study, similar changes in AT strain and explosive strength of the ankle muscles after plyometric exercise on a mini trampoline and ground surface were found. Therefore, either technique is equally effective in enhancing explosive power and AT strain.
In a practical sense, coaches might choose to use plyometric programs in children when they need to improve specific adaptations driving training-induced improvements in muscle tendon complex. Since in most cases, both injury avoidance and performance improvements are desirable, we could propose that plyometric exercises on trampoline should be preferred to traditional plyometric exercises, so that coaches could ensure the exercise load safely in young children.