
1. Background
Cataract is one of the most prevalent causes of visual impairment among older adults worldwide, leading to painless vision loss due to clouding of the eye's lens (1, 2). Its development is multifactorial, with advancing age being the primary risk factor (1, 2). Other contributing factors include female sex, family history, congenital anomalies, and ethnicity — particularly among African-American and Hispanic populations — as well as dehydration, dermatological conditions, allergies, ocular disorders such as glaucoma and retinitis, exposure to ultraviolet light, certain medications, hypertension, diabetes, other metabolic disturbances (e.g., hypocalcemia and hypothyroidism), and lifestyle factors such as alcohol consumption and smoking (3-5). Surgical intervention remains the most effective treatment for cataracts (6). In Iran, the prevalence of cataract surgery is increasing, currently exceeding 32.8%, with most patients aged 71 - 80 years (7). Considering the projected global increase in the older adult population, along with the United Nations' estimate that this demographic will double by 2050, societies are likely to face significant challenges associated with aging (8, 9).
Cataracts can adversely affect general health, increasing the risk of depression, social isolation, falls and fractures, dependency, and even mortality. Moreover, they can negatively impact both vision-related and overall health-related quality of life (QOL) (10). The World Health Organization (WHO) defines QOL as an individual's perception of their position in life within the context of their culture and value systems, in relation to their goals, expectations, standards, and concerns. It is a broad concept encompassing multiple dimensions, including physical health, psychological state, level of independence, social relationships, and interactions with the environment (11). The WHO has recently recommended that vision-related QOL should be considered when assessing and evaluating interventions in vision health (12). Studies have shown that QOL significantly improves after cataract surgery, with patients reporting greater satisfaction and better overall well-being (13-15). Improved vision also enhances the ability to perform activities of daily living, such as reading, watching television, walking, and working (1, 16). Nevertheless, some patients may continue to face challenges in daily life, highlighting the importance of structured post-discharge follow-up.
Patient education, empowerment, and follow-up have long been recognized as effective strategies for reducing post-discharge challenges. These interventions are particularly important for older adults, whose needs and responses may differ from those of younger patients. In recent years, post-discharge care and patient follow-up have gained increasing attention. Research indicates that systematic follow-up provides numerous benefits for patients (17). Tele-nursing has emerged as a cost-effective approach to support these follow-up efforts. Through tele-nursing, nurses can deliver care and education remotely, regardless of time or location, by leveraging telecommunication technologies (18). However, research on tele-nursing among older adults following cataract surgery remains limited, and this gap is even more pronounced in Iran.
2. Objective
This study aimed to examine the impact of a nurse-led educational program, combined with post-discharge telephone follow-up, on the QOL of older adults undergoing cataract surgery.
3. Methods
3.1. Study Design and Setting
This randomized clinical trial was conducted in 2024 at Valiasr Hospital in Borujen, Iran, among older adults scheduled for cataract surgery in the hospital's general surgery department (IRCT20240429061599N1).
3.2. Sample Size
Sample size estimation was based on the assumption of an effect size of 0.7, a type I error of 5%, and a type II error of 5%. The minimum required sample was calculated as 51 participants per group. To account for a potential 10% attrition rate, the final target was increased to 56 participants per group.
3.3. Eligibility Criteria
Participants were considered eligible if they were ≥ 65 years, were literate, possessed a personal Android smartphone, were able to answer phone calls, had no history of acute physical, mental, or cognitive disorders, and were scheduled for unilateral cataract surgery. Individuals with speech or hearing impairments or a personal or spousal history of cataract surgery were excluded.
3.4. Recruitment and Randomization
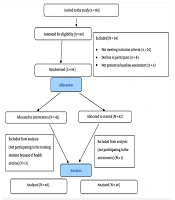
Participants were recruited through convenience sampling. After eligibility screening, they were randomly allocated to the intervention or control group using simple block randomization. A total of 112 patients were enrolled, with 56 assigned to each group according to the randomization sequence.
3.5. Procedures
For data collection, ethical approvals were first obtained from Yazd University of Medical Sciences. The researcher then accessed the hospital's surgical schedule to identify eligible patients. The study objectives were explained during face-to-face meetings, and written informed consent was obtained. For those who consented, baseline data were collected through structured interviews, after which randomization to either the control or intervention group was carried out.
3.6. Control Group
Patients in the control group received standard hospital care and education. The hospital supplied all patients with an educational pamphlet for postoperative care. When necessary, nurses provided additional explanations to patients and their families.
3.7. Intervention Group
In addition to routine care, participants in the intervention group received a structured educational program comprising a pamphlet based on up-to-date guidelines, an audio file, and a nurse-led training session. The educational content covered various subjects, including an introduction to cataract disease and its signs and symptoms, danger signs and symptoms after surgery, treatments (both pharmaceutical and non-pharmaceutical interventions), self-care after discharge, physical activity recommendations, sexual activity after discharge, and pain management after surgery. The educational content was reviewed by 7 experts in the field of medicine and nursing. Furthermore, they were followed up via telephone by a research nurse on the 3rd and 14th days after discharge. Each call, conducted in the morning and lasting 15 - 30 minutes, included an assessment of the patient's clinical condition and provision of tailored education to the patient and their family.
3.8. Measurements
Data were collected using a two-part instrument: (A) a demographic questionnaire and (B) the National Eye Institute Visual Function Questionnaire (NEI-VFQ). The original version (NEI-VFQ-51) contains 51 items designed to assess the impact of visual impairments on various dimensions of health-related QOL. For this study, the short form (NEI-VFQ-25), which has been translated into multiple languages, was employed. This version includes 25 items across three domains: (A) general health and vision status (4 items, 5-point Likert scale), (B) difficulty in performing activities of daily life (12 items, 6-point Likert scale), and (C) vision-related problems and their impact on tasks (9 items, 5-point Likert scale). The Persian version has previously demonstrated validity and reliability in Iran (19). In the present study, the questionnaire was administered to both groups at baseline and one month after discharge. After discharge, the questionnaire was completed via telephone by a research nurse.
3.9. Data Analysis
Data analysis was performed using SPSS version 21. Descriptive statistics (frequency, percentage, mean, and standard deviation) were applied for summarization. The Kolmogorov-Smirnov test was used to assess normality. Between-group comparisons were conducted with independent t-tests, while within-group changes were analyzed using paired t-tests.
3.10. Ethical Considerations
Participation was voluntary, and written informed consent was obtained from all participants. The study was approved by the Ethics Committee of Yazd University of Medical Sciences (IR.SSU.REC.1403.006). All ethical principles for human research — including confidentiality of information and the right to withdraw at any time — were strictly observed throughout the study.
4. Results
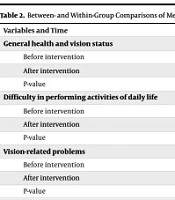
No significant differences were observed between the intervention and control groups regarding demographic characteristics (Table 1). Prior to the intervention, the independent two-sample t-test showed no significant difference in mean QOL scores between the groups (P = 0.696). Following the intervention, however, the mean QOL scores differed significantly between the two groups (P < 0.001). Within-group analyses using paired t-tests revealed significant improvements in QOL scores in both the control group (P < 0.001) and the intervention group (P < 0.001). Notably, the extent of improvement was significantly greater in the intervention group compared to the control group (P < 0.001), indicating the superior effectiveness of the intervention (Table 2).
Table 1.
Demographic Characteristics of Patients in the Intervention and Control Groups a
| Variables | Intervention Group | Control Group | P-Value |
|---|---|---|---|
| Age (y) | 69.92 ± 3.32 | 70.94 ± 4.09 | 0.153 |
| Time from cataract diagnosis to surgery (mo) | 6.45 ± 1.83 | 7.21 ± 1.41 | 0.005 |
| Gender | 0.641 | ||
| Female | 25 (45.5) | 23 (41.1) | |
| Male | 30 (54.5) | 33 (58.9) | |
| Marital status | 0.505 | ||
| Married | 46 (93.7) | 44 (89.2) | |
| Single | 9 (6.3) | 12 (10.8) | |
| Education | 0.303 | ||
| Under diploma | 41 (74.5) | 38 (67.9) | |
| Diploma | 28 (25.2) | 17 (30.4) | |
| University degree | 4 (3.6) | 1 (1.8) | |
| Occupation | 0.643 | ||
| Employed | 18 (32.7) | 19 (33.9) | |
| Retired | 16 (29.1) | 20 (35.7) | |
| Homemaker | 21 (38.2) | 17 (30.4) | |
| Financial status | 0.102 | ||
| Poor | 20 (36.4) | 29 (51.8) | |
| Average | 35 (63.6) | 27 (48.2) | |
| Good | - | - | |
| Living condition | 0.106 | ||
| With family | 53 (96.4) | 46 (82.1) | |
| Alone | 2 (3.6) | 10 (17.9) | |
| Underlying diseases | 0.426 | ||
| Yes | 49 (89.1) | 47 (83.9) | |
| No | 6 (10.9) | 9 (16.1) | |
| History of hospitalization for eye disease | 0.491 | ||
| Yes | 3 (5.5) | 2 (3.6) | |
| No | 52 (94.5) | 54 (96.4) | |
| Smoking | 0.897 | ||
| Yes | 19 (34.5) | 20 (35.7) | |
| No | 36 (65.5) | 36 (64.3) |
a Values are expressed as No. (%) or mean ± SD.
Table 2.
Between- and Within-group Comparisons of Mean Scores Across Different QOL Domains and Overall QOL
| Variables and Time | Min-Max | Intervention Group a | Control Group a | P-Value |
|---|---|---|---|---|
| General health and vision status | 4 - 36 | |||
| Before intervention | 30.16 ± 1.50 | 30.83 ± 1.96 | 0.044 | |
| After intervention | 32.85 ± 1.11 | 31.80 ± 2.25 | < 0.001 | |
| P-value | < 0.001 | 0.309 | ||
| Difficulty in performing activities of daily life | 25 - 120 | |||
| Before intervention | 86.50 ± 12.67 | 85.87 ± 16.55 | 0.787 | |
| After intervention | 95.38 ± 12.74 | 89.23 ± 15.95 | 0.027 | |
| P-value | < 0.001 | < 0.001 | ||
| Vision-related problems | 13 - 65 | |||
| Before intervention | 50.54 ± 4.52 | 48.66 ± 4.75 | 0.035 | |
| After intervention | 55.61 ± 4.12 | 50.35 ± 5.97 | < 0.001 | |
| P-value | < 0.001 | 0.002 | ||
| Overall QOL | 42 - 221 | |||
| Before intervention | 166.67 ± 16.43 | 165.25 ± 21.50 | 0.696 | |
| After intervention | 184.21 ± 15.94 | 170.67 ± 21.77 | < 0.001 | |
| P-value | < 0 .001 | < 0.001 |
Abbreviation: QOL, quality of life.
a Values are expressed as mean ± SD.
5. Discussion
Enhancing the QOL in older adults is particularly important. After cataract surgery, older adult patients have specific educational needs at the time of hospital discharge and require focused support from healthcare providers to ensure they receive adequate guidance (20). The present study demonstrated that a nurse-led educational program, combined with post-discharge telephone follow-up, can significantly improve QOL in this population. These results highlight the practicality and effectiveness of this approach in providing continued care and support for older adults at home.
Studies on older adult patients undergoing cataract surgery remain limited, and a review of the literature did not identify any studies specifically examining the effect of post-discharge follow-up on their QOL. Nonetheless, several related studies investigating similar interventions largely support and confirm the findings of the present study. For instance, in a study conducted in Brazil, Machado et al. (21) investigated the effect of post-discharge telephone follow-up on various health indicators in older adult patients after cataract surgery. In their study, participants were followed up by telephone on the 1st, 4th, 10th, and 20th days after hospital discharge. Machado et al. reported that post-discharge telephone follow-up increased adherence to treatment, promoted clinical improvement, enhanced patient independence and autonomy, and reduced reliance on others (21). Similarly, in Turkey, Gulsen and Akansel (17) examined the impact of post-discharge telephone follow-up on patients' adherence to recommended activities after cataract surgery. Their findings indicated that structured education combined with telephone follow-up significantly improved patients' compliance with eye care routines, including proper use of eye drops, protection of the operated eye, timely medical visits, and recognition of warning signs and symptoms (17). In another study, Digin et al. assessed the effect of sending post-discharge educational text messages on postoperative anxiety in patients undergoing cataract surgery. Their findings indicated that such messages effectively reduced patients' anxiety levels (22). Likewise, Ravari et al. investigated the impact of a nurse-led telephone follow-up on blood glucose control in older adults with diabetes. In their study, patients received telephone consultations from a diabetes specialist nurse over three months, resulting in significant improvements in blood glucose management (23).
Previous research has indicated that older adults have different preferences for receiving education and follow-up from nurses compared to younger adults, which may also apply to telephone-based interventions. However, the findings of the present study suggest that older patients perceive telephone follow-up as an appropriate and effective method. The advantages of this approach include low cost, broad accessibility, the ability to reach patients in remote areas, elimination of the need for hospital visits, and reduced financial burden for patients (24, 25).
5.1. Limitation
The short follow-up time is one of the limitations of this study.
5.2. Conclusions
Cataract surgery typically enhances the QOL in older adults. The findings of this study indicated that combining nurse-led education with post-discharge follow-up can provide additional benefits. Given the critical importance of ongoing monitoring in this population, telephone follow-up offers a simple, accessible, and cost-effective approach that can be readily implemented in clinical practice. Due to the limited research in this area, future studies are recommended to investigate other dimensions of older adult patients' lives following cataract surgery and to assess the broader effects of nurse-led telephone follow-up on these outcomes.