
1. Background
Breast cancer is one of the most common malignancies among women, with 2.3 million new cases and 670,000 deaths reported in 2022. It is predicted that by 2050, the number of diagnosed cases and mortalities will increase by 38% and 68%, respectively (1). The disease is heterogeneous, and both genetic and environmental factors are involved in the development of breast cancer (2). The pathophysiology of the disease involves the overexpression of signals that promote cell division and the suppression of tumor suppressor expression (3). Unfortunately, most patients are diagnosed at advanced stages, which is associated with reduced survival (4). Breast tumors with similar histopathological features can have different clinical manifestations, invasiveness, and treatment responses. Furthermore, breast cancer is a heterogeneous disease with diverse origins, biology, and clinical behavior. Molecular classification helps capture this diversity beyond traditional histology, enabling better prognostication, treatment selection, and understanding of disease biology (5). Therefore, immunohistochemical groupings for breast cancer are considered, which are divided into four categories. Categories A and B are luminal-like tumors, which are both positive for the ER biomarker, but the Her2/neu biomarker is negative in A and positive in B. The third category includes basal-like or triple-negative tumors, which are negative for all three markers: ER, PR, and Her2. The fourth category is the Her2/neu enriched group of tumors, in which only the Her2 marker is positive (6, 7). It is worth mentioning that HER2-positive tumors have an amplification/overexpression of the HER2 receptor, driving growth through heightened signaling in the EGFR/ERBB pathway. This makes tumors more proliferative and aggressive in some contexts (8). Furthermore, some patients with ductal carcinoma in situ (DCIS) present with invasive ductal carcinoma (IDC) (9), which is associated with a high mortality rate (10). However, some women with DCIS may not present with IDC (11). Therefore, finding novel biomarkers of progression from DCIS to IDC could be of great importance in the risk stratification and personalized treatment of patients, as they can help in prognostication and outcome prediction. Gene mutations, particularly in the BRCA 1 and 2 genes, are involved in approximately 10% of breast cancer cases, and most cases are sporadic (12), in which the interaction of genetic factors with environmental risk factors plays a central role in the development of malignancy (13). Breast cancer pathophysiology results from aberrations in multiple signaling networks that control cell proliferation, survival, differentiation, and metastasis, including estrogen receptor (ER), HER2 (ERBB2), PI3K/AKT/mTOR, MAPK/ERK, JAK/STAT, and Wnt/β-Catenin signaling pathways (14, 15). Moreover, in breast tumors, SOX-10 can mark cells with stem-like or basal-like characteristics, which are associated with higher plasticity and aggressive behavior. This transcription factor is involved in the differentiation and survival of glial cells and melanocytes (16). The SOX-10 antibody is used by immunohistochemistry to accurately diagnose melanomas and neural sheath tumors, both of which originate from the neural crest (16). Evidence of expression of this marker in myoepithelial cells, salivary glands, and bronchial glands has also been obtained (17). It has been found that this marker is also positive in myoepithelial and luminal cells of the breast (18). This has made SOX-10 a new marker in the diagnosis of primary breast cancers, especially the triple-negative type. Studies that have been conducted on this marker so far have only examined its expression in different types of breast cancers (19), especially the triple-negative type (20). There have been reports of the effect of various factors such as age, grade of malignancy, lymph node involvement, and tumor size on immunohistochemical staining (21), which can greatly alter the expression of a marker in different tumors. Ki-67 is also considered a biomarker for cellular proliferation, and its high level of expression is positively correlated with higher tumor grade and more aggressive behavior (22). The expression levels of this marker are measured in a wide range of malignancies, where it is used as an indicator of cellular proliferation (23). However, the relationship between SOX-10 and Ki-67 expression in breast cancer categories has not been investigated.
2. Objectives
Therefore, this study aimed to identify differences in SOX-10 and Ki-67 expression in molecular categories of breast cancer and its relationship with the clinicopathological variables of patients in a retrospective manner. The relationship between the expression of this new marker and clinicopathological factors such as age, grade of malignancy, tumor size, and lymph node involvement was also assessed using statistical methods based on the pathological profile of the available samples. The current research findings can be beneficial in proliferation-based risk stratification, chemotherapy decisions, and can improve the diagnostic accuracy of breast cancer patients.
3. Methods
3.1. Study Design and Patients
The present study was conducted as a retrospective observational design. For this, 42 patients who had been referred to Besat Hospital, Hamedan-Iran, between 2023 and 2024 and had a confirmed diagnosis of invasive ductal breast cancer were included in the study. Clinical and pathological data were collected from the hospital's HIS system, including age, tumor type, size, lymph node involvement, tumoral tissue necrosis, grade, and tumor mitotic activity. This study was approved by the Ethics Committee of Hamadan University of Medical Sciences (IR.UMSHA.REC.1402.142).
3.2. Exclusion Criteria
Exclusion criteria were as follows: (1) Breast needle biopsy specimens (avoiding sample bias); (2) samples taken after neoadjuvant therapy (avoiding therapeutic-induced changes and heterogeneity); (3) samples without concurrent lymph node resection; (4) samples with poor paraffin-embedded conditions; (5) samples with an inconclusive diagnosis of IDC.
3.3. Immunohistochemical Assay
Sections of 3 µm were made on a paraffin block using a microtome and mounted on TES immunohistochemical adhesive slides. Deparaffinization was performed by placing the slides at 60°C for 60 minutes. After that, rehydration was performed by placing the slides in xylene for 5 minutes and alcohol at decreasing concentrations (100%, 95%, and 70%) for 5 minutes each. In the next step, the slides were washed with distilled water and placed in 0.01 M citric acid (pH = 6). Subsequently, commercial primary antibodies were added as needed and incubated for 20 minutes at 37°C. Then, the slides were washed using PBS. Finally, secondary antibodies of SOX-10 (Abcam, UK) and Ki-67 (Abcam, UK) were added as serial dilutions (1:400) and incubated at room temperature for 30 minutes. The well without primary antibodies was considered a control. The slides were examined under a light microscope after adding hematoxylin. Tissue was considered negative (-) for SOX-10 if less than 1% of tumor cell nuclei were positive for the marker. Tissues with more than 1% SOX-10 expression were considered positive (+) (24). Tumors with Ki-67 expression less than 14% were considered negative (-). Those with expression between 15 - 30% and > 30% were considered + and ++, respectively (25). It is worth mentioning that scoring was performed by an experienced pathologist.
3.4. Statistical Analysis
Continuous data were reported as mean ± SD, and categorical data were reported as frequency and percentage. The relationship between the expressions of immunohistochemical markers and clinicopathological variables was measured using the chi-square test. Furthermore, the likelihood ratio (LR) and Pearson correlation coefficients were determined. All data were analyzed using SPSS V.26 software. A P-value of <0.05 was considered the level of significance.
4. Results
4.1. Clinicopathological Data
The clinicopathological data of breast cancer patients are shown in Table 1. The mean age of the patients was 49.59 ± 10.28 years, ranging from 29 to 75 years old. Their tumor size was mostly in the range of 2 - 5 cm, and 45.2% of patients had luminal A tumor type. However, most tumors were grades II (42.9%) and III (47.6%), and most patients had lymph node involvement (69%). Tumor tissue necrosis was observed in 16.7% of the samples. A high percentage of samples were Ki-67 + and ++, and SOX-10 expression was positive in 59.5% of the samples (Table 1).
Table 1.
The Clinicopathological Attributes of Breast Cancer Patients Used in the Current Study a
| Attributes | Values |
|---|---|
| Age (mean ± SD) | 49.59 ± 10.28 |
| Tumor size | |
| < 2 | 5 (11.9) |
| 2 - 5 | 33 (78.6) |
| > 5 | 4 (9.5) |
| Molecular type | |
| Luminal A | 19 (45.2) |
| Luminal B | 9 (21.4) |
| Her2 enrich | 7 (16.7) |
| TNBC | 7 (16.7) |
| Grade | |
| I | 4 (9.5) |
| II | 18 (42.9) |
| III | 20 (47.6) |
| Lymph node involvement | |
| No | 13 (31) |
| Yes | 29 (69) |
| Necrosis | |
| No | 35 (83.3) |
| Yes | 7 (16.7) |
a Values are expressed as No. (%) unless otherwise indicated.
4.2. SOX-10 and Ki-67
Of the 42 ductal invasive breast tumor samples, 38.1% and 35.7% were Ki-67 + and ++, respectively, while the rest were negative. Additionally, 59.5% of the samples showed SOX-10 expression (Figure 1).
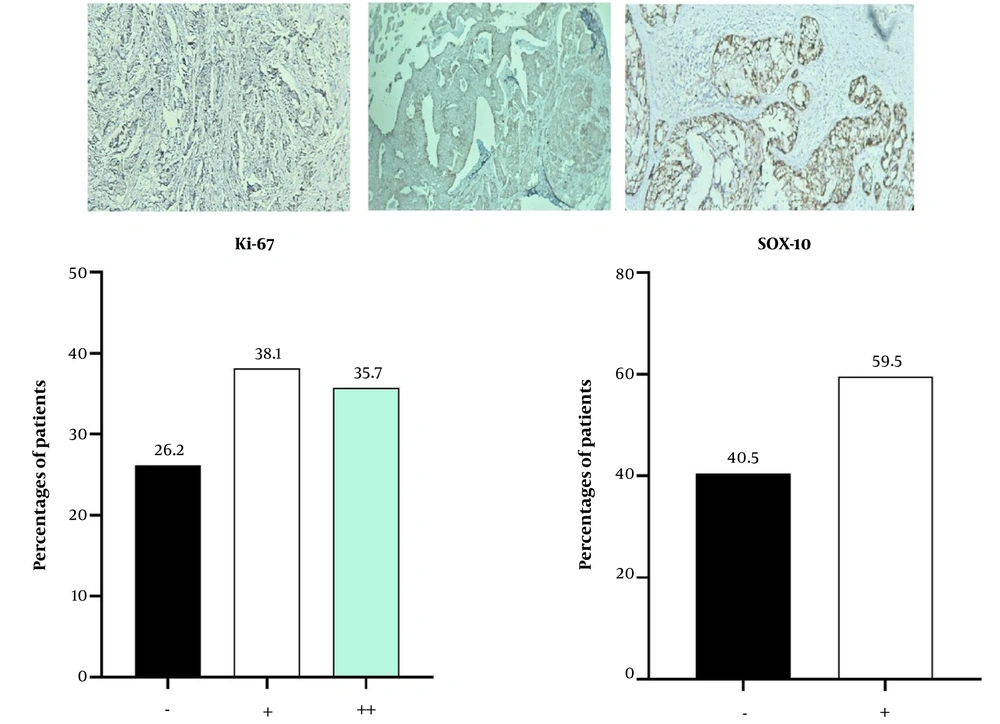
Figure 1.
The percentage of breast cancer tumors with Ki-67 and SOX-10 expressions (n = 42) and histological images of them (above): 38.1% and 35.7% of patients were Ki-67 + and ++ respectively, and 59.5% of patients were SOX-10 positive.
4.3. SOX-10 and Clinicopathological Attributes
There were no significant differences between SOX-10 expression (+/-) and clinicopathological traits, including tumor size (P = 0.129, LR = 4.13, R = 0.167), tumor molecular type (P = 0.173, LR = 5.25, R = 0.206), grade (P = 0.419, LR = 1.75, R = 0.184), lymph node involvement (P = 0.124, LR = 2.47, R = -0.237), tumor necrosis (P = 0.482, LR = 0.512, R = 0.108), and age (P = 0.821, LR = 0.392, R = 0.071; Table 2).
Table 2.
The Relationship Between SOX-10 Expression and Clinicopathological Attributes in Breast Cancer Patients a
| Attributes | SOX-10 (-) | SOX-10 (+) | P-Value | LR (P) | R (P) |
|---|---|---|---|---|---|
| Tumor size | 0.129 | 4.13 (0.129) | 0.167 (0.289) | ||
| < 2 | 4 (23.5) | 1 (4) | |||
| 2 - 5 | 11 (64.7) | 22 (88) | |||
| > 5 | 2 (11.8) | 2 (8) | |||
| Molecular type | 0.173 | 5.25 (0.154) | 0.206 (0.191) | ||
| Luminal A | 8 (47.1) | 11 (44.0) | |||
| Luminal B | 6 (35.3) | 3 (12.0) | |||
| Her2 enrich | 2 (11.8) | 5 (20.0) | |||
| TNBC | 1 (2.4) | 6 (24.0) | |||
| Grade | 0.419 | 1.75 (0.415) | 0.184 (0.244) | ||
| I | 2 (11.8) | 2 (8) | |||
| II | 9 (52.9) | 9 (36.0) | |||
| III | 6 (35.3) | 14 (56.0) | |||
| Lymph node involvement | 0.124 | 2.47 (0.115) | -0.237 (0.130) | ||
| No | 3 (17.6) | 10 (40.0) | |||
| Yes | 14 (82.4) | 15 (60.0) | |||
| Necrosis | 0.482 | 0.512 (0.474) | 0.108 (0.494) | ||
| No | 15 (88.2) | 20 (80) | |||
| Yes | 2 (11.8) | 5 (20.0) | |||
| Age (y) | 0.821 | 0.392 (0.822) | 0.071 (0.654) | ||
| 29 - 45 | 7 (41.1) | 8 (32.0) | |||
| 46 - 60 | 8 (47.1) | 14 (56.0) | |||
| > 60 | 2 (11.8) | 3 (12.0) |
Abbreviations: LR, likelihood ratio; R, correlation coefficient.
a Values are expressed as No. (%).
4.4. Ki-67 and Clinicopathological Attributes
There were no significant differences between Ki-67 expression (-/+/++) and clinicopathological traits, including tumor size (P = 0.349, LR = 5.02, R = 0.270), lymph node involvement (P = 0.771, LR = 0.514, R = 0.016), tumor necrosis (P = 0.420, LR = 1.69, R = 0.191), and age (P = 0.692, LR = 2.26, R = -0.143). Nevertheless, there were significant differences between Ki-67 expression and tumor molecular type (P < 0.0001, LR = 37.94, R = -0.032) and grade (P = 0.008, LR = 13.92, R = 0.498), with higher grades correlating with higher Ki-67 expression (Table 3). The higher LR for molecular type (LR = 37.94) and grade (LR = 13.92) indicate a strong association between Ki-67 level and molecular type and tumor grade in breast cancer patients. Additionally, the findings showed that Ki-67 expression increases in high tumor grades, and there is a significant positive correlation between tumor grade and increased expression of this cell proliferation indicator (R = 0.498). It is worth noting that there was a significant positive correlation between the expression of Ki-67 and tumor grade (R = 0.498, P = 0.001).
Table 3.
The Relationship Between Ki-67 Expression and Clinicopathological Attributes in Breast Cancer Patients a
| Attributes | Ki-67 (-) | Ki-67 (+) | Ki-67 (++) | P-value | LR (P) | R (P) |
|---|---|---|---|---|---|---|
| Tumor size | 0.349 | 5.026 (0.285) | 0.270 (0.084) | |||
| < 2 | 3 (27.3) | 1 (6.3) | 1 (6.7) | |||
| 2 - 5 | 8 (72.7) | 13 (81.3) | 12 (80.0) | |||
| > 5 | 0 (0) | 2 (12.5) | 2 (13.3) | |||
| Molecular type | 0.0001 | 37.94 (0.001) | -0.032 (0.840) | |||
| Luminal A | 0 (0) | 11 (68.8) | 8 (53.3) | |||
| Luminal B | 9 (81.8) | 0 (0) | 0 (0) | |||
| Her2 enrich | 1 (9.1) | 2 (12.5) | 4 (26.7) | |||
| TNBC | 1 (9.1) | 3 (18.8) | 3 (20.0) | |||
| Grade | 0.008 | 13.92 (0.008) | 0.489 (0.001) | |||
| I | 3 (27.3) | 1 (6.3) | 0 (0) | |||
| II | 5 (45.5) | 10 (62.5) | 3 (20.0) | |||
| III | 3 (27.3) | 5 (31.3) | 12 (28.6) | |||
| Lymph node involvement | 0.771 | 0.514 (0.773) | 0.016 (0.921) | |||
| No | 3 (27.3) | 6 (37.5) | 4 (26.7) | |||
| Yes | 8 (72.7) | 10 (62.5) | 11 (73.3) | |||
| Necrosis | 0.420 | 1.69 (0.429) | 0.191 (0.226) | |||
| No | 10 (90.9) | 14 (87.5) | 11 (73.3) | |||
| Yes | 1 (9.1) | 2 (12.5) | 4 (26.7) | |||
| Age (y) | 0.692 | 2.26 (0.688) | -0.143 (0.365) | |||
| 29 - 45 | 4 (36.3) | 4 (25.0) | 7 (46.6) | |||
| 46 - 60 | 5 (45.5) | 10 (62.5)) | 7 (46.6) | |||
| > 60 | 2 (18.2) | 2 (12.5) | 1 (6.8) |
Abbreviations: LR, likelihood ratio; R, correlation coefficient.
a Values are expressed as No. (%).
5. Discussion
The findings of the present study indicated that SOX-10 expression was not associated with clinicopathological variables such as tumor size, tumor molecular type, grade, lymph node involvement, and tumor necrosis. However, a greater number of grade III tumors were SOX-10 positive. It is worth noting that although no significant difference was observed between SOX-10 expression and tumor molecular type, six out of seven TNBC samples (85.7%) were diagnosed as SOX-10 positive. In addition, a significant association was observed between Ki-67 expression and tumor molecular type, with all luminal A tumors being Ki-67 + and ++. Also, most grade I tumors were negative for Ki-67 (3 out of 4), and most grade II tumors were Ki-67 + (13 out of 18). However, grade III tumors were more Ki-67 ++. These findings indicate that as the grade of breast tumor increases, Ki-67 overexpression in the tumor increases.
SOX-10 expression has been reported in TNBC tumors, and a recent study reported SOX-10 expression in 41% of patients (n = 113) and found that the expression of this marker was not associated with clinicopathological variables, including tumor grade, lymphangiosis, and lymphocytic stroma (21). In the present study, this marker was also detected in a high percentage of TNBC tumors, and the results indicated that SOX-10 expression was not associated with clinicopathological variables, which is similar to the findings of the aforementioned study. However, SOX-10 has a potential role in the diagnosis of TNBC breast cancer metastasis (26). It is worth noting that SOX-10 expression has been reported in other cancers, such as gastrointestinal malignancies, and has been shown to play a role in inhibiting the growth and metastasis of cancer cells (27). However, SOX-10 has been considered an oncogene in hepatocellular carcinoma and exerts its effects through the Wnt/β-catenin pathway (28). This role has also been reported in bladder cancer, where high levels of SOX-10 have been observed in this malignancy (29). These different roles of SOX-10 in various malignancies can be attributed to the different cell types and lineage origins, interactions with different signaling pathways, and the distinct tumor microenvironment. Therefore, SOX-10 seems to play a pivotal role in the growth and metastasis of cancers, and the present study also confirmed its expression in breast cancer tumors. Ki-67 has been shown to be important in the diagnosis of invasive breast cancer, especially in luminal A and luminal B subtypes (30), and its expression has been shown to be significantly positively correlated with tumor aggressiveness and cancer cell proliferation, indicating its potential as a biomarker for prognosis (31, 32). In the present study, a significant association was observed between Ki-67 expression and tumor molecular type, with Ki-67 being negative for all luminal B subtype tumors but detected as + and ++ for luminal A subtypes. However, Her2 enriched and TNBC subtypes were Ki-67 -, +, and ++. Also, Ki-67 expression was mostly negative in grade I tumor samples, with only 15 - 30% (+) expression detected in one sample.
However, a large number of grade III tumor samples were Ki-67++, indicating that Ki-67 expression increases in higher tumor grades. Ki-67 is active at all stages of mitotic division (33), making it a suitable biomarker for cell division and oncogenesis (33). Therefore, the overexpression of Ki-67 in grade III breast cancer tumors, as seen in the current study, can indicate a higher Proliferative Index in grade III compared to grades I and II. Interestingly, higher Ki-67 expression was reported in grades I and II of colorectal carcinoma compared to grade III (34), which is contrary to the findings of the present study. This difference could be attributed to the different type of cancer in the present study (invasive breast cancer). Interestingly, the lack of association between Ki-67 and lymph node involvement (P = 0.771) was observed in this study, meaning that within our sample, Ki-67 levels did not reliably distinguish patients with node-positive disease from those with node-negative disease. This finding is in contrast to other studies that have reported a direct association between Ki-67 expression levels and lymph node metastasis (35). This discrepancy may be attributed to breast tumor heterogeneity, the multifactorial nature of metastasis, and the small sample size in the present study.
One of the important limitations of this study was the relatively small sample size (n = 42). Therefore, it is recommended that future studies use larger sample sizes and multiple centers to investigate the association of SOX-10 with clinicopathological variables in breast cancer patients. It is also recommended to investigate the association between the expression of this biomarker and clinicopathological variables in other cancers.
5.1. Conclusions
Overall, it is concluded that there is no correlation between SOX-10 expression and clinicopathological variables such as tumor size, tumor molecular type, grade, lymph node involvement, and tumor necrosis, but the molecular subtype TNBC showed high expression of SOX-10. However, an association was observed between Ki-67 expression and tumor molecular type and grade, with luminal subtypes A and B, as well as grade III tumors, showing Ki-67 overexpression. It is worth mentioning that further studies are needed before the usage of Ki-67 as a diagnostic tool in clinical settings.