1. Background
The Bakhtiari Lori goat possesses a robust and resilient constitution and has gained attention for its reproductive capabilities. Studies indicate that this breed can reproduce efficiently under various conditions, a trait that can enhance its breeding productivity (1). The follicle-stimulating hormone beta subunit (FSHB) gene plays a vital role in regulating reproduction and fertility in goats. This gene contributes to the production of follicle-stimulating hormone (FSH), which is essential for the growth and maturation of ovarian follicles. One study investigating nucleotide sequences and expression levels of genes associated with ovulation rate in Yanling black goats revealed lower FSHB expression levels compared to other goats, potentially linked to their lower fertility (2). Furthermore, another study examining variations in the FSHB gene sequence and expression levels in different goats determined that these variations can influence follicle and oocyte count (3). Results also indicated a positive correlation between FSHB expression levels and litter size in goats, underscoring the importance of this gene in fertility and reproduction.
Research on the FSHB gene in cattle identified 15,353 single nucleotide polymorphisms (SNPs) out of over 500,000 sequences, 2,868 of which were non-synonymous. These SNPs can affect protein function and phenotypic traits (4). Investigation of non-synonymous SNPs in Holstein cattle and crossbred calves led to the identification of two non-synonymous SNPs in the FSHB sequence, and their impact on sperm quality and fertility in cattle was examined. These SNPs were associated with variations in sperm quality. A study on genetic diversity in goats also identified non-synonymous SNPs in casein genes, reporting that these SNPs can influence milk protein characteristics, although it did not specifically address the effects of non-synonymous SNPs in the FSHB gene (5).
While some research has investigated non-synonymous SNPs in the FSHB gene and their impact on fertility and sperm quality in cattle, specific information on goats and sheep in this context is lacking. Further research in this area is needed to elucidate the precise effects of these SNPs on the structure and function of the FSHB protein in these species (6).
2. Objectives
One study characterized the sequence and structure of the FSHB gene in the bovine pituitary gland, revealing that some cattle carry mutations associated with poor sperm quality and low fertility. This research contributes to a better understanding of the effects of mutations on fertility traits in cattle (7). Gene mapping of FSHB in one study determined its localization to bovine chromosome 15 and its homologous region in sheep. This research aided in understanding the chromosomal structure and its conservation in these two species (8). Another study explored the role of microRNA-488 (miR-488) in regulating FSH synthesis and secretion. It demonstrated that gonadotropin-releasing hormone (GNRH) can influence the FSHB gene via miR-488, thereby potentially enhancing reproductive processes in livestock (9).
In conclusion, the FSHB gene in goats is recognized as a key factor regulating reproductive processes and fertility, and further studies are essential for a deeper understanding of its function and its genetic associations with fertility.
3. Methods
In this study, thirty (30) native goats from Kohgiluyeh and Boyer-Ahmad province were selected, and blood sampling was performed from the jugular vein. The samples were labeled, transported on ice to the Central Laboratory of Yasuj University, and subsequently, following the relevant protocol, transferred to the University of Zabol. They were stored at -20°C until DNA extraction. DNA extraction was performed using the Denazist company protocol. The quality of the extracted DNA was assessed using agarose gel electrophoresis and a Nanodrop.
To amplify the target fragment, several primers were used, some of which did not show any mutation. Amplification of the target fragment was carried out using the polymerase chain reaction (PCR) technique. The PCR samples were sent to the Takapoozist Company for sequencing. Variations in amino acid sequences and mutations were identified.
To investigate the effect of mutations on protein stability and function, three online software tools, I-Mutant, PROVEAN, and SIFT, were utilized. Additionally, the online server Swiss-Model was used to examine the effect of mutations on the three-dimensional protein structure. Finally, the structural characteristics of the model were evaluated using Ramachandran plots. This method uses computer models of small polypeptides to systematically vary the phi (φ) and psi (ψ) angles to find stable conformations.
Plotting the gene network associated with the studied gene using the STRING software helped identify and analyze interactions between proteins and genes. Visualization of the three-dimensional structure was performed using PyMOL for protein and molecule analysis and visualization.
4. Results
Analysis of data from the Bakhtiari Lori goats identified two non-synonymous SNP mutations: A substitution [arginine (Arg) to lysine (Lys)] at position 9 and [glutamine (Gln) to aspartic (Asp)] at position 13. Given the alterations that deleterious SNPs can cause in the structure and biological function of proteins, and considering the critical role of the FSHB in the expression of estrogen-related genes, investigating mutations in this gene is of particular importance. Such mutations are recognized as one of the factors contributing to silent heat in buffaloes.
Determining the precise functional consequences of these amino acid changes within the genomic context requires more information about the specific protein sequence or structure, as well as the type and position of the variations. Generally, the effects of these amino acid substitutions can include changes in enzymatic activity, protein structure, or protein-protein interactions, which can impact the biological function of the cell.
In this study, analysis of non-synonymous SNPs in the Bakhtiari Lori goat was performed using the online servers SIFT, PROVEAN, and I-Mutant. These analyses helped predict the effects of the SNPs on the three-dimensional protein structure and its function. To determine the characteristics of the mutations in FSHB, the structural and functional consequences resulting from the amino acid substitutions were predicted using the sequences and structures obtained from the software. This article is based on the use of several methods, including predicting the effects of SNPs, analyzing the impact of mutations on protein structure, and investigating the effects of mutations on protein-ligand interactions. The results of the SNP analyses are presented in Tables 1 and 2.
Table 1.
Predicted Results for Non-synonymous Single Nucleotide Polymorphism and Amino Acid Change of Glutamine at Position 9 to Aspartic in the Follicle-Stimulating Hormone Beta Subunit Gene of Lori Bakhtiari Goat Using Three Software: SIFT, PROVEAN, and I-Mutant a
| Mutant Results | RI b | PROVEAN Results | SIFT Results | |||
|---|---|---|---|---|---|---|
| Predicted Effect | Score (ΔΔG) b | Predicted Effect | Parameter Value | Predicted Effect | Parameter Value | |
| Decreases | -0.51 | 6 | Deleterious | -3.345 | Deleterious | 0.00 |
a This score was obtained at a temperature of 25 and a pH of 7.
b Reliability Index for the prediction of the I-Mutant server. This score was obtained at a temperature of 25 and a pH of 7.
Table 2.
Predicted Results for Non-synonymous Single Nucleotide Polymorphism and Amino Acid Change of 13 Lysine to Arginine in the Follicle-Stimulating Hormone Beta Subunit Gene of Lori Bakhtiari Goat Using Three Software: SIFT, PROVEAN, and I-Mutant a
| Mutant Results | RI b | PROVEAN Results | SIFT Results | |||
|---|---|---|---|---|---|---|
| Predicted Effect | Score (ΔΔG) b | Predicted Effect | Parameter Value | Predicted Effect | Parameter Value | |
| Decreases | -0.43 | 6 | Deleterious | -3.478 | Deleterious | 0.00 |
a This score was obtained at a temperature of 25 and a pH of 7.
b Reliability Index for the prediction of the I-Mutant server. This score was obtained at a temperature of 25 and a pH of 7.
In SIFT software, scores less than or equal to 0.05 are classified as deleterious SNPs predicted to affect protein function. In other words, scores equal to or below 0.05 were considered deleterious, while scores above 0.05 were predicted as neutral or tolerated. In PROVEAN software, a threshold value is set for sequences. Sequences with a score less than -2.5 are classified as deleterious, whereas sequences with a score greater than -2.5 are predicted as neutral. The output of I-Mutant software includes the change in free energy value, denoted as ΔΔG. ΔΔCt means, it is the calculation of the change in the expression of the target gene in the treated sample compared to the control sample. ΔCt = Ct(Target Gene) - Ct(Reference Gene) ; ΔΔCt = ΔCt(Treatment) - ΔCt(Control) ; Relative Fold Change = 2^(-ΔΔCt). This categorization helps researchers better understand the effects of mutations on protein stability and function and assess the risks associated with the identified SNPs (2). The results from the I-Mutant, PROVEAN, and SIFT software indicated a deleterious and decreasing effect for both mutations.
Figure 1 depicts a protein structure comprising several chains, with different colors representing distinct structural elements, such as alpha-helices and beta-sheets. In this structure, the alpha-helix (α-helix) is a helical structure commonly found in many proteins.
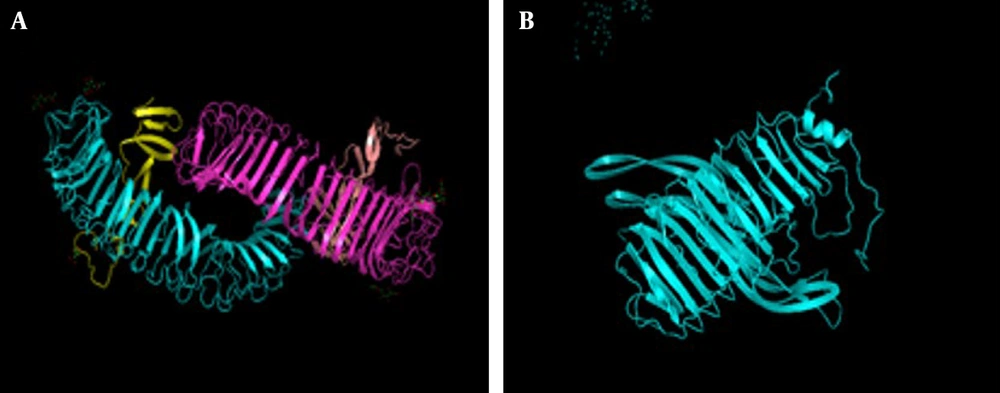
Figure 1.
A, Normal and B, mutant samples of the follicle-stimulating hormone beta subunit (FSHB) gene
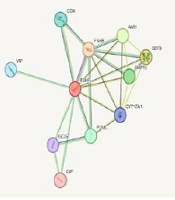
The depicted gene network illustrates the interactions and associations between the FSHB gene and other genes. In this network, each line represents an interaction, or in other words, a functional association between genes. Based on the image, the prominent interaction partners of the FSHB gene include direct connections with key genes such as gonadotropin-releasing hormone receptor (GNRHR), gonadotropin-releasing hormone 1 (GNRH1), growth hormone-releasing hormone receptor (GHRHR), and luteinizing hormone/choriogonadotropin receptor (LHCGR). These genes play a primary role in hormonal regulation and neuroendocrine control mechanisms, particularly within the hormonal system governing reproduction and physiological regulation (Figure 2).
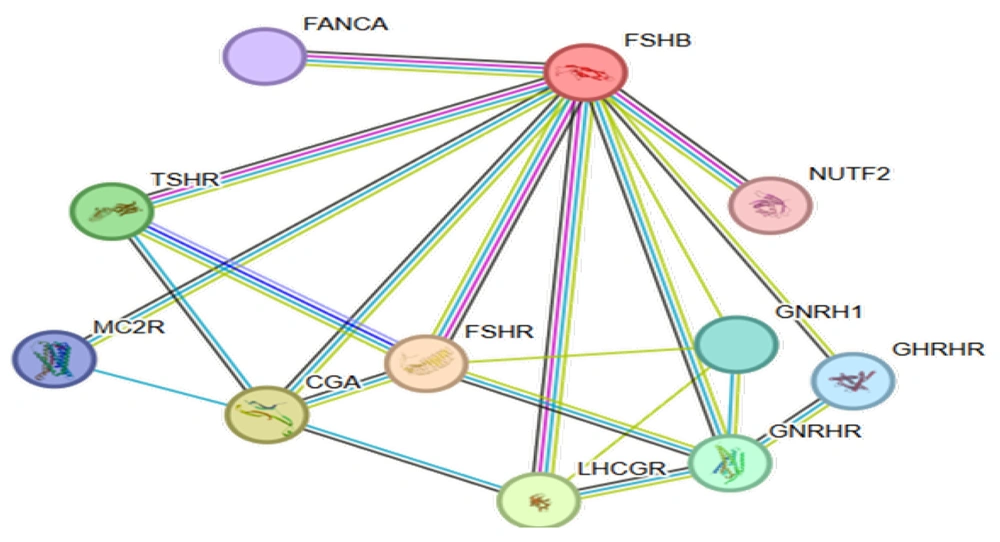
Figure 2.
Protein-protein interaction network analysis by STRING database
The FSHB interacts with genes including GNRH1 and GNRHR, GHRHR and the LHCGR. These interactions play a key role in regulating hormones associated with the reproductive system. Collectively, these interactions indicate that FSHB is involved, alongside other genes and receptors, in critical hormonal regulatory pathways and the control of physiological processes, including the reproductive cycle, growth, and development.
This network of interactions demonstrates that FSHB holds a significant role in hormonal pathways, and its interactions with other genes directly impact the function of the reproductive system and hormonal balance. Any alteration or disruption in this gene and its interactions can have adverse effects on sexual health and fertility.
Figure 3A displays the Ramachandran plot, which illustrates the distribution of phi (φ) and psi (ψ) angles within the peptide chains. This plot serves as a key tool for assessing the stereochemical quality of three-dimensional protein structures and analyzing the permissible angles in polypeptide conformations. The brown and green regions on the plot typically represent the favored angles for stable structures such as alpha-helices and beta-sheets, while red points indicate unfavorable and disallowed conformations that may suggest structural errors or anomalous angles. Structural analysis of the FSHB gene indicates that a high concentration of data points within the favored regions signifies a correct and well-determined structure. Conversely, if a significant number of points fall within disallowed regions, this could indicate potential structural issues. Overall, the plot demonstrates that the protein structure corresponding to the FSHB gene possesses natural and reliable backbone conformations. A comparison of the two plots reveals that both datasets contain largely permissible angles. However, plot A, with a denser clustering of points in the favored regions, suggests a healthier and more reliable structure. In contrast, plot B features more outliers in the disallowed regions, indicating a higher degree of conformational strain in its structure. Consequently, the first structure is likely to play a more active role in biological function.
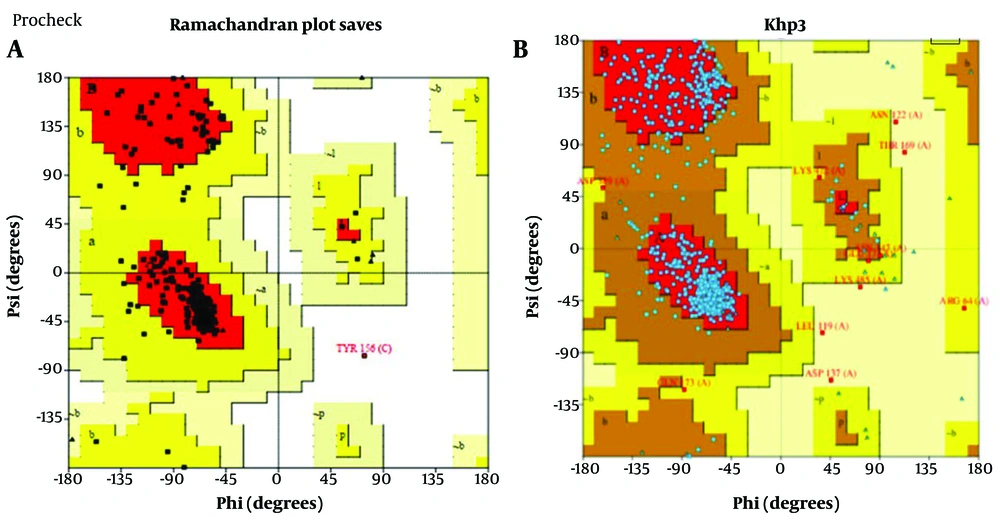
Figure 3.
A, ramachandran plot in two natural models; and B, mutated model
Figure 3B illustrates genetic diversity within the FSHB gene, with different colored regions (yellow, brown, red, and blue) representing the frequency of various alleles. Gene labels such as ASR, Lys, Arg, and Asp likely denote key mutation or polymorphism sites. The analysis emphasizes the importance of conserving genetic diversity in low-frequency regions to prevent the loss of variation and promote sustainable breeding improvement. In general, the results obtained from these analyses can contribute to enhancing breed quality and preserving genetic diversity across different populations.
5. Discussion
The identification of two non-synonymous SNPs in the FSHB gene of Bakhtiari Lori goats, resulting in Arg9Lys and Gln13Asp substitutions, is of significant physiological concern due to the concerted prediction of their deleterious impact by multiple computational tools. The SIFT algorithm classified both mutations as deleterious with scores of 0.00, strongly suggesting a detrimental effect on protein function (10). This was corroborated by PROVEAN, which yielded scores of -3.345 and -3.478 for the Arg9Lys and Gln13Asp mutations, respectively, firmly placing them below the -2.5 threshold for deleterious classification (11). Furthermore, the I-Mutant software predicted that both substitutions decrease protein stability, as indicated by negative ΔΔG values of -0.51 and -0.43 (12). This collective evidence implies that these mutations likely compromise the structural integrity and biological activity of the FSHB subunit. Given FSH’s critical role in folliculogenesis and estrogen synthesis, such impairments could disrupt the estrous cycle, providing a plausible molecular explanation for fertility issues such as silent heat, a phenomenon previously associated with FSHB mutations in other ruminants (13). Consequently, these specific SNPs represent potential genetic markers for reduced reproductive efficiency in this goat breed.
The gene network analysis demonstrates that FSHB is functionally interconnected with key neuroendocrine regulators, including GNRH1, GNRHR, GHRHR, and LHCGR, which collectively orchestrate the hypothalamic-pituitary-gonadal axis and are critical for reproductive hormonal control (14). The structural integrity of the FSHB protein product is corroborated by Ramachandran plot analysis, which reveals a high density of phi (φ) and psi (ψ) angles within the favored regions, indicating a stable and reliable backbone conformation essential for effective biological activity and receptor interaction (15). Furthermore, an assessment of genetic diversity at specific residues (e.g., ASR, Lys, Arg, and Asp) highlights polymorphic sites within the FSHB gene; conserving this variation, particularly in low-frequency alleles, is crucial for maintaining genetic resource potential and informing sustainable breeding strategies aimed at improving reproductive traits (16).
5.1. Conclusions
Alterations or impairments in the function of the FSHB gene and its interactions with related genes can lead to reproductive failures, hormonal deficiencies, and infertility. The FSHB gene plays a vital role as a key component of the reproductive hormonal system, and its disruption can negatively impact FSH levels and fertility processes. To enhance fertility in goats, focusing on the FSHB gene and its interaction partners, and utilizing genetic technologies such as marker-assisted selection and gene editing (e.g., CRISPR), is essential. These approaches can contribute to developing resilient and highly fertile breeds, thereby increasing productivity in the livestock industry. Genetic variations in the FSHB gene and its interactions can adversely affect reproductive performance and hormonal health in goats. Given the pivotal role of FSHB in hormonal regulation, genetic improvement and the selection of suitable genotypes using technologies like marker-assisted selection and gene editing can enhance fertility and breed robustness.