1. Background
Multiple sclerosis (MS) is one of the most common causes of neurological disability beginning in early to middle adult life, affecting about 3 million people worldwide (1). The MS is a chronic inflammatory disease of the central nervous system (CNS), which in recent years has been considered an interesting subject to the neuroscience community (2). Interferon beta (IFN-β) is a member of the type I interferon family and is involved in different features of immune responses. The IFN-β has been considered for more than 15 years as a first-line treatment for MS (3). The IFN-β is a pleiotropic cytokine, secreted by nucleated cells binding to a heterodimeric receptor (IFNAR1/IFNAR2) (4).
Some of this cytokine's biological effects were identified, for example, as an antagonist of IFN-γ-mediated MHC upregulation on antigen-presenting cells, modulation of apoptotic pathways, and alteration of the profile of cytokine expression. Based on investigations, more than 100 genes are involved in the IFN-β pathway and all of these can be considered attractive candidate genes as pharmacogenetic response markers (3, 4).
Glutamate is a vital factor in the CNS (5). Glutamate receptors are synaptic receptors mainly located on neuronal cell membranes; they are vital for neural communication, memory formation, learning, and regulation. Glutamate is the main excitatory neurotransmitter throughout the CNS, affecting both ligand-gated ion channels and G-protein-coupled receptors and is mediated by AMPA-type glutamate receptors expressed in oligodendrocytes. Glutamate toxicity also occurs in MS and its concentration is elevated both in acute lesions and in normal matter of patients with MS (6). The subunit encoded by the glutamate receptor gene belongs to a family of AMPA (α-amino-3-hydroxy-5-methyl-4-isoxazolepropionic acid) sensitive glutamate receptors, which is subject to RNA editing (AGA->GGA; R->G) (5).
Based on investigations by Comabella et al., a significant association in clinical IFN-β responses was demonstrated for genes including ZFHX4, ZFAT, glutamate ionotropic receptor AMPA type subunit 3 (GRIA3), and STARD13. Despite this result, no association was detected in genetic variants of IL-10, such as rs1800872 and rs1800896, with type I IFN response in MS (7). However, GRIA3 rs12557782 polymorphism had previously been investigated in the general Iranian population in relation to IFN-β response (8).
2. Objectives
The present study focused on patients from Qazvin province, a region with distinct genetic and environmental characteristics, aiming to explore possible gene–environment interactions that may influence treatment response.
3. Methods
3.1. Study Design and Clinical Assessment
The study was approved by the Local Ethics Committee (IR.NIGEB.EC.1395.11.10.C) and informed consent was obtained from all patients. A total of 155 patients with relapsing-remitting multiple sclerosis (RRMS) treated with IFN-β were collected from the clinics of Qazvin. All patients were included in a follow-up protocol that collected demographic, basal, and longitudinal clinical data, including number of relapses and Expanded Disability Status Scale (EDSS) scores, as previously described. A total of 79 control individuals were recruited from healthy respondents who did not have MS at the time of sample collection. Healthy controls in this study were recruited solely to provide reference allele frequencies and to validate the PCR-RFLP and sequencing workflow, and were not intended for comparative responder/non-responder analyses. All participants, including healthy controls, provided written informed consent in accordance with the approved ethics protocol.
3.2. Definition of Response to Interferon Beta Therapy
Clinical criteria of response to IFN-β therapy were applied after 6 months of treatment. A total of 79 controls were considered responders if there was no increase in the EDSS score and no relapses during the follow-up period. A total of 76 patients were considered non-responders as case subjects if, during the follow-up period, there was 1 or more relapses and an increase of at least 1 point in the EDSS score that persisted for at least 2 consecutive scheduled visits separated by a 6-month interval. The control group was not included in treatment-response comparison and their data were only used for genotyping validation.
3.3. Genomic DNA Extraction
Five (5) mL peripheral blood samples were collected from respective subjects. The genomic DNA was extracted from leukocytes according to a standard protocol of Investigating group Molecular Biological System Transfer (MBST) kit research group based in Iran/Germany. The quality of extracted DNA was checked by 0.8% agarose gel electrophoresis, and degraded samples were excluded from the analysis.
3.4. The Genotyping of Glutamate Ionotropic Receptor AMPA Type Subunit 3 Gene Polymorphism
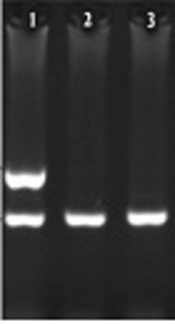
The GRIA3 (GenBank accession number U10301) single nucleotide polymorphism A/G at position rs12557782 was screened by PCR-RFLP followed by digestion with restriction endonuclease EcoO1091 (DraII). The primers used for the PCR were forward primer 5'-TCCTACACATTCTCCTCTTC-3' and reverse primer 5'-CTGCCTTCTGAAAGTCTAAC-3'. PCR conditions were denaturation at 95°C for 5 min followed by 25 cycles at 95°C for 20 s, 55°C for 20 s, 72°C for 30 s with a final elongation step at 72°C for 5 min. At first, PCR was performed at the specific region of the GRIA3 gene and its products were detected on agarose gel (Figure 1A). The presence of a 454 bp band demonstrated copies of the gene through the PCR reaction. The PCR products were digested overnight at 37°C with 1 unit of the restriction endonuclease EcoO1091 (DraII, Fermentase) and electrophoresed on a 3% agarose gel (Figure 1B). In order to ensure the specificity of PCR, products were sequenced (Figure 2). The desired sequence was determined by NCBI blast. It was observed that both sequencing products are similar to their own part of the reference sequence.
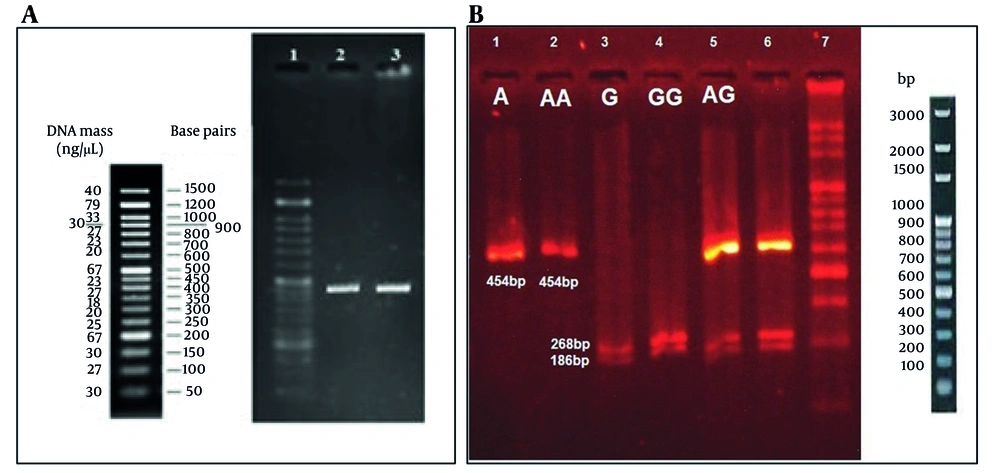
Figure 1.
A, result of PCR product on agarose gel; B, result of restriction enzyme DraII products on 3% agarose gel: Findings based on DraII restricted enzyme on 3% agarose gel electrophoresis. The first line shows a 45 bp band, so it is expected for a man with the A genotype. Based on the second line that demonstrates a 454 bp band, it can be concluded as AA genotype for that female. The third line shows 268 and 186 bp bands, which is expected for a male patient with the G genotype, and regarding the fourth line that shows 268 and 186 bp bands, it can be concluded as GG genotype for a female patient. The fifth and sixth lines have 454, 268, and 186 bp bands, which show GA genotype for a female patient. The last line belongs to the 100 bp ladder. Because glutamate ionotropic receptor AMPA type subunit 3 (GRIA3) is located on the X chromosome, a sex-stratified descriptive analysis was performed; however, due to the small number of male participants (n = 22), statistical power was insufficient for meaningful subgroup comparison.
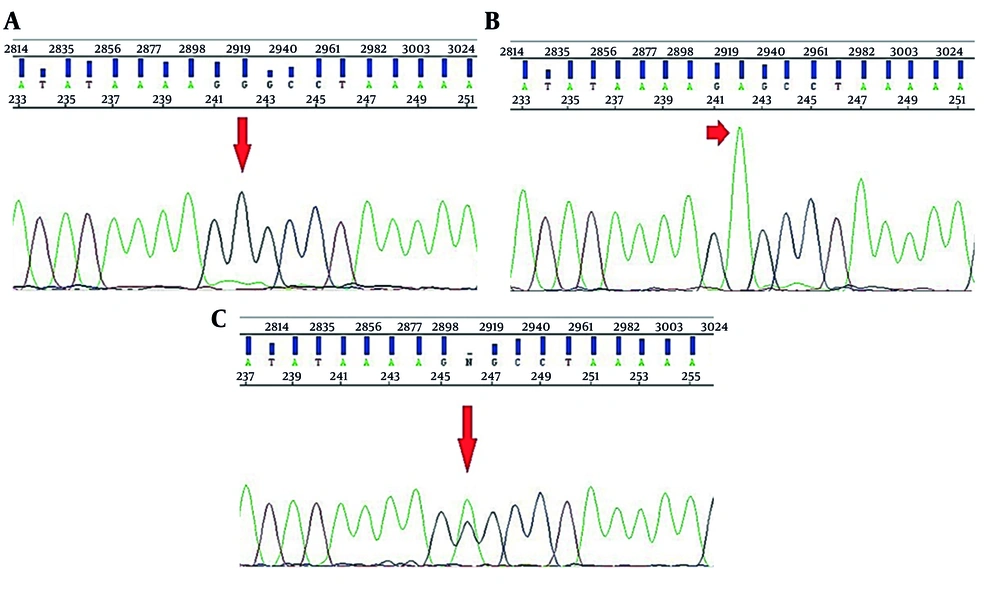
Figure 2.
Sequencing results for RFLP analysis: A, sequence result for the patient with allele G; B, sequence result for the patient with heterozygous allele A/G; C, sequence result for the patient with allele A.
3.5. Statistical Analysis
The Statistical Package for Social Science (SPSS, Version 16) was used to analyze the data in this study. Descriptive statistics were utilized to analyze all variable information such as demographics, anthropometric factors, and the genotypes of all the study subjects; moreover, all of these factors were compared by using Student’s t-test, and a level of P < 0.05 was considered as statistically significant. Allelic frequencies were calculated by the gene counting method and the genotype distribution was calculated with Hardy-Weinberg expectations by a chi-Squared test. A post-hoc power analysis indicated that the sample size provided approximately 60% power to detect an odds ratio ≥ 2.0 for this SNP, suggesting that modest genetic effects may not have been identifiable in the present cohort.
4. Results
One hundred and fifty-five patients with MS (133 females and 22 males) were investigated in this study. The mean age of patients was 31.76 ± 7.59 in responders and 32.43 ± 7.00 in non-responders (range of 15 - 50 years), mean disease duration was 4.04 ± 3.12 in responders and 6.2 ± 4.56 in non-responders (range of 1 - 25 years), and mean EDSS was 0 (0) in responders and 1 (0.5) in non-responders (range of 0 - 5). The clinical features of the MS patients are summarized in Table 1. Our results revealed that among responders, 43.0% carried the A and A+G allele, compared to 55.3%; 28.9% of non-responders had A and A+G allele, respectively. The frequency of the G allele was 13.9% in responders and 15.8% in non-responders (Table 2). Genotype analysis in the population of patients demonstrated that the A/G genotype had the highest frequency in the responders’ group (43.0%) compared to non-responders (28.9%, P = 0.07). On the other hand, the G genotype showed the lowest frequency in both groups, with 3.8% in responders and 5.3% in non-responders, with no significant correlation observed (P = 0.71, Table 3).
Table 1.
Demographic and Clinical Characteristics of Responders and Non-responders to Interferon Beta Therapy a
| Variables | Responders (N = 79) | Non-responders (N = 76) |
|---|---|---|
| Age (y) | 31.76 ± 7.59 | 32.43 ± 7.00 |
| Sex | ||
| Female | 68 (86.1) | 65 (85.5) |
| Male | 11 (13.9) | 11 (14.5) |
| Disease duration (y) | 4.04 ± 3.12 | 6.2 ± 4.56 |
| EDSS score | 0 (0) | 1 (0.5) |
| No. of relapses | ||
| 0 | 70 (88.6) | 1 (1.3) |
| 1 | 5 (6.3) | 43 (56.6) |
| 2 | 4 (5.1) | 23 (30.3) |
| ≥ 3 | 0 | 9 (11.8) |
| Consumption b | 2.93 ± 2.13 | 4.21 ± 2.99 |
Abbreviation: EDSS, Expanded Disability Status Scale.
a Values are expressed as mean ± SD or No. (%).
b The variable ‘Consumption’ refers to the total duration of interferon-β therapy prior to enrollment in the study.
Table 2.
Distribution of Glutamate Ionotropic Receptor AMPA Type Subunit 3 (rs12557782) Polymorphism Alleles in Multiple Sclerosis Patients and Controls a
| Alleles | Responders (N = 79) | Non-responders (N = 76) | OR (CI 95%) | P-Value |
|---|---|---|---|---|
| A | 34 (43.0) | 42 (55.3) | 1.64 (0.87 - 3.08) | 0.13 |
| A+G | 34 (43.0) | 22 (28.9) | 0.54 (0.28 - 1.05) | 0.07 |
| G | 11 (13.9) | 12 (15.8) | 1.16 (0.48 - 2.81) | 0.74 |
a Values are expressed as No. (%).
Table 3.
Statistical Data About the Frequency of Genotypes in the Population of Patients a
| Genotypes | Responders (N = 79) | Non-responders (N = 76) | OR (CI 95%) | P-Value |
|---|---|---|---|---|
| A | 8 (10.1) | 7 (9.2) | 0.90 (0.31 - 2.62) | 0.85 |
| A/G | 34 (43.0) | 22 (28.9) | 0.54 (0.28 - 1.05) | 0.07 |
| AA | 26 (32.9) | 35 (46.0) | 1.74 (0.91 - 3.34) | 0.09 |
| G | 3 (3.8) | 4 (5.3) | 1.41 (0.30 - 6.51) | 0.66 |
| GG | 8 (10.1) | 8 (10.5) | 1.04 (0.37 - 2.94) | 0.94 |
a Values are expressed as No. (%).
5. Discussion
The MS is one of the most observed demyelinating diseases, with different prevalence rates ranging from high levels in North America, Western Europe, and parts of Oceania, to low rates in Eastern Asia and sub-Saharan Africa. Recent research has reported a global increase in MS prevalence, signifying both improvements in diagnostic techniques and the possible influence of environmental and genetic factors on disease risk (9). Drug treatments for MS are generally classified into two categories: Immunomodulatory or immunosuppressive agents, based on their mechanisms in disease pathogenesis. Immunomodulatory agents act by modifying the immune system’s response to promote anti-inflammatory pathways, helping to reduce inflammation and neurodegeneration. In contrast, immunosuppressive drugs function by broadly suppressing immune activity. Advances in drug therapy have improved outcomes, with a growing focus on personalized medicine where genetic predispositions and environmental factors are considered when determining the most appropriate treatment for each patient (10).
The role of glutamate excitotoxicity in the pathogenesis of MS has also been increasingly recognized, as excessive glutamate release can lead to neuronal damage and contribute to neurodegeneration (11). According to the Comabella research group, significant associations with the clinical response to IFN-β were identified for several genes, including ZFAT, ZFHX4, STARD13, and GRIA3 (12). However, other investigations found no association between certain genetic variants of IL-10, such as rs1800872 and rs1800896, and the response to type I IFN therapy in MS, while such associations were observed in Hepatitis C patients (13). Moreover, Weinstock-Guttman et al. reported that a favorable response was associated with lower expression of IFNAR1, IL-8, and CASP10 genes and higher expression of MxA, STAT1, IFNAR2, IRF1, B2M, IFITM1, IL-6, and TGFB2 genes (14). Their findings also indicated a genetic association with gender among MS patients, and the rs733254 SNP may predict MS onset in Persian Gulf females. That study also highlighted potential roles for polymorphisms in genes encoding ZFAT, GRIA3, STARD13, ADAR, ZFHX4, IFNAR2, and CIT in MS susceptibility (5).
In contrast to these studies, our investigation into the rs12557782 polymorphism in GRIA3 did not show any significant correlation with treatment response (measured by EDSS, disease duration, relapse frequency, or sex) in Iranian MS patients (P = 0.167). Sequencing products matched the reference sequence, and enzyme digestion along with statistical analysis of allelic and genotypic frequencies confirmed no significant correlation between rs12557782 and IFN-β treatment response. These findings are consistent with recent research suggesting that genetic markers may have varying levels of significance depending on population-specific factors such as ethnic background and environmental exposures (8, 15).
It should be noted that the GRIA3 rs12557782 polymorphism had previously been investigated in the general Iranian population for its relationship to IFN-β response (8). Our investigation, on the other hand, was restricted to a unique province in a unique geographical space called Qazvin province, which parallels the unique genetic features in that province, particularly with regard to distinct mtDNA haplogroup structures (16). The present study adds value by focusing on a genetically distinctive population from Qazvin province, where unique mitochondrial DNA haplogroups have been documented (16). These haplogroups influence mitochondrial efficiency, oxidative stress regulation, and neuroinflammatory tone, which may indirectly modulate immunometabolic pathways relevant to IFN-β responsiveness. Therefore, although the GRIA3 polymorphism itself is nuclear, the regional mitochondrial background may create a distinct biological context in which treatment-response markers behave differently. This population-specific approach represents a meaningful extension of prior nationwide Iranian studies and emphasizes the importance of genetic substructure in pharmacogenomic association research.
Ultimately, while we attempted to consider these aspects, our findings suggest that GRIA3 rs12557782 was not a significant contributor to IFN-β drug responses and will necessitate further research to determine the impact of other genetic, epigenetic, and environmental determinants contributing to drug responses in MS. The 6-month follow-up period used to define treatment response is acknowledged as a limitation, as longer-term observation (12 - 24 months) may more accurately capture late treatment failures.
5.1. Conclusions
We found no significant link between IFN-β response and the rs12557782 polymorphism in GRIA3. These results suggest that rs12557782 does not significantly influence treatment outcome among MS patients from Qazvin province, despite the specific genetic composition and environmental exposures associated with the province’s unique context. It is important to stress that in this study both genetic and environmental exposure factors were considered, involving the unique regional context of Qazvin province. Using larger sample sizes and additional integrated genomic and environmental analyses will not only help prove these research observations but can also offer prescriptive clarity in determining the complex interplay of genetic, epigenetic, and environmental factors in treatment response among MS patients.