
1. Background
Type 2 diabetes mellitus (T2DM) is a leading cause of morbidity worldwide, and its pathogenesis is largely attributed to impaired insulin sensitivity and dysregulated glucose homeostasis. In T2DM, peripheral tissues and the liver become less responsive to insulin, resulting in chronic hyperglycemia and an increased risk of complications, including cardiovascular disease, nephropathy, and neuropathy (1-3). The maintenance of normal blood glucose levels depends heavily on proper liver function, and hepatic insulin resistance substantially accelerates T2DM progression. Emerging evidence implicates hepatokines, liver-derived signaling proteins, in the development of metabolic dysfunction. Among these, fetuin-A, also known as alpha-2-HS-glycoprotein, has received considerable attention as a mediator of insulin resistance. Fetuin-A acts as a natural agonist of Toll-like receptor 4 (TLR4), thereby activating inflammatory cascades that are particularly detrimental to insulin signaling under conditions of high lipid availability (4, 5). In addition, it directly interferes with insulin receptor autophosphorylation, thereby blunting intracellular insulin action (5-7). Circulating fetuin-A levels are consistently elevated in individuals with metabolic syndrome, T2DM, and related comorbidities (8). Notably, this relationship appears to be bidirectional: insulin resistance and obesity stimulate hepatic fetuin-A production, which in turn exacerbates metabolic dysfunction and creates a self-reinforcing pathological loop. Consequently, identifying modifiable factors that regulate fetuin-A expression may open new avenues for therapeutic intervention in T2DM.
Magnesium is a critical cofactor in more than 300 biochemical reactions and is indispensable for normal glucose utilization and insulin-mediated signal transduction. Hypomagnesemia is prevalent among individuals with T2DM and is associated with increased inflammation and impaired metabolic control (9-11). Population-based studies, including the Framingham Offspring Study, have reported that low serum magnesium often coexists with other metabolic risk factors, such as hypertension, dyslipidemia, and insulin resistance (12).
Despite this strong epidemiological association, clinical trials of oral magnesium supplementation have yielded inconsistent results. Although some studies have reported improved glycemic control and insulin sensitivity, others have observed no effect or even worsening insulin resistance despite favorable changes in lipid profiles (13). These discrepancies likely reflect variations in study design, including dosage, intervention duration, baseline magnesium status, and participant characteristics (13).
To overcome the limitations of conventional supplementation, researchers have turned to nanotechnology. MgO NPS offer enhanced bioavailability, greater cellular uptake, and improved pharmacokinetics because of their high surface-area-to-volume ratio (14, 15). Preclinical studies support their therapeutic potential: in diabetic rat models, MgO NPS, alone or conjugated with curcumin, significantly reduced blood glucose, improved lipid metabolism, and exerted anti-inflammatory and antioxidant effects (16-18). These properties suggest a multifaceted mechanism that may extend beyond simple magnesium repletion.
Nevertheless, the molecular pathways through which MgO NPS exert their antidiabetic effects remain poorly understood. Although animal studies suggest improved insulin sensitivity with magnesium supplementation, human trials have reported conflicting outcomes, with some demonstrating metabolic benefits (19, 20) and others reporting no change or paradoxical worsening of insulin resistance despite improved lipid parameters (13).
This uncertainty raises a compelling and underexplored question: can magnesium, particularly in nanoparticle form, modulate fetuin-A expression? Given the role of fetuin-A in promoting insulin resistance and the established link between magnesium deficiency and metabolic dysregulation, it is biologically plausible that magnesium status influences fetuin-A levels. Supporting this possibility, pharmacological interventions such as ellagic acid have been shown to lower fetuin-A and improve insulin sensitivity through Sirtuin1-mediated pathways (21). To date, however, no study has investigated whether MgO NPS can regulate fetuin-A gene expression as a mechanism for ameliorating insulin resistance in T2DM.
Animal models remain indispensable for elucidating the pathophysiology of diabetes and evaluating novel therapeutics. The streptozotocin-nicotinamide (STZ-NA) rat model is widely used because it recapitulates key features of human T2DM, including moderate hyperglycemia, preserved pancreatic β-cell mass, and insulin resistance (22). This model has recently been used to assess the efficacy of natural compounds and nanotherapeutics (23), making it well suited for the current investigation.
2. Objectives
Given the central role of fetuin-A in metabolic dysfunction, the therapeutic potential of magnesium, and the advantages of nanoparticle delivery, this study aimed to determine whether MgO NPS modulate hepatic fetuin-A gene expression and improve insulin resistance in a rat model of T2DM. These findings may provide a mechanistic basis for novel magnesium-based strategies to combat insulin resistance in individuals with T2DM.
3. Methods
3.1. Experimental Design and Animals
This study was an experimental research project. The statistical population consisted of male Wistar rats obtained from the Pasteur Institute of Iran. The study included 24 male Wistar rats aged 10 weeks with body weights of 220 ± 20 g, selected through a simple random selection process. The animals were transferred to the Razi Laboratory animal house at Islamic Azad University, Science and Research Branch.
Animals were housed under controlled conditions at an ambient temperature of 22 ± 3°C, a humidity of 30% - 60%, and a 12-hour light/dark cycle. Rats were kept in transparent polycarbonate cages (30 × 15 × 15 cm), with four rats per cage, and had ad libitum access to standard chow and water. To minimize stress, the animals were handled daily by the same researcher. Adequate ventilation was maintained to prevent ammonia buildup.
Rats first underwent a two-week adaptation period. After this period, the mean weight was 212 g. After adaptation, all rats (n = 24) were randomly assigned to experimental groups using a computer-generated random number sequence (www.randomizer.org). For allocation concealment, the sequence was kept in sealed opaque envelopes by a researcher not involved in animal handling or data collection. After diabetes induction, as described below, diabetic rats were re-randomized to either the Diabetic Control (DC) or Diabetic + MgO NPS (DS) group using the same concealed allocation method. To minimize performance bias, the investigator administering MgO NPS or vehicle (distilled water) by oral gavage differed from the investigator responsible for outcome assessment. To control detection bias, all laboratory analyses, including glucose measurement, insulin ELISA, RNA extraction, and real-time PCR, were performed by technicians blinded to group allocation. Data analysis was also conducted in a blinded manner, with group codes revealed only after the final statistical calculations. The groups were as follows:
- Healthy Control (HC)
- Diabetic Control (DC)
- Diabetic + MgO NPS (DS)
All procedures involving animal care, treatment, and euthanasia were approved by the National Committee for Ethics in Biomedical Research (Ethics ID: IR.IAU.SRB.REC.1404.012).
3.2. Induction of Type 2 Diabetes
To induce T2DM, rats received an intraperitoneal injection of nicotinamide (110 mg/kg) after a 12-hour overnight fast. After a 15-minute interval, a freshly prepared solution of streptozotocin (60 mg/kg dissolved in 0.1 M citrate buffer, pH 4.5) was administered intraperitoneally. The HC group received an equivalent volume of citrate buffer only. One week later, fasting blood glucose (FBG) was measured by tail-vein sampling. Rats with FBG levels exceeding 150 mg/dL were confirmed as diabetic (24).
A total of 20 rats underwent the diabetes induction procedure. One week after STZ-NA injection, FBG was measured. Sixteen rats (80%) had FBG levels > 150 mg/dL and were confirmed as diabetic. No animals were excluded after successful induction. The baseline postinduction FBG values, measured one week after STZ-NA injection and before the start of supplementation, were as follows: DC group, 178.4 ± 12.6 mg/dL; and DS group, 176.9 ± 13.2 mg/dL. There was no significant difference between the two diabetic groups at baseline (P = 0.78), confirming comparability before the intervention.
3.3. Welfare Monitoring and Humane Endpoints
All animals were monitored daily for general health and welfare indicators, including body weight, food and water intake, fur condition, posture, gait, behavioral changes, and signs of distress, such as piloerection, hunched posture, and lethargy. Welfare assessments were performed by a trained veterinarian blinded to group allocation. Humane endpoints were established in accordance with institutional guidelines and included 1) weight loss exceeding 20% of initial body weight, 2) inability to reach food or water, 3) persistent signs of severe pain or distress, such as self-mutilation or vocalization, 4) a moribund state, and 5) development of tumors or severe infection. No animal reached any humane endpoint during the study period.
3.4. Synthesis and Supplementation of Magnesium Nanoparticles
The precipitation technique was used to synthesize magnesium nanoparticles. Briefly, 0.1 M magnesium nitrate hexahydrate was dissolved in 200 mL of deionized water. Next, 0.1 M sodium hydroxide was added dropwise with vigorous stirring to achieve a pH of approximately 10. The solution was stirred magnetically for 1 hour and then left undisturbed for 4 hours to allow precipitation. The precipitate was filtered, washed several times with distilled water, and dried at 80°C for 4 hours. The powder was then calcined at 400°C for 3 hours to obtain MgO NPS. Characterization of MgO NPS confirmed the successful synthesis of high-purity nanoparticles with an average crystallite size of approximately 25 nm, spherical morphology, and the characteristic face-centered cubic crystal structure of MgO NPS. For oral gavage administration, the required daily dose (300 mg/kg body weight) of MgO NPS was freshly weighed and suspended in distilled water at a final concentration of 30 mg/mL. The suspension was dispersed using an ultrasonic bath (40 kHz, 5 minutes) immediately before each administration to disrupt agglomerates and ensure uniform dispersion. Between successive gavage administrations, approximately 2 - 3 hours apart, the suspension was kept under continuous magnetic stirring at room temperature to prevent sedimentation. No visible aggregation or sedimentation was observed during the dosing period. The supplement was administered by oral gavage at a dose of 300 mg/kg/day for 8 weeks (24). During the 8-week oral gavage period, no mortality was observed in any group. No signs of treatment-related adverse effects, including behavioral changes, piloerection, diarrhea, weight loss > 20%, or refusal of oral gavage, were observed in the DS group. All animals tolerated supplementation well and completed the study protocol.
3.5. Dissection and Tissue Sampling
Forty-eight hours after the final intervention and following a 12-hour fast, rats were anesthetized with an intraperitoneal injection of ketamine (50 mg/kg) and xylazine (10 mg/kg). Blood samples were collected directly from the left ventricle. A portion of the blood was used for immediate glucose testing; the remainder was centrifuged at 3000 rpm for 10 minutes to isolate serum, which was stored at -80°C. The large lobe of the liver was immediately excised, rinsed in ice-cold normal saline, and divided into small segments (50 - 100 mg), which were placed in RNAlater solution. Samples were stored at -80°C for RNA extraction and analysis of Fetuin-A gene expression.
3.6. Laboratory Analyses
3.6.1. Measurement of Glucose, Insulin, and Insulin Resistance
Serum glucose levels were determined using an enzymatic colorimetric method based on the glucose oxidase reaction and commercially available kits (Pars Azmun, Iran). Serum insulin levels were quantified using a rat-specific enzyme-linked immunosorbent assay kit. To evaluate insulin resistance, the Homeostatic Model Assessment for Insulin Resistance (HOMA-IR) index was calculated using the following formula:
HOMA-IR = (Fasting Glucose [mg/dL] × Fasting Insulin [μU/mL])405
3.6.2. RNA Extraction, cDNA Synthesis, and Real-Time PCR
Total RNA was extracted from liver tissue using a specialized RNA isolation kit (RNX-Plus, Sinaclon, Iran). RNA purity and concentration were verified using a NanoDrop spectrophotometer (A260/A280 ratio between 1.8 and 2.0). Complementary DNA (cDNA) was synthesized from 1 μg of total RNA using a reverse-transcription kit (Yekta Tajhiz Azma, Iran) according to the manufacturer's instructions.
Real-time PCR was performed using SYBR Green Master Mix (Ampliqon, Denmark) on a LightCycler 96 system (Roche, Germany). The thermal cycling protocol consisted of initial denaturation at 95°C for 10 minutes, followed by 40 cycles of 95°C for 15 seconds and 60°C for 60 seconds. Primer specificity was confirmed by melt-curve analysis, ramping from 60°C to 95°C at 0.1°C/s, which produced a single sharp peak for both Fetuin-A and GAPDH, indicating no primer-dimer formation or nonspecific amplification. In addition, PCR products were verified by agarose gel electrophoresis (2%), which showed a single band at the expected size for each amplicon. No-template controls and no-reverse-transcriptase controls were included in each run and yielded no detectable fluorescence, confirming the absence of contamination and genomic DNA amplification. PCR efficiency was calculated for each primer pair using a standard curve generated from serial 5-fold dilutions of pooled cDNA (5 points in triplicate). The efficiency values were 98.5% for Fetuin-A and 99.2% for GAPDH, both within the acceptable range of 90% - 110%, with correlation coefficients (R2) > 0.99. The stability of GAPDH as a reference gene was verified using the coefficient of variation (CV) of Ct values across all experimental groups (HC, DC, and DS). The mean Ct values for GAPDH were 21.4 ± 0.3, 21.6 ± 0.4, and 21.5 ± 0.3 in the HC, DC, and DS groups, respectively, with an overall CV of 1.2%, confirming stable expression across conditions without a significant group effect (P = 0.52). All reactions were performed in duplicate technical replicates for each biological sample (n = 8 per group). Any replicate with a Ct standard deviation > 0.5 cycles was repeated. Outlier Ct values, identified by Grubbs' test at α = 0.05, were excluded from analysis, and the remaining values were averaged. Relative Fetuin-A gene expression was calculated using the Livak method (2-ΔΔCt), normalized to GAPDH as the reference gene. Results are presented as fold changes relative to the healthy control group. Table 1 shows the primer specifications for Fetuin-A. All laboratory analyses, including glucose measurement, insulin ELISA, RNA extraction, cDNA synthesis, and real-time PCR, were performed by technicians blinded to group allocation. Sample codes were anonymized before delivery to the laboratory and were decoded only after all data had been collected and verified
Table 1.
Primer Specifications for Fetuin-A
| Parameters | Fetuin-A (Ahsg - Rattus norvegicus) | GAPDH |
|---|---|---|
| Forward primer (5' -> 3') | ATCAGGGAGGATGGAACAGTGG | GTGCCAGCCTCGTCTCATAG |
| Reverse primer (5' -> 3') | AGCTCCATCTGGCTGTTGGCAA | CTTGCTCAGTGTCCTTGCTG |
| Primer length | 22 bp / 22 bp | 20 bp / 20 bp |
| GC content (%) | 54.5% / 54.5% | 55% / 50% |
| Melting temperature (Tm) | ~60.6°C / ~61.4°C | ~60°C / ~59°C |
| Amplicon size | 150 bp | 130 bp |
| NCBI accession (rat) | NM012786.1 | NM017008.4 |
| PCR efficiency (%) | 98.5% | 99.2% |
3.7. Statistical Analysis
Data are presented as mean ± standard deviation (SD). Differences between groups were analyzed using one-way analysis of variance (ANOVA). When significant differences were detected, Tukey's post hoc test was applied. All analyses were performed using SPSS version 22, with the significance level set at P < 0.05. Statistical analysis was performed blinded to group allocation. Group codes were concealed from the statistician and revealed only after all statistical calculations had been completed and the results finalized. The normality of data distribution was assessed using the Shapiro-Wilk test (P > 0.05 for all groups). Homogeneity of variances was verified using Levene's test (P > 0.05 for all variables). When significant differences were detected, Tukey's HSD post hoc test was applied.
4. Results
Descriptive statistics for the relative gene expression of Fetuin-A and insulin resistance are presented in Table 2.
Table 2.
Relative Gene Expression of Fetuin-A and Insulin Resistance
| Variables and Groups | Mean ± SD |
|---|---|
| Fetuin-A | |
| Health control | 1.03 ± 0.05 |
| Diabetic control | 1.61 ± 0.16 |
| Diabetic + MgO NPS | 1.05 ± 0.10 |
| HOMA-IR | |
| Health control | 0.96 ± 0.13 |
| Diabetic control | 1.65 ± 0.25 |
| Diabetic + MgO NPS | 1.16 ± 0.16 |
| Fasting glucose (mg/dL) | |
| Health control | 92.00 ± 0.13 |
| Diabetic control | 135.12 ± 12.32 |
| Diabetic + MgO NPS | 110.10 ± 10.41 |
| Fasting insulin (μU/mL) | |
| Health control | 4.2 ± 0.40 |
| Diabetic control | 4.95 ± 0.50 |
| Diabetic + MgO NPS | 4.27 ± 0.44 |
One-way ANOVA revealed significant differences among the groups in both Fetuin-A levels (F(2, 21) = 59.58, P < 0.0001) and insulin resistance (F(2, 21) = 24.74, P < 0.0001). Tukey’s post hoc test demonstrated that rats with T2DM had significantly higher Fetuin-A levels and greater insulin resistance than healthy control rats (P < 0.0001 and P = 0.001, respectively). Supplementation with magnesium nanoparticles significantly reduced both Fetuin-A levels (Figure 1) and insulin resistance (Figure 2) in diabetic rats (P < 0.0001 and P = 0.001, respectively).
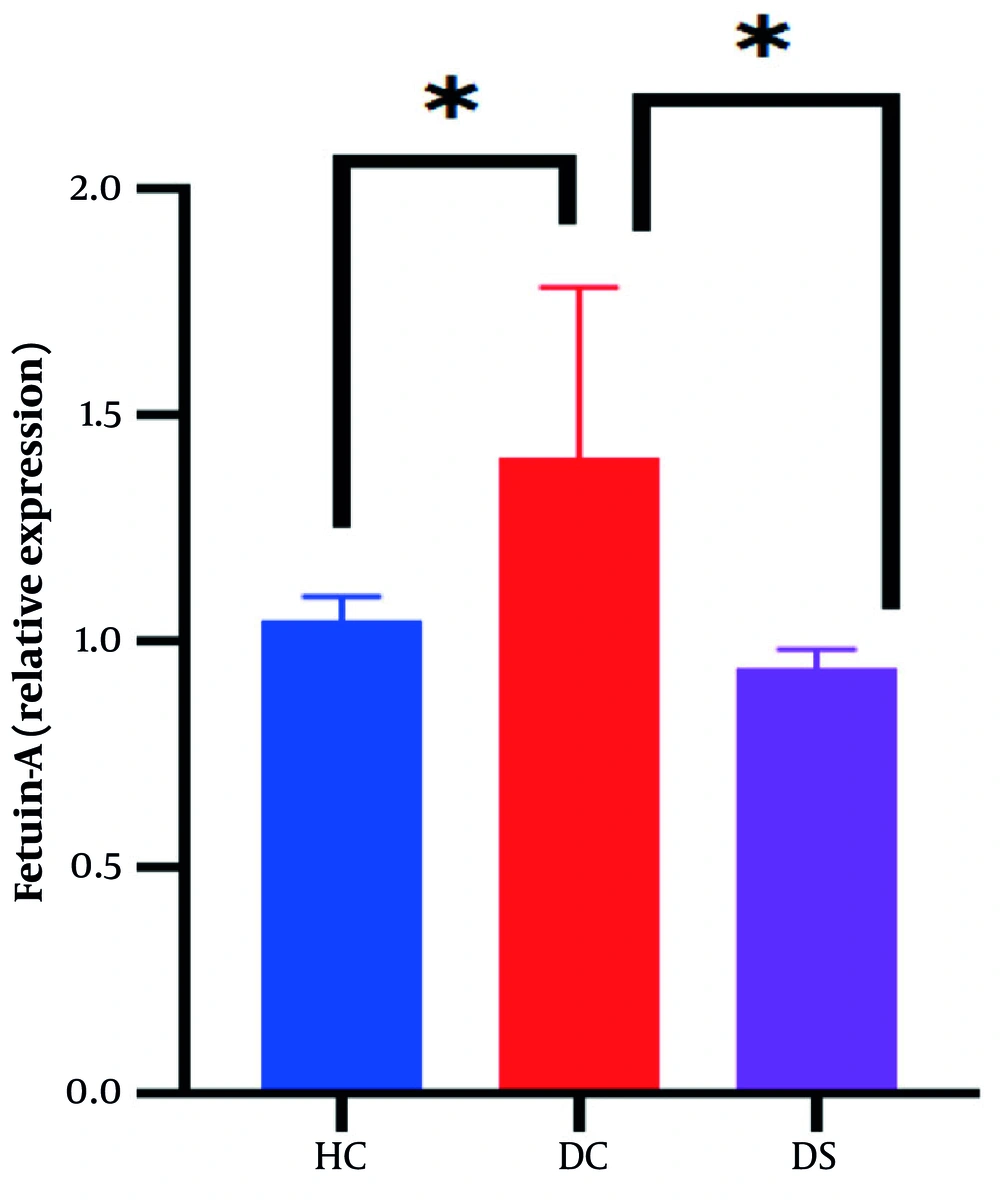
Figure 1.
Comparison of hepatic Fetuin-A gene expression among the experimental groups. Data are presented as mean ± SD (n = 8 per group). One-way ANOVA with Tukey's HSD post hoc test was used for statistical analysis. The asterisk (*) indicates a significant difference compared with the Diabetic Control (DC) group (P < 0.001). Group abbreviations: HC, Healthy Control; DC, Diabetic Control; DS, Diabetic + MgO Supplementation.
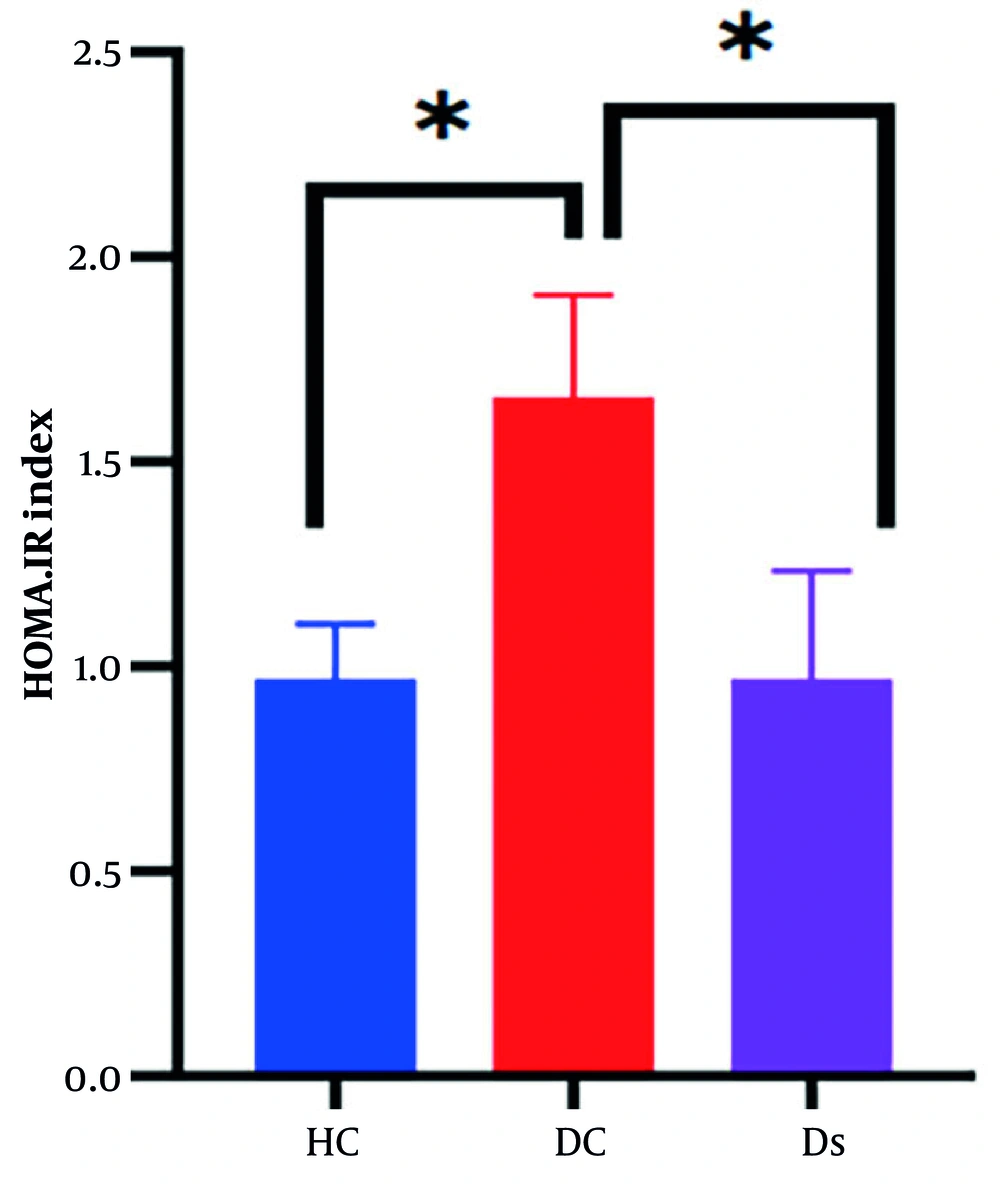
Figure 2.
Comparison of insulin resistance (HOMA-IR) among the experimental groups. Data are presented as mean ± SD (n = 8 per group). One-way ANOVA with Tukey's HSD post hoc test was used for statistical analysis. The asterisk (*) indicates a significant difference compared with the Diabetic Control (DC) group (P = 0.001). Group abbreviations: HC, Healthy Control; DC, Diabetic Control; DS, Diabetic + MgO Supplementation.
Table 3 shows the effect sizes and confidence intervals. The sample size (n = 8 per group) was determined based on similar previous studies (24). A power analysis, assuming an effect size (Cohen’s d) of 1.5, α = 0.05, and power (1 - β) = 0.80, indicated that a minimum of 6 animals per group would be required. To account for potential technical issues or dropouts, 8 animals per group were included.
Table 3.
Effect Sizes and Confidence Intervals a
| Comparison (DC vs. DS) | Mean Difference | Cohen's d |
|---|---|---|
| Fetuin-A | 0.56 (0.38 to 0.74) | 4.28 (2.55 to 5.98) |
| HOMA-IR | 0.49 (0.24 to 0.74) | 2.31 (1.12 to 3.47) |
a Values are expressed as 95% CI.
5. Discussion
This study examined whether MgO NPS could reduce hepatic Fetuin-A gene expression and improve insulin resistance in rats with T2DM. After 8 weeks of treatment, diabetic rats receiving MgO NPS showed significantly lower Fetuin-A levels and reduced insulin resistance, as measured by HOMA-IR, than untreated diabetic controls. These findings suggest that MgO NPS may help reverse insulin resistance, at least in part, by targeting hepatic production of this key metabolic mediator.
As expected, diabetic control rats exhibited markedly higher Fetuin-A expression and greater insulin resistance than healthy animals, consistent with previous research. Fetuin-A is known to bind to TLR4, thereby triggering inflammation and worsening lipid-induced insulin resistance (5). It also directly blocks insulin receptor autophosphorylation, impairing downstream signaling (18). Clinically, elevated serum fetuin-A is consistently associated with metabolic syndrome, T2DM, and its complications (8). The strong correlation observed between Fetuin-A levels and HOMA-IR in diabetic rats further supports its central role in insulin resistance.
The most notable finding of this study was that MgO NPS significantly lowered Fetuin-A gene expression. Although magnesium has long been associated with improved glycemic control and insulin sensitivity (25-28), the underlying biological pathways remain unclear. Our data suggest that suppression of Fetuin-A may represent one key mechanism. Although the direct link between magnesium and fetuin-A has not been widely studied, magnesium deficiency is known to promote inflammation and metabolic dysfunction (9, 10). Therefore, restoring magnesium, particularly via a highly bioavailable nanoparticle form, may help normalize liver function and reduce the secretion of harmful hepatokines such as fetuin-A. This interpretation is consistent with evidence that ellagic acid improves insulin sensitivity concomitant with reduced fetuin-A levels (21).
The parallel improvement in HOMA-IR provides functional support for these molecular changes. Magnesium acts as a cofactor for numerous enzymes involved in glucose metabolism and insulin signaling (9). In the present study, lower Fetuin-A levels may have facilitated insulin receptor activation by reducing its inhibitory effect (29). In addition, MgO NPS possess anti-inflammatory properties that may further support insulin sensitivity, as chronic inflammation is a major contributor to insulin resistance in T2DM (18). Magnesium repletion has also been shown to reduce inflammatory markers (10), further reinforcing this pathway.
The nanoparticle delivery system likely played a crucial role. MgO NPS offer better absorption, higher bioavailability, and improved cellular uptake than conventional magnesium salts (14, 15). Previous animal studies have reported stronger antidiabetic effects with MgO NPS, including reduced blood glucose, improved lipid profiles, and reduced oxidative stress (16-18). Their antioxidant capacity may also protect against cellular damage linked to diabetic complications (18). Thus, the benefits observed in this study likely reflect both the metabolic actions of magnesium and the unique advantages of the nanoformulation.
Our results align with several clinical trials showing that magnesium supplementation improves insulin sensitivity and glycemic control in people with T2DM. A systematic review and meta-analysis by Asbaghi et al. (25) examined controlled clinical trials and found that oral magnesium supplementation significantly improved glycemic control in patients with T2DM through dose-dependent effects. Similarly, ELDerawi et al. (26) reported that oral magnesium supplementation improved glycemic response among patients with T2DM, demonstrating beneficial effects on glucose metabolism. More recently, Albajri et al. (27) conducted a quasi-experimental study showing that magnesium-based nutritional education positively affected lipid profiles in individuals with T2DM. Another comprehensive systematic review and meta-analysis by Simental-Mendia et al. (30) confirmed that magnesium supplementation in randomized controlled trials had favorable effects on both insulin sensitivity and glucose control. In nondiabetic populations, Lee et al. (19) found that oral magnesium supplementation improved insulin sensitivity and blood pressure in normomagnesemic, nondiabetic, overweight Korean adults, suggesting broader metabolic benefits of magnesium. Mooren et al. (20) similarly reported that oral magnesium supplementation reduced insulin resistance in nondiabetic subjects in a double-blind, placebo-controlled randomized trial.
Alternative explanations for the observed improvement in HOMA-IR should also be considered. Magnesium, even in conventional forms, acts as an essential cofactor for multiple enzymes involved in glucose metabolism and insulin signaling, including the tyrosine kinase activity of the insulin receptor (8). Therefore, magnesium repletion per se could directly enhance insulin sensitivity independent of fetuin-A modulation. In addition, MgO nanoparticles possess well-documented antioxidant and anti-inflammatory properties that may reduce systemic inflammation, a key driver of insulin resistance in T2DM, without necessarily acting through fetuin-A (16-18). The reduction in hepatic Fetuin-A gene expression observed in this study may therefore represent one of several parallel mechanisms rather than the sole or primary mediator of improved insulin resistance. Future studies using pathway-specific inhibitors or genetic knockdown models are needed to establish causality.
However, not all studies have reported uniformly positive results. Sadeghian et al. (13) conducted a double-blind randomized controlled clinical trial in patients with diabetic nephropathy and found a paradoxical outcome: oral magnesium supplementation improved lipid profiles but unexpectedly increased insulin resistance as measured by HOMA-IR. This inconsistency may reflect several factors unique to their study population. Patients with diabetic nephropathy represent a more complex clinical scenario, with altered mineral metabolism and impaired renal function, which could affect magnesium handling and its metabolic effects. In addition, the dose, duration, and form of magnesium supplementation varied across studies, potentially explaining divergent outcomes. Baseline magnesium status also differs among populations, and individuals who are truly magnesium deficient may respond more favorably to supplementation than those with normal magnesium levels. The specific formulation also matters; conventional magnesium salts used in most clinical trials have lower bioavailability than nanoparticle forms, which may explain why the present study using MgO NPS showed clear beneficial effects. Moreover, comorbidities such as nephropathy, the specific diabetic subtype, disease duration, and concurrent medications could all influence responses to magnesium supplementation. The use of a standardized nanoparticle protocol for 8 weeks in a controlled diabetic rat model likely contributed to the consistent positive effects observed in this study. Furthermore, by directly measuring hepatic Fetuin-A gene expression, a step missing in most prior clinical work, this study provides new mechanistic insight into how magnesium might influence insulin signaling at the molecular level and offers a biological explanation for the observed improvements in insulin resistance.
5.1. Limitations
This study had several limitations. First, although a significant reduction in hepatic Fetuin-A mRNA expression was observed, serum Fetuin-A protein levels and downstream insulin signaling molecules, such as IRS-1 and Akt phosphorylation, were not measured. Therefore, the proposed mechanistic link between Fetuin-A downregulation and improved insulin resistance remains inferential rather than directly demonstrated. Second, inflammatory cytokines, such as TNF-α and IL-6, oxidative stress markers, and tissue magnesium levels were not assessed, although these factors could independently contribute to the improvement in HOMA-IR.
5.2. Future Directions
Future studies should address these gaps. Comparing different doses and forms of magnesium, including nano and standard formulations, would help optimize therapy. Measuring both Fetuin-A mRNA and serum protein levels, along with key insulin signaling molecules, would deepen mechanistic understanding. Longer interventions could assess durability and safety. Exploring combinations such as MgO NPS plus exercise or dietary changes may reveal synergistic benefits. Ultimately, well-designed clinical trials in people with T2DM are needed to determine whether these promising preclinical results can be translated into real-world treatments.
5.3. Conclusions
In summary, MgO NPS significantly reduced hepatic Fetuin-A gene expression and improved insulin resistance in diabetic rats. These findings provide novel evidence that MgO NPS are associated with reduced hepatic Fetuin-A expression and improved insulin resistance. Although the directionality of this relationship remains to be confirmed, downregulation of Fetuin-A represents a plausible mechanistic pathway contributing to the observed metabolic benefits.