
1. Background
Cardiovascular diseases (CVDs) are the number one cause of deaths globally (1). Lipid disorders, high blood pressure (HBP), as well as type 2 diabetes (T2D) have been identified as significant predictors of CVD (2). Many of the leading causes of diseases as well as deaths globally are related to health behaviors; therefore, the role of behavior in the promotion of health and the prevention of disease is essential (3). It is now widely understood that unhealthy diets and physical inactivity play a significant role in the causation and progression of chronic disease (4). It is estimated that 120 - 180 minutes of moderate-intensity physical activity (PA) per week may substantially reduce CV risk factors (5). Furthermore, achievable changes in diet (e.g., adoption of a diet high in whole grain, fruit, nuts, and olive oil) have been demonstrated to lead to a reduction in CV risk factors including T2D, hypertension, and metabolic syndrome (6). The INTERHEART study identified 9 easily measured and potentially modifiable risk factors, which included physical inactivity and an unhealthy diet (7). In Iran, non-communicable diseases (NCDs) are estimated to account for 76% of total deaths that contribute to CVD is 46% (8). The results of the third national surveillance regarding NCDs risk factors showed that 40% of Iranian adults (31.6% men and 48.6% women) belonged to a low PA category and 15% of Iranian adults (4.7 million people) do not engage in any PA (9).
The prevailing wisdom in the field of health related behavior change is that well- designed and effective interventions are guided by theory regarding target behavior (10). Investigators need to not only know that the use of theory is a requirement in the field, but also how to effectively select and use multiple theories to design, test, and report interventions given the potential for enhancing effectiveness of health promotion programs by incorporating constructs and methods from across theories (10). Theory-based educational interventions hold the potential to positively influence determinants of behavioral and environmental causes in the intervention group compared with the control group somewhat such as changing self-efficacy or perceived risk. However, many interventions are presented as a ‘black box’, without description of the methods that lead to change in these determinants (11-13).
Intervention mapping (IM) is a health promotion program-planning framework, which helps health promotion and health education planners develop theory as well as evidence-based programs (14). It provides a framework for program planners to identify theory-driven determinants of behavioral and environmental causes related to a specified health problem, as well as guidance in the selection of the most appropriate methods and applications to address the identified determinants to achieve changes in behavioral and environmental outcomes related to a health problem (14).
2. Objectives
This paper describes the development of an intervention based on IM framework aimed at promoting PA and HE among adults who present CVMRFs.
3. Methods
IM consists of a 6 steps which include the planning process, which needs assessment, identifying what needs to change, the identifying theoretical methods and the practical applications, developing a program and themes, planning for adoption, implementation and sustainability, as well as planning for evaluation (Figure 1) (14). In the following section, we describe our approach for developing a community-based intervention aimed at preventing CVMRFs via the promotion of PA and HE.
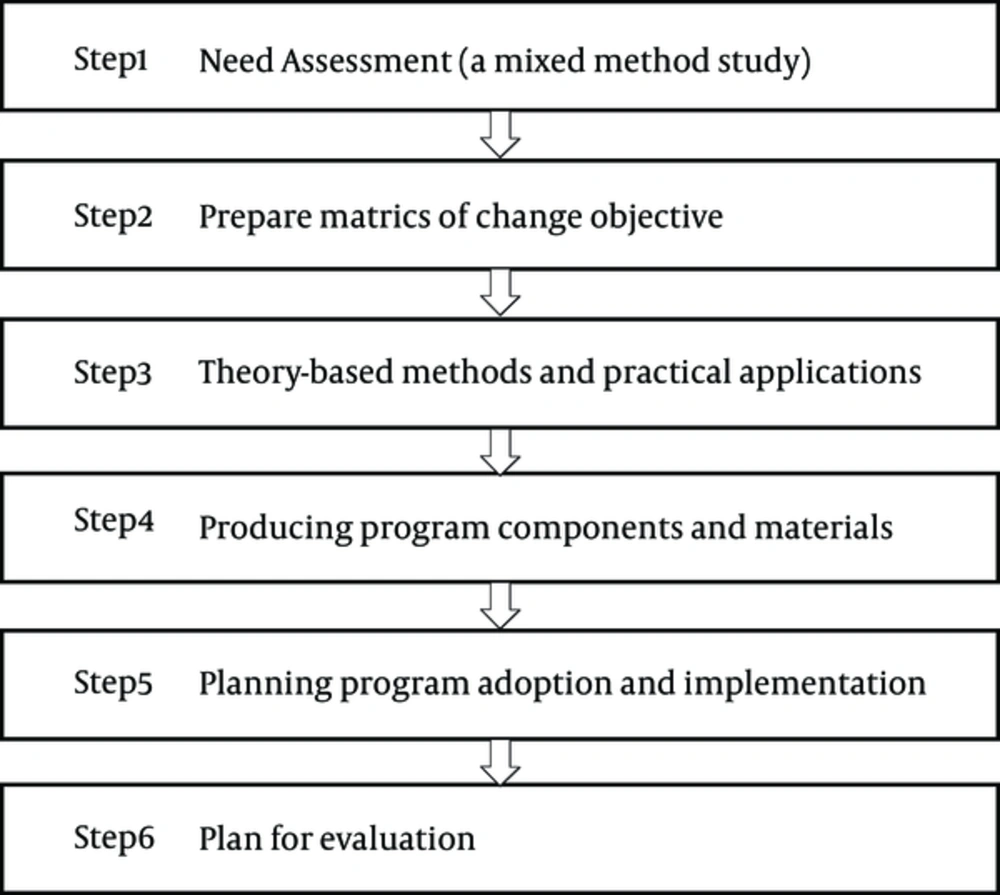
Figure 1.
Intervention Mapping Steps
Need assessment: The first step is based on the PRECEDE model, which provides a robust conceptual framework to explore a given health problem, the behavioral and environmental causes of the problem, and its determinants (14). In this step, we first conducted a literature review regarding the prevalence of CVD in adults with CVMRFs and founded it was a significant health problem in Iranian adults. Then we explored the behaviors and environmental causes to CVMRFs. It has been suggested that the need assessment step should conduct a multi method research (14). The current study was a mixed method research (qualitative and quantitative) that was conducted in community health centers associated with the Alborz University of Medical Sciences, which is located in Karaj-Iran in 2014. Due to the use of the PRECEDE Model in this study, this research was a sequential transformative design (15) because the qualitative study was used prior to the quantitative study. In the qualitative phase, we used the directed content analysis, in this approach, an initial coding begins with a theory and theory can help to focus on research questions (16). In this phase, we asked; what are the behavioral and environmental causes to CVMRFs among adults? Furthermore, we asked questions regarding the determinants of the behaviors and environmental causes. First, we interviewed with 50 adults who had at least 1 CVMRFs such as, T2D, metabolic syndrome, hyperlipidemia, and hypertension. In the PRECEDE model, the environmental factors are outside the at risk population, which are agents in the environment who have control over or can influence a modification in the environmental factor (14). In this study, healthcare providers (HPs) in the community health centers including a nurse, general practitioner (GP), and dietician played an important role as the environmental factors to control status of the patients. Therefore, in addition to the patients, 12 HPs in the community health centers were individually interviewed. The interview guide consisted of open-ended questions based on PRECEDE Model.
In the quantitative phase, we carried out a survey to assess the determinants of adults’ engagement in PA and HE. A questionnaire was developed using qualitative findings and then its validity and reliability were evaluated and confirmed (17). Samples were selected by multistage sampling as follows: (i) Karaj city was divided into 3 regions: north, central, and south; (ii) 2 health community centers were randomly selected from each region; (iii) the quota of patients, which was chosen from each center, was proportionate to the number of patients in it; (iv) the patients from each center were randomly selected in the study based on their identification number. For the sample size, Walts et al. have suggested 3 - 10 samples for each item of the questionnaire (18), thus in the present study, based on 89 items of dietary questionnaire, 5 subjects were selected for each item and a total of 450 subjects were chosen. For the practice of the dietary and PA, the questionnaire of the Isfahan cardiovascular center was used (19). The patients read the consent form and completed the questionnaires. All of the participants were justified regarding the research objectives, however, their participation was voluntary and anonymous. Furthermore, the study was approved by the ethics committee of Shahid Sadoughi University, Yazd (No: P/17/1/57802). Statistical analysis of the data using structural equation modeling (SEM) was performed using the Amos software version 18.
Preparing matrices of change objectives: in this step, the behavioral and environmental outcomes are first determined. The behavioral and environmental outcomes were defined in terms of what a health promotion program is intended to accomplish (14). As mentioned above, behavioral causes were HE and PA, also environmental causes were HPs who have worked in community health centers as well as the patients’ families. Then planners wrote performance objectives for each of the behavioral and environmental outcomes. Performance objectives are statements of what a program participants will do or the environmental agents need to do in order to accomplish the behavioral and environmental outcomes (14). First, the performance objectives were written using the literature reviews and the panel experts such as; nutritionists, exercise physiologist, and health education experts.
Then, determinants must be specified for performance objectives. Determinants are those factors that have been found to be associated with the performance of behavior of at-risk population or agents that have controlled environmental outcomes (14). Determinants are 2 categories; first, personal determinants that rest within individuals (people at risk or agents in the environment) and can be changed by intervention. These personal determinants usually include cognitive factors (such as knowledge, attitudes, beliefs, values, self-efficacy, and expectations) (14). Second, the environmental determinants that rest outside the individual and influence behavior are considered environmental conditions and are addressed in IM as environmental outcomes. These environmental conditions may include such factors as social influences (such as norms, social support, and reinforcement) or structural influences (such as access to resources, policies, and organizational climate) (14). Social influences are the same reinforcing factors and structural influences are the same enabling factors of the PRECEDE model. For identifying, determinants can use from the literature reviews and theories related to behavioral sciences. In the current study, determinants were identified in the need assessment step based on the PRECEDE model by using qualitative and quantitative study.
Finally, change objectives were written for recognized determinants. Change objectives specify what needs to change in determinants of behavioral or environmental outcomes in order to accomplish performance objectives (14). Matrices are simple tables formed by entering performance objectives on the left side of the matrix and determinants along the top. Change objectives are entered into the cells formed at intersection of each performance objective and determinants (14).
Selecting theory- based intervention methods and practical applications: A theoretical method is a general technique for influencing changes in the determinants of behaviors and environmental conditions, and practical applications are specific techniques for practical using of theoretical methods (14). The methods have chosen from theory and the literature. These methods will be the basis of intervention components to modify performance and change the objective related to behavior and environmental conditions of the at-risk population and the environmental agents. In the current study, we used from theory-based methods that were introduced by Bartholomew and others (14). Furthermore, we selected practical applications for each method. In addition, we conducted the literature reviews to find the theory-based methods for changing important determinants of PA and HE in people with CVMRFs.
Producing program components and materials: For major determinants identified, theory based methods and practical applications were used. These theoretical methods and practical applications will be components of the intervention program (14). First, HPs who have worked in community health centers will be trained by health education experts to learn theoretical methods and practical applications. Second, they will train patients and their families in order to control CVMRFs.
Planning program adoption and implementation: To reduce the gap between development of an effective program and its actual using in communities, it is important to use a systematic framework during planning (14). In step 5 of IM, focus is planning an intervention to ensure that the developed program in previous steps will be used and maintained over time. Therefore after developing a program, it must be specified that individuals or organizations will adopt and implement that program (14). In the current study, adopters and implementers of the developed program were not individuals; it was an organization with the name of Unit of NCD in Health Deputy. The first author also had a meeting regarding the developed program with stakeholders of the diabetes program in health deputy of Alborz province.
Planning for evaluation: The purpose of evaluation is to determine whether intervention was successful in the meeting program goals and objectives and why intervention was or was not successful (14). In this study we were going to report a plan for process evaluation and impact evaluation of the developed program. The phase of process evaluation, how to run a program, theoretical methods, practical applications, and schedule all activities that the intervention group would receive, they would have been evaluated and their strengths and weaknesses would have been identified. The phase of process evaluation includes steps 3, 4 and 5 of IM. In order to assess the impact evaluation, we will use a comparison group, an intervention group and a control group, with similar characteristics, which would have been chosen to measure the effect of developed program on short-term outcomes such as; behavioral objectives, change objectives, determinants as well as the long-term consequences of physiological parameters such as; blood glucose, blood lipids, and blood pressure. Steps 1 and 2 of IM would have been used in impact evaluation.
4. Results
Need assessment: in step 1 of IM, literature reviews were executed to gain insight into prevalence of CVMRFs in Iran. The surveillance findings of NCD risk factors in Iran on the 15 - 64 year old population showed, 44% people who were the age of 25 - 64 were suffering from obesity or being overweight, 16/09% of the individuals had a blood pressure of ≥ 140/90 mmHg and 6/12% had a blood pressure of ≥ 170/10 mmHg (20). The overall frequency of high blood sugar was equal to 9/73%. It showed an upward trend with increasing age so that in the age group of 55 - 64 years, the prevalence of diabetes was 20/97%. The prevalence of high cholesterol was 32/9% (20). Furthermore, respectively, 21/8% and 16/6% of men and women were suffering from high blood triglycerides. 88/20% of the 15 - 64 year age group consumes less than 5 unit fruits or vegetables daily, furthermore, 38/97% of people had low PA weekly (20). Findings from the qualitative part of this study, which had already been published (21, 22), have proved that unhealthy eating and physical inactivity were behaviors, which predict CVMRFs. Findings of the qualitative part show that personal determinants are the predisposing category (knowledge, attitude, perceived susceptibility, perceived severity, perceived benefits, perceived barriers, and self efficacy), and among them, the determinants of perceived barriers and self efficacy for doing PA and HE were more important than other determinants. Moreover, among the environmental determinants that are included in structural factors or the enabling category (availability and accessibility of health resources, new skills, and law and policies) and social factor or the reinforcing category (social support, motivation to comply, and consequences of behavior), most barriers for performing PA and HE were often structural factors or the enabling category.
Findings of the quantitative part showed that among the identified determinants of both HE and PA behaviors, the determinants, which were strong predictors, should be highlighted for designing an intervention. Findings of the quantitative part, using SEM for HE behavior, showed (Table 1) that determinants such as: knowledge, attitudes, perceived severity, perceived barriers, and self-efficacy were significant in predisposing category and, the determinants of perceived barriers and self-efficacy were stronger predictors. In the enabling category, the determinants of new skills, policies, and laws had a significant relation and were significant predictors. In the reinforcing category, the determinants of social support, motivation to comply and behavioral consequences showed a significant relation and the determinant of motivation comply was a stronger predictor than other determinants. Thus, these determinants should be targeted in designing a program to improve HE behavior. For PA behavior in the predisposing category (Table 2), the determinants of perceived susceptibility, attitudes, perceived barriers, and self-efficacy had a significant relation, where the strongest predictors were self-efficacy and perceived barriers. In the enabling category, the only significant determinant was a new skill. In the reinforcing category, the determinants of social support, motivation to comply, and behavioral consequences were significant and, the determinant of motivation comply was stronger predictor. Thus, these determinants must be targeted in the design of a program to increase PA. All in all, findings of the quantitative part in the predisposing category confirmed results of the qualitative part, it means self-efficacy and perceived barriers were important personal determinants that caused the patients to not have enough PA and did not follow HE. While findings of the quantitative part in enabling and reinforcing categories did not confirm results of qualitative part, it means, in the qualitative section, structural factors (enabling category) were the important environmental determinants, however, in the quantitative section, social factors (reinforcing category) were the most important environmental determinants for PA and HE.
Table 1.
Path Coefficients of PRECEDE Model Construes with Healthy Eating
| Independent Variable | Dependent Variable | Standardized Coefficients | P Value |
|---|---|---|---|
| Enabling | Reinforcing | 0.36 | 0.001 |
| Reinforcing | Predisposing | 0.55 | 0.001 |
| Predisposing | Healthy Eating | 1.12 | 0.001 |
| Enabling | Healthy Eating | 0.38 | 0.11 |
| Reinforcing | Healthy Eating | 0.67 | 0.001 |
| Perceived susceptibility | Predisposing | 0.064 | 0.19 |
| Perceived severity | Predisposing | 0.30 | 0.001 |
| Knowledge | Predisposing | 0.14 | 0.005 |
| Attitude | Predisposing | 0.26 | 0.001 |
| Perceived benefits | Predisposing | 0.051 | 0.19 |
| Perceived barriers | Predisposing | -0.33 | 0.001 |
| Self efficacy | Predisposing | 0.49 | 0.001 |
| New skill | Enabling | 0.58 | 0.001 |
| Healthy resources | Enabling | 0.012 | 0.85 |
| Law and policies | Enabling | 0.36 | 0.01 |
| Social support | Reinforcing | 0.42 | 0.001 |
| Motivation to comply | Reinforcing | 0.81 | 0.001 |
| Consequences of behavior | Reinforcing | 0.17 | 0.005 |
Table 2.
Path Coefficients of PRECEDE Model Construes with Physical Activity
| Independent Variable | Dependent Variable | P Value | |
|---|---|---|---|
| Standardized Coefficients | |||
| Enabling | Reinforcing | 1.017 | 0.11 |
| Reinforcing | Predisposing | 0.56 | 0.000 |
| Predisposing | Physical activity | 0.015 | 0.10 |
| Enabling | Physical activity | 0.001 | 0.34 |
| Reinforcing | Physical activity | 0.99 | 0.00 |
| Perceived susceptibility | Predisposing | -0.25 | 0.00 |
| Perceived severity | Predisposing | 0.012 | 0.82 |
| Knowledge | Predisposing | 0.060 | 0.23 |
| Attitude | Predisposing | 0.25 | 0.001 |
| Perceived benefits | Predisposing | 0.01 | 0.99 |
| Perceived barriers | Predisposing | -0.63 | 0.000 |
| Self efficacy | Predisposing | 0.90 | 0.000 |
| New skill | Enabling | 0.38 | 0.000 |
| Health resources | Enabling | 0.12 | 0.34 |
| Law and policies | Enabling | 0.16 | 0.09 |
| Social support | Reinforcing | 0.23 | 0.000 |
| Motivation to comply | Reinforcing | 0.47 | 0.000 |
| Consequences of behavior | Reinforcing | 0.009 | 0.17 |
Prepare matrices of change objectives: First, we wrote behavioral and environmental outcomes for both behaviors of a unhealthy diet and inactivity. Then, for any behavioral and environmental outcomes, we wrote performance objectives. Finally, by entering the performance objectives on the left side of the matrix and determinants along top, matrix of change objectives was formed. For example for dietary behavior, behavioral outcomes include: 1-Increase consumption of healthy foods (fruits, vegetables, whole grains, fish), 2-Reduce intake of harmful foods (salt, fat, simple carbohydrates), and the environmental outcomes including; supporting of the patients by family and HPs to follow a healthy diet. Performance objectives and sample of matrix of change objectives are listed below (Table 3).
Table 3.
Performance Objectives to Increase Consumption of Healthy Foods
| Performance Objectives | |
|---|---|
| 1 | Increasing consumption of the healthy foods (fiber, whole grains, fish) |
| 1 | Patients consume fruits at least 3 times or more per day. |
| 2 | Patients consume raw or cooked vegetables at least 3 times or more per day. |
| 3 | Patients consume fish at least once or twice a week. |
| 4 | Patients increase consumption of whole grains in their meals. |
| 5 | Patients balance calorie intake to the number of calories that they burn. |
Theory-based methods and practical applications: The chosen theoretical methods and the practical applications were identified in order to influence determinants and change objectives (Table 4). Table 5 shows an example of the theoretical methods and the practical applications in accordance with determinants.
Table 4.
Matrix of Change Objectives to Increase the Consumption of Healthy Foods
| Performance Objectives | Knowledge | Attitude | Expected Outcomes/Consequences of Behavior. | Barriers | Efficacy/Skills | Subjective Norms/Motivation Comply |
|---|---|---|---|---|---|---|
| Patients increase consumption of whole grains in their meals | K1. Patients name the foods contain whole grains. | A1. Patients feel consumption of whole grains is useful for them. | EO1. Patients expect advised intake of whole grains will help to control the disease and prevent its complications | B1. Patients listed consumption barriers of grain foods. | E1. Patients express their ability to increase consumption of advised grain foods | SN1. Patients recognize the importance of consumption of advised amount of whole grains. |
| K2. Patients express advised intake of whole grains. | A2. Patients Prefer to eat whole grains. | B2. Patients identify the ways to overcome the consumption barriers of grain foods. | E2. Patients arrange a program for regularly consumption of grain foods. | SN2. Patients consider importance of others advice about taking grain foods, and obeys it. |
Table 5.
The Methods are Based on the Theory and Practical Applications for the Determinants
| Determinants | Theoretical Methods | Practical Applications |
|---|---|---|
| Self-efficacy and skill | Goal Setting | Short term goals and then long term goals for the patient were determined by experts so that they make the patients be closer to these goals. |
| Modeling | Some of the group discussions had invited successful patients who could control their disease with diet and regular physical activity, they discuss about their successful methods of diet and physical activity and other patients modeled of their success. | |
| Verbal persuasion | Send proper text messages and make phone calls to encourage the patients to follow an health diet and regular physical activity | |
| Reinforcement | Patients who had controlled their weight, glucose, lipid and blood pressure were given awards to encouraged other patients for following an healthy diet and regular physical activity | |
| Guided practice with feedback | Classes of skills training and calculating calories, setting a healthy diet, reading food labels, setting a regular physical activity programs and skills to have a plan for physical activity with others, healthy cooking manual for patients, especially women. | |
| Public commitment | Design a daily check list for each patient to include his/her tasks for healthy diet and physical activities. | |
| Self-monitoring | Health care providers making a contract with patients to oblige them for doing at least 30 minutes moderate-intensity physical activity everyday and follow healthy diet |
Producing program components and materials: the programs main theme was “Cardiovascular Metabolic Risk Factors Self- Management (CVMRFSM) program in community health Centers”. First, the HPs who have worked in community health centers will be trained for 4 sessions about instructional methods, how to make or choose appropriate instructional materials, theoretical methods and practical applications by experts of health education. Next, they will be trained for 2 sessions by nutritionist and the exercise physiologist. Finally, the patients will be trained for 4 sessions by HPs about CVMRFs and familiar with HE and PA to control their risk factors. In addition, the patient’s families will be trained for 2 sessions regarding familiar with CVMRFs, healthy diet and PA, and their supportive role to create opportunities in order to increase PA and HE behaviors. The duration of each session will be approximately 90 minutes and these meetings will be held once a week. The goal of training HPs is to increase their skills for patient education to change unhealthy behaviors of the patients.
Planning program adoption and implementation: the adaptors of the developed program will be policymakers in the health deputy, which is located in the Alborz province. Implementers of the program will be HPs in community health centers including GPs, the nurses, and the dieticians.
Plan for evaluation: the effectiveness of developed program will be evaluated in a randomized controlled trial using process and impact evaluation. For process evaluation, all instructional activities including educational methods based on theory and practical applications in the intervention group will be assessed through an interview with them. For impact evaluation, short and long term outcomes of developed program using intervention and control groups will be evaluated. In the control group, the patients will receive usual care from HPs, in the intervention group, the patients in addition to usual care, HPs, and the patients’s families will need to train 12 sessions, and these sessions will have been taken for 3 months. Patients in 2 groups, height, weight, waist, and hip circumference, blood pressure will have been measured by meter, scale, and standard gauge. Furthermore, their fasting blood sugar (FBS), triglycerides (TG), cholesterol (CHOL), HDL cholesterol (the good fats), and LDL cholesterol (the bad fats) will have been measured by free blood samples; information of the patients will have been completed on questionnaire. Before instructional sessions, both control and intervention groups will have complete the questionnaires about PA and HE. After educational sessions, control and intervention groups will complete the questionnaires again. The patients in both groups will be followed up after 3 months, during these 3 months, the patients in the intervention group, via phone calls, text messages, their leaders, and in-person meetings will have followed up. Again after 3 months, the questionnaires and anthropometric indices, such as body mass index, waist-hip ratio, and blood parameters (glucose, lipids and blood pressure) will have measured in both groups of the patients.
5. Discussion
The aim of the current study was to describe how IM framework was applied to create a program aimed at promoting PA and HE to prevent CVD in the adults with CVMRFs. The determinants of self-efficacy and perceived barriers (predisposing factors), new skills, laws and policies (enabling factors), as well as social support, motivation to comply, and behavioral consequences (reinforcing factors) were related to engagement in doing PA and following healthy diet. Some determinants such as self efficacy (23), barriers (24), social support (25), as well as laws and policies (24, 26) were confirmed by other studies in patients with diabetes.
Theories that are used to inform nutrition and PA behavior change interventions are often theories primarily meant to explain or predict behaviors (27, 28). Applying such theories comes with 2 important problems. First, a determinant of behavior is not the same as a determinant of behavior change. IM argues that for health promotion intervention development, we should first translate the health-related behavior (e.g. high fat intake) into a health promoting behavior or behavior change (e.g. fat reduction) and then search for determinants of the required change, instead of predictors of present behavior (28). Second, theories that help us gain insight into possible determinants of behavior or behavior changes do not directly tell us how to modify these behaviors (28). Such theories only help us find out what needs to be modified to induce behavior change. Therefore we need to use and build better theories that guide us in how determinants of behavior change can be modified, how to translate behavior change determinants into behavior change methods, strategies, and actual intervention tools (28). In most researches related to health education, only determinants of behavior were recognized (25, 29, 30), however, theory-based methods for changing determinants were not identified. The most health education interventions based on theory (31, 32) have not identified the major determinants; they have just reported some determinants that improved after intervention, however, have not mentioned which theoretical methods have used. These researches have often focused on instructional materials, which have been used such as; brochures, instructional classes, and booklets.
In some studies such as Fanaian et al. (33), Broekhuizen et al. (34), and Artinian et al. (35), in order to promote PA and dietary in people with CVRF, they used techniques and methods such as goal setting, motivational interviewing, modeling, feedback and reinforcement, as well as risk communication for improving lifestyle-related behaviors. However, none of these studies developed a systematic theory-based intervention. Unlike the mentioned studied, Morgenstern et al. (36), van Genugten et al. (37), Detaille et al. (38), Verweij et al. (39), and Cornelio et al. (40) used systematic developments of interventions like IM on different topics. In addition, in a study, which was conducted by Michie et al. (41), they first suggested that behavioral determinants should be identified by theories of behavioral science. Next, for identified determinants they selected the techniques of behavior change. Therefore, IM as a systematic development of interventions for designing health promotion programs is introduced.
5.1. Conclusions
The findings of this study showed that poor eating habits and inactivity were behavioral risk factors associated with the CVMRFs, determinants of these behaviors, which should be modified included: individual conditions (predisposing factors) and environmental conditions {social environment (such as social support, motivation to comply and behavioral consequences) and structural environment (such as presence and access to resources, laws and policies and new skills. Identifying these determinants can help health planners to choose the most appropriate methods and strategies to change them and reducing risky behaviors in order to improve metabolic risk factors and prevention of CVD, due to the fact that the most immediate impact of an intervention is usually on a set of well-defined determinants of behavior and environmental conditions. The developed programs with this approach could be adopted and implemented by policymakers if the effectiveness of this program was proved, it will be established in the structural application of health deputy (units of non-communicable diseases).
Study limitations: this study was a combination of the qualitative and quantitative research, using more than 1 method to combine the strengths of the 2 method types to produce a more nuanced understanding of the topic at hand allowing planners to increase the validity of their findings as well as covering weakness of the qualitative and quantitative study. However, using a combination of methods is not simple, to collect and analyzed qualitative and quantitative data simultaneous time and financial recourse are need. Variation in sampling was an advantage of the current study. Participants of the study belonged to different socio-economical backgrounds, were of various degrees of CVD risk factors, and were of both genders, as well as variety of ages, it increase the applicability of findings. A lengthy and time consuming step of IM was also one of the limitations of this study, therefore the researcher in this study was limited to only design programs.
Suggestions: the developed programs could be implemented if effectiveness of this program was demonstrated; they established it in the structural application of health deputy of ministry (units of non-communicable diseases). Furthermore, we suggest that the systematic programs such as IM were used to control the different health problems.