
1. Background
Marriage is considered one of the most crucial decisions in every person’s life; in other words, a successful marriage enhances physical, mental, social, and spiritual health (1). Marital satisfaction plays a key role in the stability of couples’ relationships and affects quality of life (2). It is a positive and enjoyable attitude experienced by couples from various aspects of marital relations (3). A high level of marital satisfaction increases adjustment ability and life expectancy, while decreasing the risk of mental disorders (2). This important concept of marital satisfaction, with its multidimensional structure and significant role in maintaining and strengthening the family foundation, is influenced by various factors (4), including emotional intelligence (5), sexual self-efficacy (6), fertility and infertility (7), communication and interaction factors (8), work-family conflicts (9), attachment styles (5), and social cognition (10).
Attachment can effectively predict marital satisfaction (11). The concept of attachment was first introduced by Bowlby, who defined attachment as a strong emotional bond between an infant and the primary caregiver during the first year after birth (12). According to attachment theory, when individuals develop a marital relationship, they seek an attachment figure — a person to whom they are emotionally close and with whom they feel safe. This theory posits that people’s attachment needs and sense of security are fulfilled through a successful marriage (13). According to Bartholomew and Horowitz, attachment styles are classified into four categories that can be organized along specific dimensions reflecting individuals’ representations of their relationships with others (14).
Secure attachment enables individuals to listen to others with higher quality, develop healthier relationships, provide more appropriate feedback during discussions (15), experience greater satisfaction in relationships, resolve conflicts more effectively, meet their partner’s needs more frequently, and enjoy more stable relationships. In contrast, individuals with insecure attachment styles face more negative consequences. For example, those with a fearful attachment style have a strong desire for intimacy yet worry about being abandoned, tend to mistrust their partner, and are prone to jealousy. Individuals with avoidant attachment are generally uncomfortable with closeness, have difficulty trusting others, respond less to their partner’s needs, and show less commitment (16).
Alongside attachment styles, social cognition is recognized as an influential component of marital satisfaction. Social cognition is a multidimensional construct encompassing the ability to understand, identify, and interpret information from the social world (17). Its primary elements include emotion perception and recognition, theory of mind, and attribution styles (18). Theory of mind, or mind reading, is an essential social cognitive skill involving the understanding of others’ mental states — thoughts, feelings, and desires (19). Emotional recognition refers to the ability to recognize and differentiate others’ emotional states, mainly through facial expressions (17). Impairments in these abilities can cause significant dysfunction, affecting self-reflection and interpersonal communication (20).
Miller and Steinberg (as cited by deTurk and Miller) proposed a theory of interpersonal communication based on the social cognitive tendencies of relationship partners, suggesting that the dynamics of marital relationships can be explained by dominant social cognitive processes between spouses (21).
Attachment style plays a decisive role in social cognition. That is, one of the main structures affecting social cognition is how parents respond to a child’s needs during childhood, leading to different attachment styles (22). Abbasi et al. (5) observed a positive association between marital satisfaction and secure attachment style, and a negative association between insecure-avoidant and ambivalent attachment styles and marital satisfaction. However, Mohammadi et al. (23) found no significant correlation between marital satisfaction and secure attachment style, but a significant negative correlation between insecure-avoidant and ambivalent attachment styles.
Regarding the correlation between social cognition and attachment styles, Baradaran and Ranjbar Noushari (22) conducted a study on university students and reported a significant positive relationship between secure attachment style and social cognition, and a significant negative relationship between social cognition and avoidant-ambivalent attachment styles.
According to Monfarednejad and Monadi (10), social cognition is lower among women seeking divorce compared to women in non-divorce contexts. Furthermore, Jennings et al. (24) showed that widowhood is associated with lower cognitive performance in both men and women. Additionally, Yosefi Tabas et al. demonstrated that social cognition training improves interpersonal relationships (25).
Since marital satisfaction can be evaluated in various contexts, further studies are necessary to clarify contradictions and identify variables that increase marital satisfaction. There is limited research on the association between attachment styles, social cognition, and marital satisfaction worldwide, particularly in Iran. Accordingly, such research is needed in Iran to accurately identify ways to enhance marital satisfaction and understand the factors behind increased divorce rates. These findings can mitigate the adverse effects of dissatisfaction and the psychological and family burdens triggered by divorce and related disputes. Attachment styles and individuals’ perception of their social environment — social cognition — are effective factors in marital success; identifying these variables can inform strategies to preserve and promote marriage.
2. Objectives
The present study was conducted to explore the mediating role of social cognition in the relationship between marital satisfaction and attachment styles.
3. Methods
In this descriptive-correlational study employing structural equation modeling, the research sample size was calculated using G*Power 3.1.9.4. A sample size of 189 participants was estimated considering 80% power, an α error probability of 0.05, an effect size of 0.075, and 6 predictor variables (26). Due to a projected attrition rate of 15%, the sample size was increased to 220. Participants were selected using convenience sampling and included married men and women attending the Psychology Clinic at Baharan Hospital in Zahedan, Iran.
The inclusion criteria were: (A) ability to read and write; (B) informed consent to participate; (C) absence of psychotic symptoms and preserved reality contact; (D) absence of severe psychological disorders; and (E) no drug use. The exclusion criterion was incomplete completion of the questionnaires.
After receiving approval from the Research Ethics Committee of Zahedan University of Medical Sciences (IR.ZAUMS.REC.1399.432), participants were informed about the research objectives. In accordance with the Helsinki Declaration (27), voluntary participation was emphasized, and participants were allowed to withdraw at any stage. Confidentiality was assured. Informed consent was obtained. Demographic information (gender, age, marriage duration, education level, and number of children) was collected, followed by administration of the research instruments.
All questionnaires were administered in person under the supervision of the researcher. Participants completed the self-report instruments individually in a quiet room within the psychology clinic. The researcher was present throughout to provide clarification as needed and ensure that all items were understood. Upon completion, the questionnaires were collected immediately to maintain data integrity and confidentiality. This procedure minimized potential response bias and ensured accuracy.
Data analysis was performed using SPSS version 25. Descriptive and analytical statistics (Pearson correlation coefficient, variance analysis, regression analysis, percentage, frequency, mean, and standard deviation) were used, with significance set at P < 0.05. Mediation analysis was conducted with bootstrap sampling to investigate the mediating role of social cognition in the association between attachment styles and marital satisfaction, adjusting for gender and education level. As recommended by Hayes and Preacher, the bootstrap method estimates indirect, direct, and total effects (28). Path estimation was conducted via ordinary least-squares regression using Hayes’ PROCESS macro (SPSS). According to Hayes and Preacher, mediation occurs when the indirect effect is statistically significant and the confidence interval does not contain zero (29).
3.1. ENRICH Marital Satisfaction Questionnaire
The ENRICH Marital Satisfaction Scale (EMS), designed by Olson et al., originally included 12 dimensions and 115 items. Apart from the first dimension, which has five questions, the remaining dimensions each contain ten questions. The questionnaire uses a five-point Likert scale ranging from 1 (“strongly disagree”) to 5 (“strongly agree”). Shorter forms — including a 47-item version — were developed due to the original’s length. In Iran, Soleimanian and Navabinejad (as cited by Abbasi et al.) first reported the internal correlation coefficient of the long and short forms as 0.93 and 0.95, respectively (5). In the present study, Cronbach’s alpha was 0.92, indicating high internal consistency. The total score is the sum of all item scores, with higher scores reflecting greater marital satisfaction.
3.2. Attachment Styles Questionnaire
The Attachment Styles Questionnaire (ASQ), developed by Bartholomew and Horowitz, consists of 24 items assessing four attachment dimensions: Secure, fearful, dismissing, and preoccupied. Each style is measured by six items, rated on a five-point Likert scale from 1 (“strongly disagree”) to 5 (“strongly agree”). The score for each style is the sum of its six items; higher scores indicate a greater tendency toward that attachment pattern. Firoozabadi et al. reported a Cronbach’s alpha of 0.70 for the Persian version, confirming acceptable internal consistency (30).
3.3. Social Cognition
This study used the Reading the Mind in the Eyes Test (RMET) and the Recognition of Emotional Facial Expressions Test to assess social cognition.
3.3.1. Reading the Mind in the Eyes Test
Originally developed by Baron-Cohen, the RMET evaluates theory of mind or mind reading ability. It consists of 36 images showing only the eye region of faces. For each image, four descriptive words are provided, and participants must select the best description of what the person in the image is thinking or feeling. Each correct answer earns one point, and the total score equals the number of correct items. Higher scores reflect stronger mind reading and social cognition abilities. Zabihzadeh et al. reported a Cronbach’s alpha of 0.72 and a test-retest reliability of 0.61 over two weeks for the Persian version (31).
3.3.2. Recognition of Emotional Facial Expressions Test
The Recognition of Emotional Facial Expressions Test, developed by Akman, assesses the ability to identify facial emotions. The test presents 14 images from Akman’s validated collection, each depicting one of six basic emotions (sadness, happiness, anger, fear, disgust, and surprise). Participants choose the emotion label that best matches the facial expression. Each correct answer receives one point, and the total score is the sum of correct responses. Higher total scores indicate greater accuracy and stronger emotion recognition skills. Ghasempour et al. reported a Cronbach’s alpha of 0.71, indicating acceptable internal consistency (32).
4. Results
A total of 220 participants [153 women (69.5%) and 67 men (30.5%)] completed the study, with a mean age of 34.91 ± 8.36 years. Most participants held a bachelor's degree (41.8%) (Table 1).
Table 1.
Socio-demographic Information of the Participants (N = 220) a
| Variables and Categories | Values |
|---|---|
| Age | 8.36 ± 34.91 |
| Gender | |
| Male | 67 (30.5) |
| Female | 153 (69.5) |
| Education level | |
| Fifth grade | 17 (7.7) |
| Third grade middle school | 16 (7.3) |
| Diploma | 53 (24.1) |
| Bachelor’s degree | 92 (41.8) |
| Master | 35 (15.9) |
| Doctoral | 7 (3.2) |
| Duration of marriage (y) | |
| 1 - 5 | 76 (34.5) |
| 6 - 8 | 28 (12.7) |
| 9 - 10 | 25 (11.4) |
| ≥ 11 | 91 (41.4) |
| Number of children | 1.49 ± 1.18 |
a Values are expressed as No. (%) or mean ± SD.
As shown in Table 2, marital satisfaction had a significant positive association with secure attachment style (r = 0.48, P < 0.001) and social cognition (r = 0.53, P < 0.001). Marital satisfaction also showed significant negative associations with preoccupied (r = -0.53, P < 0.001), fearful (r = -0.56, P < 0.001), and dismissing attachment styles (r = -0.42, P < 0.001). Thus, marital satisfaction increases with higher secure attachment and social cognition scores and decreases with higher fearful and dismissing attachment scores. No significant correlations were observed between marital satisfaction and age, marriage duration, or number of children (Table 2).
Table 2.
Correlation Matrix of Study Variables (N = 220) a
| Variables | 1 | 2 | 3 | 4 | 5 | 6 | 7 | 8 | 9 | 10 | 11 |
|---|---|---|---|---|---|---|---|---|---|---|---|
| Age | - | ||||||||||
| Gender | 0.073 | - | |||||||||
| Education level | 0.137 b | 0.253 b | - | ||||||||
| Duration of marriage | 0.687 c, d | 0.295 c | -0.180 e, f | - | |||||||
| Number of children | 0.512 c, d | 0.051 | -0.316 c, f | 0.716 c, d | - | ||||||
| Secure attachment style | 0.048 d | 0.216 e | 0.246 c, f | -0.182 e, d | -0.010 d | - | |||||
| Preoccupied attachment style | -0.025 d | -0.197 e | -0.244 c, f | 0.172 b, d | 0.060 d | -0.385 c, d | - | ||||
| Fearful attachment style | -0.127 d | -0.249 c, d | -0.199 e, f | 0.027 d | 0.011 d | -0.473 c, d | 0.699 c,d | - | |||
| Dismissing attachment style | -0.120 d | -0.279 c | -0.135 b, f | 0.098 d | -0.060 d | -0.464 c, d | 0.692 c, d | 0.658 c, d | - | ||
| Social cognition | -0.007 d | 0.218 e | 0.286 c, f | -0.286 c, d | -0.138 b, d | 0.465 c, d | -0.546 c, d | -0.600 c, d | -0.603 c, d | - | |
| Marital satisfaction | 0.045 d | 0.222 e | 0.226 e, f | -0.120 d | -0.041 d | 0.480 c, d | -0.539 c, d | -0.567 c, d | -0.427 c, d | 0.539 c, d | - |
a Correlation between study variables was done by point bivariate correlation coefficient, Spearman's rank correlation coefficient, Pearson's correlation coefficient, and V-Kramer's test.
b P < 0.05.
c P < 0.001.
d Pearson correlation.
e P < 0.01.
f Spearman correlation.
According to Table 3, hierarchical linear regression showed that in the first stage, gender (β = 0.199, P < 0.01) and education level (β = 0.233, P < 0.01) contributed significantly to marital satisfaction (R2 = 0.103; model 1). Adding preoccupied (β = -0.393, P < 0.01), fearful (β = -0.258, P < 0.01), and dismissing (β = -0.103, P < 0.01) attachment styles in subsequent models (models 3, 4, and 5) resulted in marked variance changes (ΔR2 = 0.127, P < 0.001; ΔR2 = 0.030, P < 0.001; ΔR2 = 0.005, P < 0.001, respectively). Finally, adding social cognition (model 6) showed that social cognition significantly contributed to increased marital satisfaction [β = 0.236, P < 0.01; R2 = 0.453, P < 0.001; F(7, 212) = 25.116].
Table 3.
Summary of Hierarchical Multiple Linear Regression Analysis Model to Investigate Factors Related to Marital Satisfaction (N = 220)
| Predictor Variables | B | SE | β | t | 95% Confidence Interval | |
|---|---|---|---|---|---|---|
| Upper Bound | Lower Bound | |||||
| Model 1: R2 = 0.103, F(2,217) = 12.487 a | ||||||
| Gender | 12.62 | 3.912 | 0.199 | 3.84 b | 19.771 | 4.352 |
| Education level | 5.583 | 1.545 | 0.233 | 3.613 a | 8.629 | 2.538 |
| Model 2: ∆R2 = 0.159, ∆F(1,216) = 46.682 a , R2 = 0.263, F(3,216) = 25.638 a | ||||||
| Gender | 7.135 | 3.628 | 0.118 | 1.967 | 14.285 | 0.015 |
| Education level | 3.286 | 1.444 | 0.137 | 2.275 c | 6.132 | 0.439 |
| Secure attachment style | 2.838 | 0.415 | 0.420 | 6.832 a | 3.657 | 2.019 |
| Model 3: ∆R2 = 0.127, ∆F(1,215) = 44.556 a , R2 = 0.389, F(4,215) = 34.245 a | ||||||
| Gender | 4.440 | 3.334 | 0.073 | 1.332 | 11.012 | 2.131 |
| Education level | 1.963 | 1.332 | 0.082 | 1.473 | 4.588 | 0.663 |
| Secure attachment style | 1.973 | 0.400 | 0.292 | 4.927 a | 2.762 | 1.184 |
| Preoccupied attachment style | 2.182 | 0.327 | 0.393 | 6.675 a | 1.538 | 2.827 |
| Model 4: ∆R2 = 0.030, ∆F(1,214) = 11.180 b , R2 = 0.419, F(5,214) = 30.929 a | ||||||
| Gender | 3.148 | 3.280 | 0.052 | 0.960 | 9.402 | -3.318 |
| Education level | 1.835 | 1.302 | 0.077 | 1.409 | 4.402 | -0.732 |
| Secure attachment style | 1.588 | 0.408 | 0.235 | 3.892 a | 2.392 | 0.784 |
| Preoccupied attachment style | 1.334 | 0.408 | 0.240 | 3.268 a | -0.529 | -2.138 |
| Fearful attachment style | 1.392 | 0.416 | 0.258 | 3.344 a | -0.571 | -2.213 |
| Model 5: ∆R2 = 0.005, ∆F(1,213) = 1.697 c , R2 = 0.424, F(6,213) = 26.141 a | ||||||
| Gender | 3.755 | 3.308 | 0.062 | 1.135 | 10.275 | -2.766 |
| Education level | 1.693 | 1.305 | 0.071 | 1.297 | 4.265 | -0.879 |
| Secure attachment style | 1.703 | 0.417 | 0.252 | 4.086 a | 2.524 | 0.881 |
| Preoccupied attachment style | -1.586 | 0.451 | -0.286 | -3.516 b | -0.697 | -2.476 |
| Fearful attachment style | -1.538 | 0.430 | -0.285 | -3.572 a | -0.689 | -2.386 |
| Dismissing attachment style | -0.485 | 0.372 | -0.103 | -1.303 | -0.249 | -1.219 |
| Model 6: ∆R2 = 0.029, ∆F(1,212) = 11.347 b , R2 = 0.453, F(7,212) = 25.116 a | ||||||
| Gender | 3.543 | 3.231 | 0.059 | 1.097 | 9.912 | -2.826 |
| Education level | 1.052 | 1.288 | 0.044 | 0.816 | 3.591 | -1.488 |
| Secure attachment style | 1.467 | 0.413 | 0.217 | 3.552 a | 2.281 | 0.653 |
| Preoccupied attachment style | -1.478 | 0.442 | -0.266 | -3.345 b | -0.607 | -2.349 |
| Fearful attachment style | -1.215 | 0.431 | -0.225 | -2.819 b | -0.365 | -2.065 |
| Dismissing attachment style | -0.804 | 0.376 | -0.171 | -2.140 c | -0.063 | -1.545 |
| Social cognition | 0.773 | 0.229 | 0.236 | 3.369 b | 1.225 | 0.321 |
a P < 0.001.
b P < 0.01.
c P < 0.05.
Mediation analysis was conducted using SPSS with the Hayes PROCESS tool (model 4, bootstrap sample = 5,000). Figure 1 presents the structural equation model illustrating the mediating role of social cognition in the relationship between attachment styles and marital satisfaction. Secure attachment exerted a significant positive indirect effect on marital satisfaction through social cognition (b = 1.01, 95% CI: 0.56, 1.58), while preoccupied (b = -0.86, 95% CI: -1.36, -0.44), fearful (b = -0.84, 95% CI: -1.37, -0.39), and dismissing attachment styles (b = -1.06, 95% CI: -1.56, -0.62) showed significant negative indirect effects (P < 0.001). Notably, the direct effect of dismissing attachment on marital satisfaction was non-significant, indicating full mediation through social cognition. Overall, the model demonstrated satisfactory fit and confirmed the hypothesized framework (Figure 1).
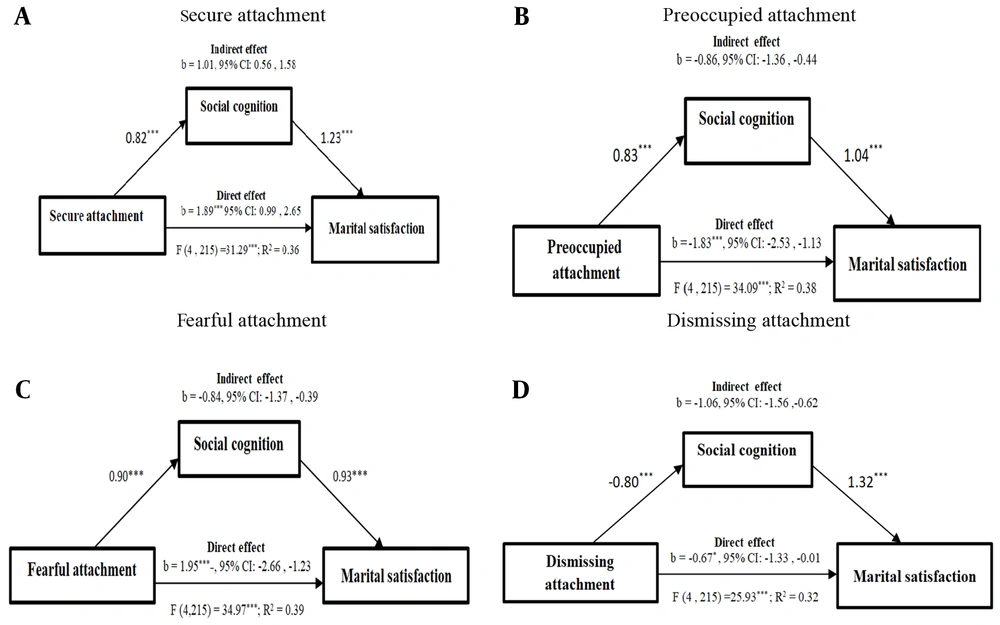
Figure 1.
The results of the mediation analysis described in the text, which investigated the mediating role of social cognition in the association between attachment styles (secure, preoccupied, fearful, and dismissing) and marital satisfaction, controlling for the effect of education and sex (* P < 0.05; ** P < 0.01; *** P < 0.001).
5. Discussion
Empirical evidence indicates that psychological resources and mental health significantly contribute to marital satisfaction. Moreover, overall quality of life is meaningfully correlated with marital satisfaction, highlighting the interconnection between mental well-being and relationship outcomes.
The present results showed a positive and significant correlation between secure attachment style and marital satisfaction/social cognition, consistent with the findings of Mardani et al. (33), Abbasi et al. (5), Shaker et al. (34), and Baradaran and Ranjbar Noushari (22). Individuals with secure attachment are more satisfied in their adult relationships, likely due to positive childhood experiences with their parents. They are more confident in their spouse’s support, stemming from past experiences of support during difficult situations (16, 35, 36). Secure attachment enables individuals to better understand themselves and their environment and to provide more adaptive responses (22). Such individuals are less likely to experience excessive negative emotions when facing difficulties, allowing them to regulate emotions effectively and understand their partner’s needs through constructive communication, thereby fostering greater marital satisfaction and relationship stability.
A negative and significant correlation was found between insecure attachment styles (preoccupied, fearful, and dismissing) and both marital satisfaction and social cognition, aligning with the findings of Mardani et al. (33), Abbasi et al. (5), Mohammadi et al. (23), and Baradaran and Ranjbar Noushari (22). Individuals with a fearful attachment style worry about abandonment and tend to mistrust their partner. Those with avoidant attachment are uncomfortable with closeness, reject intimacy, seek solitude, and are less responsive to their partner’s needs (16). People with preoccupied attachment, due to negative self-representation and positive representation of others, engage in anxiety-driven efforts to please others, which occasionally leads to better marital adjustment than the other two insecure styles, but without genuine satisfaction (34). Thus, individuals with insecure attachment styles tend to be more conservative in relationships and less likely to have a positive attitude toward romantic experiences, resulting in lower marital satisfaction.
Furthermore, the relationship between attachment style and social cognition indicates that attachment patterns are reliable predictors of differences in psychological dimensions and social cognition (22). For example, those with insecure attachment often experience a lack of trust and attachment in childhood, receiving insufficient guidance on social issues and empathy, resulting in poor cognitive information and lower social cognition in adulthood. Consistent with this, Gresham and Gullone showed that parental attachment influences future interactions, and that attachment style reliably predicts differences in social cognition (37).
Regression analysis revealed a significant correlation between social cognition and marital satisfaction, indicating that increased social cognition is associated with greater marital satisfaction. This finding corroborates Mofradnejad and Monadi (10), who found that divorce-seeking women had lower social recognition. Jennings et al. (24) also reported that widowhood or single status is associated with lower cognitive functioning. Social cognition, as an individual’s perception of the social environment, is critical in relationships and is thus linked to marital satisfaction.
A notable finding is the nonsignificant direct effect of dismissive attachment style, alongside a significant indirect path through social cognition, indicating full mediation. This suggests that the impact of dismissive attachment on marital satisfaction operates primarily through cognitive mechanisms in social cognition. The structural equation model (Figure 1) confirmed the mediating role of social cognition between attachment styles and marital satisfaction. The full mediation observed for dismissing attachment suggests that individuals with avoidant tendencies experience lower marital satisfaction primarily due to deficits in understanding and responding to their partner’s emotions. This underscores cognitive-emotional processing as a crucial mechanism linking attachment patterns to relationship quality. Enhancing social cognitive abilities may buffer the negative effects of insecure attachment and promote healthier, more resilient marital interactions.
Finally, no significant correlation was found between demographic variables and marital satisfaction in our study, supporting Masoomi et al. (38), but contrasting with Jose and Alfons (39). This discrepancy may be due to the limited geographical sampling and cultural expectations.
5.1. Conclusions
This study demonstrated that social cognition mediates the association between attachment style and marital satisfaction. Early-formed attachment patterns continue to influence how individuals perceive and respond to their partners, shaping emotional connection and relationship quality. Enhanced social cognitive abilities — such as emotion recognition and theory of mind — facilitate mutual understanding, effective communication, and adaptive conflict resolution. These findings highlight the importance of targeting both attachment security and social cognition in preventive and therapeutic interventions. Integrating these elements into premarital counseling and couple therapy may strengthen emotional attunement, build relational resilience, and serve as an evidence-based approach to preventing marital dissatisfaction and conflict. Future research in diverse cultural and demographic contexts is recommended to confirm and expand these results.
5.2. Limitations
This study has several limitations. First, the overrepresentation of female participants may limit generalizability to male populations. Second, the sample was drawn from a geographically restricted area with distinct cultural characteristics, which further constrains the external validity of the results.