
1. Background
Hepatic fibrosis is an integral stage in the development of chronic liver disease and often leads to liver cirrhosis. It can also be associated with hepatocellular carcinoma (HCC) and liver failure (1). Therefore, it is important to identify new anti-fibrotic agents that prevent the progression of liver fibrosis.
In the process of hepatic fibrogenesis, the activation of hepatic stellate cells (HSC) plays an essential role (2, 3). Once HSCs are activated by growth factors (PDGF), inflammatory cytokines (IL1β and TNFα), chemokines, and oxidative stress products, they actively produce extracellular matrix components and collagen deposition in the liver (4). Among the activators of HSCs, transforming growth factor-β (TGF-β) plays a major role. As known, TGF-β is a major profibrotic cytokine in the liver that increases the expression of type 1 collagen and excessive accumulation of extracellular matrix by further activating liver stellate cells and converting them to myofibroblasts (5). The signaling pathway activated by TGF-β is mediated by its type 1 receptor. At the cellular level, TGF-β has two types of membrane width receptors, types 1 and 2 (TβRI and TβRII), with serine-threonine kinase activity. Following TGF-β binding to TβRII, this receptor phosphorylates and activates TβRI, which, in turn, phosphorylates Smad2/3 (Rsmad) at specific serine residues in their C-terminal region (6). This phosphorylation enables Smad2/3 to bind to Smad4 (Co-Smad) to form the heteromeric Smad complex, which eventually enters the nucleus to transcribe genes such as extracellular matrix proteins (7, 8). It has been suggested that blocking the TGF-β signaling pathway by inhibiting Smad2/3 phosphorylation attenuates fibrogenesis with minimal side effects in several animal models. Therefore, blockers of the TGF-β/Smad3 signaling pathway can prevent the activation of HSCs and reduce hepatic fibrogenesis (9).
Fibroblast growth factor 21 (FGF21) is a secreted hormone mainly expressed in the liver. Studies have shown that FGF21 is an important regulator of metabolism with pleiotropic effects on glucose and lipid homeostasis (10, 11). The administration of recombinant FGF21 in animal models has provided beneficial effects, including reducing fat mass, insulin resistance, dyslipidemia, fatty liver, and protection against hepatotoxicity (12). However, the potential of FGF21 to protect against liver fibrosis has not been fully evaluated. In this study, we investigated the ability of FGF21 to reduce hepatic fibrogenesis induced by free cholesterol accumulation in the LX2 cell line and its mechanism of action.
2. Objectives
Here we examine the beneficial effects of FGF21 to reduce hepatic fibrogenesis induced by free cholesterol accumulation in the LX2 cell line and its mechanism of action.
3. Methods
3.1. Cell Culture and Treatments
Cholesterol was purchased from Sigma (Sigma-Aldrich, USA) and fetal bovine serum (FBS), DMEM (Dulbecco's Modified Eagle Medium), and penicillin and streptomycin antibiotics from Sigma (Sigma-Aldrich, USA). As an HSC line, LX2 cells were kindly provided by Scott Friedman (Mount Sinai Hospital, New York, NY, USA) (13). Cells were cultured in DMEM containing 5% FBS, 100 IU/mL penicillin, and 100 μg/mL streptomycin in a humidified atmosphere of 5% CO2: 95% air at 37°C. Cells were seeded in 12-well plates at a density of 1.0 × 10⁶ cells/mL and were placed in starvation conditions for 24 h. Then, the cells were treated with 25, 50, 75, and 100 μM concentrations of cholesterol for 24 and 48 h, followed by FGF21 treatment (1.0 μM in culture medium) for 24 h. We considered three treatment groups, including the control group that received the vehicle, the cholesterol treatment group, and the third group treated with cholesterol plus FGF21. After the incubation time elapsed, cells were washed twice with PBS and harvested for qPCR and Western blot analysis.
3.2. MTT Assay
The MTT assay was performed to investigate the effect of different concentrations of cholesterol on the survival of LX2 cells. The LX2 cells were cultured at 5,000 cells/well in a 96-well plate and after 24 hours, treated with 25, 50, 75, 100, 125, and 150 μM (13) cholesterol for 24, 48, and 72 h in a CO2 incubator at 37°C. The incubation media were changed, MTT was added at a concentration of 0.5 mg/mL to the wells and incubated for four hours. Then, the MTT-containing medium was removed, and after adding 100 μL of DMSO to the wells, the absorbance of the samples was determined at 595 nm.
3.3. Real-Time PCR
After treatments were done, RNA isolation was carried out using an RNeasy kit (Qiagen, Germany). The quality of the extracted RNA was evaluated by reading the OD values at 260 to 280 nm. The cDNA synthesis was then performed using the kit (Yekta Tajhiz, Iran). To detect the gene expression of TGF-β, αSMA, and collagen 1α, the real-time PCR was conducted using RealQ plus Master Mix Green "low Rox" kit (Ampliqon, Denmark) and QuantStudio™ 3 Real-Time PCR System (ABI Applied Biosystems) following the manufacturer’s instructions. The relative expression of each target gene was determined using GAPDH as the internal control. Primers for real-time amplification were as follow: (1) TGF-β: forward 5'-GTGGACATCAACGGGTTCACT- 3', reverse: 5'- CTCCGTGGAGCTGAAGCAATA - 3'; (2) αSMA: forward 5'-CCGGGACTAAGACGGGAATC- 3', reverse 5'-CCATCACCCCCTGATGTCTG-3'; (3) Collagen 1α: forward 5'-GGAATGAAGGGACACAGAGGTT- 3' , reverse 5'-AGTAGCACCATCATTTCCACGA- 3'; (4) GAPDH: forward 5'- GACAGTCAGCCGCATCTTCT - 3', reverse 5’-GCCCAATACGACCAAATCCGT-3’.
3.4. Western Blotting
For western blotting analysis, the cells were placed on ice and were lysed in the presence of RIPA buffer containing protease inhibitors (Sigma Aldrich) to extract the total protein. The total protein concentration was determined using the BCA method. Then, 30 μg protein per well was run on 10% SDS-polyacrylamide Gel Electrophoresis (PAGE). Electrophoresis was performed under 130 volts for 1.5 h, followed by electroblotting of proteins from the gel to a PVDF membrane (Millipore, USA) at the voltage of 100 V for two hours at 4°C (14). After blotting, the membrane was blocked for two hours at room temperature in 5% skimmed milk or bovine serum albumin (BSA) (for phosphorylated proteins) in Tris buffer containing 0.1% Tween (TBST). The primary antibody (1: 1000) was incubated overnight at 4°C. The membrane was then washed three times in TBST and incubated with the secondary antibody (1: 10000).
Finally, the protein bands visualized by an ECL kit (Abcam, United Kingdom), band detection was conducted on a ChemiDoc device. Image J software was used for band analysis and relative protein quantification.
3.5. Statistical Analysis
The data are presented as the mean ± SEM of three replicates and were analyzed using the ANOVA and Tukey Honestly Significant Difference (HSD) post hoc test using the GraphPad Prism 9 software. The significance level was considered at P < 0.05.
4. Results
4.1. Cytotoxicity of Cholesterol Doses on HSCs
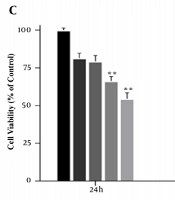
The MTT assay was performed to achieve the appropriate concentration of cholesterol for cell treatment. Cells were first treated with concentrations of 25, 50, 75, 100, 125, and 150 μM cholesterol for 24 h. At the concentration of 125 μM cholesterol, cell survival was significantly reduced compared to the control group (P < 0.001, Figure 1A and B). Therefore, concentrations lower than the IC50 were used to study gene expression. In addition, to obtain the optimal treatment time of the cells, the MTT test was performed for up to 72 h with concentrations of 25, 50, 75, and 100 μM of cholesterol. The results showed that after 72 h treatment, cell viability was significantly reduced. Therefore, cells were treated for 24 and 48 h for cholesterol preconditioning (Figure 1C).

Figure 1.
A, B, effect of different concentrations of cholesterol on the survival of LX2 cells; C, MTT assay results showing cell viability under different cholesterol concentrations over 24 h. MTT assay showing time-dependent cell viability under different cholesterol concentrations over 72 h. Results are shown as mean ± SEM. Statistical analysis was performed by one-way ANOVA and Tukey test using GraphPad Prism 9 software (** P < 0.01, *** P < 0.001).
4.2. Effects of Cholesterol and FGF21 Treatments on Gene Expression
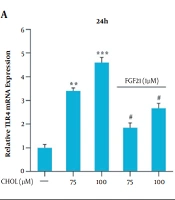
Gene expression analysis was performed in response to 25, 50, 75, and 100 μM cholesterol treatment for 24 and 48 h and further with FGF21 for 24 h. Following 24 and 48 h treatment with cholesterol at the concentrations of 75 and 100 μM, the gene expression level of TGF-β, αSMA, and collagen 1α increased significantly compared to the control group (Figures 2, 3, 4A and B). We also found that the FGF21 treatment significantly attenuated the increased TGF-β, αSMA, and collagen 1α gene expression in response to cholesterol following 24 and 48 h treatment (Figures 2, 3, 4C and D).

Figure 2.
TGF-β mRNA expression in the presence of cholesterol and FGF21 in the LX2 cell line. A, relative TGF-β mRNA expression in the presence of different concentrations of cholesterol for 24 h; B, relative TGF-β mRNA expression in the presence of different concentrations of cholesterol for 48 h; C, relative TGF-β mRNA expression in cholesterol-treated cells with or without FGF21 treatment for 24 h; D, relative TGF-β mRNA expression in cholesterol-treated cells with or without FGF21 treatment for 48 h. Results are the mean ± SEM of three replicates and expressed as fold changes in TGF-β mRNA expression compared to the control group. GAPDH was used as the reference gene (* P < 0.05 vs. vehicle-treated control, ** P < 0.01 vs. vehicle-treated control, # P < 0.05 vs. cholesterol alone).

Figure 3.
αSMA mRNA expression in the presence of cholesterol and FGF21 in the LX2 cell line. A, relative αSMA mRNA expression in the presence of different concentrations of cholesterol for 24 h; B, relative αSMA mRNA expression in the presence of different concentrations of cholesterol for 48 h; C, relative αSMA mRNA expression in cholesterol-treated cells with or without FGF21 treatment for 24 h; D, relative αSMA mRNA expression in cholesterol-treated cells with or without FGF21 treatment for 48 h. Results are the mean ± SEM of three replicates and expressed as fold changes in SMA mRNA expression compared to the control group. GAPDH was used as the reference gene (** P < 0.01 vs. vehicle-treated control, *** P < 0.001 vs. vehicle-treated control, # P < 0.05 vs. cholesterol alone, ## P < 0.01 vs. cholesterol alone).

Figure 4.
Collagen 1α (COLA1) mRNA expression in the presence of cholesterol and FGF21 in the LX2 cell line. A, relative COLA1 mRNA expression in the presence of different concentrations of cholesterol for 24 h; B, relative COLA1 mRNA expression in the presence of different concentrations of cholesterol for 48 h; C, relative COLA1 mRNA expression in cholesterol-treated cells with or without FGF21 treatment for 24 h; D, relative COLA1 mRNA expression in cholesterol-treated cells with or without FGF21 treatment for 48 h. Results are the mean ± SEM of three replicates and expressed as fold changes in COLA1 mRNA expression compared to the control group. GAPDH was used as the reference gene (** P < 0.01 vs. vehicle-treated control, *** P < 0.001 vs. vehicle-treated control, # P < 0.05 vs. cholesterol alone, ## P < 0.01 vs. cholesterol alone).
4.3. Effects of Cholesterol and FGF21 Treatments on Smad3C Phosphorylation
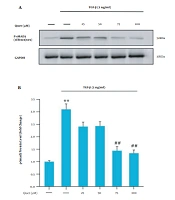
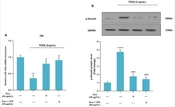
Smad3C phosphorylation was evaluated to investigate the TGF-β/Smad3C signaling pathway in HSCs in response to treatments. First, to achieve the best time to assess the Smad3C protein level, the western blotting technique was performed after different periods. It was observed that four hours after cholesterol treatment (final concentration of 100 μM), the highest level of Smad3C protein was obtained. Therefore, as shown in Figure 5A and B, the Smad3C protein level was measured at this time point following cholesterol and FGF21 challenges. Western blot results showed that cholesterol treatment significantly induced the Smad3C phosphorylation in HSCs compared to the control group (Figure 6). Subsequent FGF21 treatment downregulated the increased Smad3C phosphorylation in response to cholesterol.

Figure 5.
A, western blot analysis of Smad3C expression in LX-2 cells. Effect of different incubation times of cholesterol-induced Smad3C phosphorylation in LX2 cell line; the cell lysates were immunoblotted; B, the relative Smad3C level. The relative Smad3C level was expressed as the ratio of Smad3C/GAPDH. The bands were analyzed with ImageJ software. The data were performed using a one-way analysis of variance (ANOVA), followed by Tukey's test. Data represent the mean ± SEM of three replicates; ** P < 0.01 vs. vehicle-treated controls.

Figure 6.
A, western blot analysis of Smad3C expression in LX-2 cells. LX-2 cells were treated with 1 μM FGF21 for 4 h before being incubated with cholesterol for 4 h; the cell lysates were immunoblotted; B, the relative Smad3C level. The relative Smad3C level was expressed as the ratio of Smad3C/GAPDH. The bands were analyzed with ImageJ software. The data were performed using a one-way analysis of variance (ANOVA), followed by Tukey's test. Data represent the mean ± SEM of three replicates; ** P < 0.01 vs. vehicle-treated control, # P < 0. 05 vs. cholesterol alone.
5. Discussion
The current study demonstrated that cholesterol treatment of human stellate cells, LX-2 cells, activates and transforms these cells to the fibrotic phenotype through TGF-β/Smad3C signaling and FGF21 can reverse changes in the activity and phenotype of LX-2 cells.
Hepatic fibrosis due to hepatocyte damage is one of the leading causes of death in chronic liver disease (14). In the process of progression of hepatic fibrosis, activated HSCs play a key role as the main source of abundant ECM production in the liver (15, 16). These activated HSCs are important cellular sources for TGF-β that is one of the most important fibrotic factors in the liver. The binding of activated TGF-β to its transmembrane receptors leads to Smad2/3 phosphorylation, which, in turn, forms a complex with Smad4 to activate TGF-β target genes (e.g., αSMA and collagen 1α) in the nucleus. The TGF-β target genes include collagen 1α and αSMA (17).
Among activating agents, studies have shown the accumulation of free cholesterol in HSCs activates them and enhances liver fibrosis (18). Although the direct role of cholesterol in liver stellate cells’ activation is not very clear, an important study revealed that cholesterol accumulation in HSCs exacerbates fibrosis through Toll-like receptor 4 signaling activation (19). In parallel with this evidence, in the present study, the treatment of LX-2 cells with cholesterol induced the expression of TGF-β and its target gene, αSMA, and collagen 1α, through TGF-β/Smad3C signaling. Here, TGF-β via autocrine may affect LX-2 activity and lead to the transition of these cells to the fibrotic phenotype. The increase in α-SMA is commonly used as an early marker of fibrosis.
As known, TGF-β/Smad3C signaling promotes liver fibrosis, and thus, the suppression of this signaling pathway may improve liver fibrosis (20). Currently, the lack of effective anti-fibrotic drugs in the prevention and treatment of liver fibrosis is a major global problem. Therefore, many efforts are being made to introduce safe and effective anti-fibrotic agents.
HSC activation have a central role in the development of liver fibrosis. FGF-21 may have beneficial metabolic effects on liver fibrosis.
In this study, we investigated whether FGF21 could prevent the progression of fibrosis in LX-2 human stellate cells. Our study showed that FGF21 treatment ameliorated cholesterol-induced LX-2 fibrotic phenotype. We found that FGF-21 administration effectively decreased the expression of TGF-β, αSMA, and collagen 1α, and also reduced the level of phosphorylated Smad3C protein in cholesterol-treated liver stellate cells. These results suggest that FGF21 alleviates cholesterol-induced HSC activation via inhibiting the TGF-β/Smad3C signaling pathway.
In this study, we showed a direct effect of cholesterol on HSC activation while in the context of fatty liver, cholesterol accumulation in other hepatic resident cells such as hepatocytes can trigger HSC activation. However, the interactions of other liver resident cells with HSCs and the properties of the microenvironment not only influence HSC phenotype but also affect therapeutic response. Consequently, the modulation of HSC activation by FGF21 needs to be addressed in the context of all liver resident cell types. Also, the observed changes in the expression of fibrogenic genes collagen α1 and α-SMA by FGF21 treatment indicated the reversion of activated HSCs to a quiescent phenotype. However, the influence of FGF21 on the expression of distinct genes for quiescent HSCs also needs to be evaluated in cholesterol-treated liver stellate cells.
5.1. Conclusions
In summary, treatment with FGF21 inhibits the activation of HSCs in vitro. The underlying mechanism is suggested to be through the inhibition of the TGF-β/Smad3C signaling pathway. These results provide evidence that FGF21 can be an attractive agent for the treatment of liver fibrosis.