1. Background
Liver fibrosis is a self-repair process that occurs after various types of chronic liver injury, and it is also a necessary stage in the progression to liver cirrhosis (1). Current studies have confirmed that liver cirrhosis is irreversible, but the stage of liver fibrosis can be reversed. Therefore, the mechanism and clinical study of liver fibrosis have always been the focus of liver disease research (2, 3). The activation of hepatic stellate cells (HSCs) is the central link in the development of liver fibrosis (4). During liver injury, quiescent HSCs can rapidly proliferate and transdifferentiate into myofibroblasts, which manifests as an increase in α-smooth muscle actin (α-SMA) and type I collagen. The occurrence of aerobic glycolysis is one of the important metabolic characteristics in this process (5). Besides, 6-phosphofructo-2-kinase/fructose-2,6-biphosphatase 3 (PFKFB3) is a key allosteric activator of rate-limiting enzymes in glycolysis and can also regulate the production of lactate and the uptake of glucose (6). Because the regulatory function of its catalytic activity is closely related to cell metabolism, it has received increasing attention (7). The PFKFB3 expression is significantly increased in lung fibroblasts and idiopathic pulmonary fibrosis (8), but its role is unclear in HSC activation and liver fibrosis.
2. Objectives
In this study, we investigated the function of PFKFB3 during liver fibrosis and assessed the therapeutic potential of glycolytic inhibition in treating liver fibrosis.
3. Methods
3.1. Cell Line and Main Reagents
The HSC line LX-2 was purchased from the Cell Bank of Type Culture Collection of the Chinese Academy of Sciences (Shanghai). β-Actin, α-SMA, type I collagen (Col-I), and PFKFB3 antibodies were all purchased from Abcam (USA). Carbon tetrachloride (CCl4), peanut oil, OptiPrep reagent, and other reagents were purchased from Sigma Aldrich and Fisher Scientific.
3.2. Animal Model Establishment and Grouping
Healthy male C57BL/6 mice (Shanghai Slack Laboratory Animal Co., Ltd.), 8 - 10 weeks old, weighing 20 ± 3 g, were randomly divided into two groups after two weeks of normal maintenance: control group (Con group) and CCl4 group. The CCl4 group received an intraperitoneal injection of 1.5 µL/g CCl4 (1: 10) diluted with peanut oil to serve as the liver fibrosis model (9). Mice in the control group received an intraperitoneal injection of peanut oil alone. Injections were done three times a week. After fasting overnight at five weeks after model construction, some mice were sacrificed. The other mice in the model group were randomly divided into the PFKFB3 inhibitor treatment group and the control group. The inhibitor group received intraperitoneal injection of 50 µL of dimethyl sulfoxide (DMSO) containing 0.05 mg/g 3-(3-pyridinyl)-1-(4-pyridinyl)-2-propen-1-one (3PO) once a day. The control group was injected with the same amount of DMSO intraperitoneally. All mice were sacrificed in the eighth week. Their liver tissues were taken and fixed with 4% neutral formaldehyde. The intervention measures were approved by the institutional animal care and use committee ((2021)105), and the methods and experimental procedures were carried out following relevant guidelines and regulations.
3.3. Tissue Immunofluorescence
Tissue sections were placed at room temperature for 10 min and then deparaffinized and rehydrated in water, followed by antigen retrieval. After the sections were dried by shaking slightly, a histochemical pen was used to draw a circle around the tissue, and 3 - 5% BSA was added dropwise into the circle, followed by incubation for 30 min. A primary antibody solution prepared according to a specific ratio was added to the slides, followed by overnight incubation at 4°C in a refrigerator. The slides were then washed three times, incubated with FITC-labeled secondary antibody (CK-18) at room temperature for 45 min, and then submitted to DAPI (300 nM) nuclear staining for 1 - 5 min. After washing three times, an anti-fluorescence quencher was added, and the slides were sealed with resin. Images of randomly selected fields were taken under an upright fluorescence microscope (ZEISS Axio vert).
3.4. Western Blot (WB) Analysis
Cell and tissue protein samples were prepared according to the instructions of the RIPA lysis buffer, and the bicinchoninic acid method was used to quantitatively analyze protein samples. The protein samples were separated by 10% Sodium dodecyl sulfate–polyacrylamide gel electrophoresis (SDS-PAGE), and then transferred to poly(vinylidene fluoride) (PVDF) membranes, which were incubated overnight with primary antibodies at 4°C. The next day, the membrane was fully washed, incubated with the secondary antibodies for one hour at room temperature, and then fully washed again, followed by film exposure and development. Glyceraldehyde-3-phosphate dehydrogenase (GAPDH) was used as an internal control.
3.5. Liver Histopathology and Collagen Staining
Hematoxylin-eosin (H&E) staining, Masson staining, and Sirius red staining were performed as instructed by the reagent supplier (Shanghai Qiansheng Biotechnology Co., Ltd.).
3.6. Culture of the Human HSC Line LX-2
Human LX-2 HSCs were cultured in Dulbecco's modified Eagle medium containing 5% fetal bovine serum in a 37°C constant-temperature incubator containing 5% CO2. When the cells reached 80 - 90% confluence, 1 mL of 0.25% trypsin was added, followed by incubation for one minute, and cells were then passaged. Cells in good culture conditions were randomly divided into four groups (three wells for each group): (1) PBS control group; (2) transforming growth factor β1 (TGF-β1) group; (3) TGF-β1/3PO group; and (4) 3PO group. In the PBS group, PBS was added 24 hours before the experiment as a control. The TGF-β1 group and TGF-β1/3PO group were supplemented with TGF-β1 at a final concentration of 2 ng/mL for 24 hours of induced activation. The TGF-β1/3PO group and 3PO group received the inhibitor 3PO eight hours before the experiment as the intervention. Cells and cell culture media were collected at the specified time points to carry out the next step of the experiment.
3.7. Glucose Uptake Test
We used a glucose uptake determination kit (Nanjing Jiancheng Bioengineering Institute, China), following the manufacturer's instructions.
Briefly, the steps of the glucose uptake assay were as follows: (1) culturing cells in a serum-free medium for 24 h; (2) adding 2-DG to cells and incubating; (3) washing cells with PBS to remove exogenous 2-DG; (4) lysing cells with extraction buffer and repeating pipetting; (5) doing thaw lysates and heating; (6) adding the neutralizing buffer; (7) spinning and transferring the supernatant to new tubes; (8) adding supernatants and standards to wells; (9) adding reaction mix A and incubating for one hour at 37ºC; (10) adding the extraction buffer; (11) adding the reaction mix B; and (12) analyzing on the microplate reader.
3.8. Determination of Lactate Level
We used a kit to measure lactate in HSCs (Nanjing Jiancheng Bioengineering Institute, China), following the manufacturer's instructions. Briefly, before the experiment, cells were washed with PBS. The supernatant was extracted by homogenization and centrifugation, and samples, enzyme working solution, and chromogen were added according to the steps, followed by doing whirlpool mix, incubating at 37°C for 10 min, and adding a terminator to terminate the reaction. Specimens were detected by the colorimetric method with the enzyme plate analyzer at 530 nm wavelength and 1 cm optical diameter.
3.9. Determination of Extracellular Acidification Rate
The Extracellular Acidification Rate (ECAR) was measured using the pH-Xtra™ glycolysis test kit of Luxcel Biosciences (Cork, Ireland) following the instructions provided by the supplier (10). Human LX2 HSCs in good conditions were seeded in a 96-well plate at a density of 3 × 10⁴ cells/well, and they were randomly divided into the PBS group and TGF-β1 group. Cells were cultured at 37°C in a 5% CO2 incubator. At 24 hours before the experiment, the TGF-β1 group received 2 ng/mL TGF-β1 growth factor, and the control group received the same amount of PBS. At three hours before the glycolysis test was performed, the cells were cultured in a CO2-free incubator at 37°C and 95% humidity to remove CO2. The fluorescence microplate reader was heated to 37°C before starting the experiment. After preheating, the prepared respiratory buffer was added with pH-Xtra™ reagent at 10 UL per well. Four blank control wells without cells received only detection reagents. The BioTek Synergy 4 multifunctional microplate reader was immediately used to read the plate for more than 90 min to measure time-resolved fluorescence (readings taken once every 2 - 3 min). The ECAR change was calculated based on the decay rate of the fluorescent group detected in real-time.
3.10. Statistical Analysis
We used SPSS 22.0 software to analyze the data of each group. Data are expressed as mean ± standard deviation. Measurement data were analyzed with one-way analysis of variance or Student’s t-test, and count data were analyzed with the rank-sum test or chi-squared test. A P < 0.05 was considered statistically significant. Graphs were drawn in GraphPad Prism (version 5).
4. Results
4.1. PFKFB3 Is Upregulated in the Liver Tissue of CCL4-Induced Liver Fibrosis Mice
Sirius red staining showed that the liver tissue of the model group had many proliferated collagen fibers that extended into the surroundings. In Masson staining, the model group showed blue fibrous collagen deposition, fibrous bridging within the portal area and between the portal area and the central vein area, and obvious liver fibrosis (Figure 1). Immunohistochemical examination showed that the expression of α-SMA and PFKFB3 in the model group was increased significantly (P < 0.05, Figure 1). Tissue immunofluorescence showed that PFKFB3 was significantly upregulated in the liver tissue of the model group, and more importantly, α-SMA also had strong expression in the same areas of significant fibrosis where there was increased PFKFB3 expression (Figure 1).
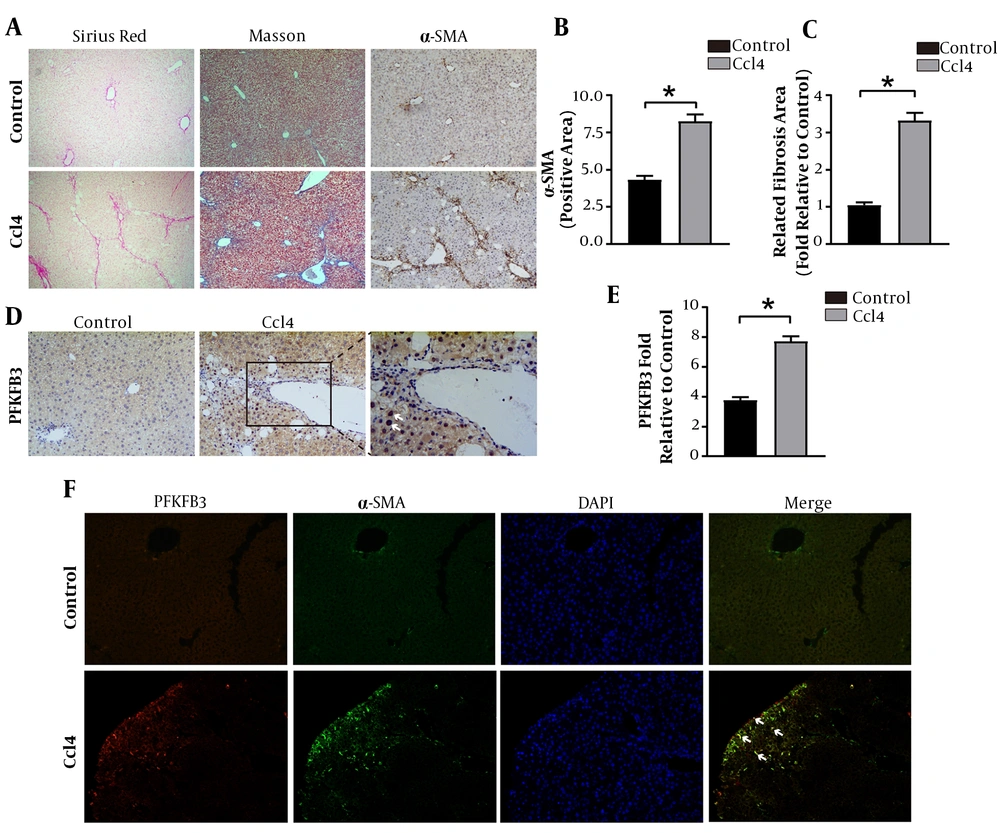
Figure 1.
The expression level of PFKFB3 is correlated with the progression of liver fibrosis. The marker α-SMA protein in the mouse liver fibrosis model. A, mouse liver histopathology by Sirius staining (100X), Masson trichrome staining (100X), and α-SMA immunohistochemistry; B, analysis of positive expression of α-SMA; * P < 0.05 vs. control groups; C, analysis of fibrous collagen deposition in liver fibrotic lesions; D, E, immunohistochemical detection of PFKFB3 in liver fibrotic tissue; * P < 0.05 vs. control groups; F, tissue fluorescence detection of PFKFB3 and α-SMA in liver fibrotic tissue.
4.2. Expression of PFKFB3 Protein and Levels of Glycolytic Metabolites in Liver Tissues of Mice with Liver Fibrosis
The WB detection showed that the expressions of PFKFB3, type I collagen, and HSC activation marker α-SMA were significantly higher in the model group than in the control group (P < 0.05, Figure 2). The lactate was significantly higher in the fibrosis model group than in the normal group (P < 0.05, Figure 2). These findings suggest that glycolysis is involved in the formation of liver fibrosis.
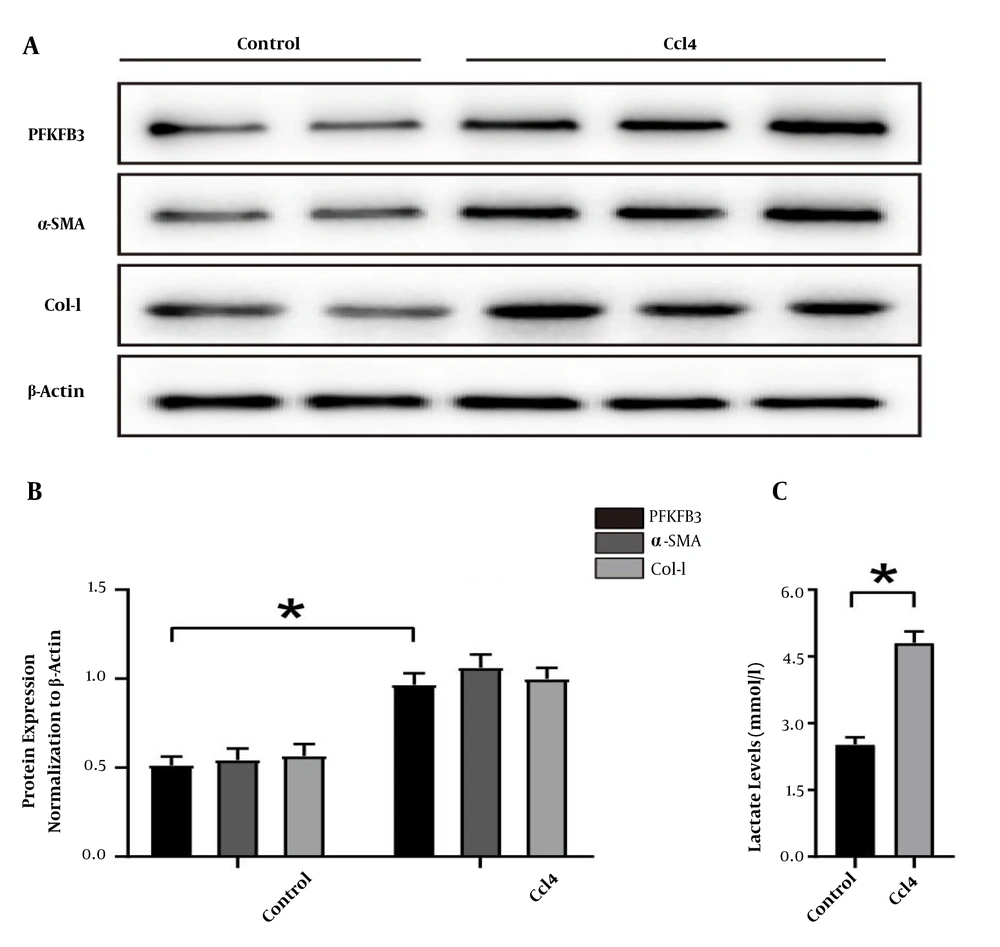
Figure 2.
Changes in the expression of PFKFB3, type I collagen, and α-SMA protein and the levels of glycolytic metabolites in mouse liver tissue. A, WB detection of PFKFB3, type I collagen, and α-SMA in mouse liver tissue, with β-actin as the internal control; B, analysis of the relative expression levels of PFKFB3, type I collagen, and α-SMA protein. * P < 0.05 vs. control groups; C, measurement of lactate in liver tissue; * P < 0.05 vs. control groups.
4.3. PFKFB3 Expression in Activated HSCs (LX-2) Induced By TGF-β1 and Its Role in Aerobic Glycolysis
When glycolysis was upregulated, we clearly detected that the expressions of PFKFB3, type I collagen, and α-SMA significantly increased in activated HSCs than in PBS groups (P < 0.05, Figure 3). Besides, ECAR was used to detect cell acidification rates, and the results were monitored in real-time using a fluorescence microplate reader. As shown in Figure 3C, TGF-β1 stimulation caused a continuous increase in ECAR in HSCs early on, indicating that glycolysis was enhanced in these cells after induction and activation. To confirm the changes in aerobic glycolysis in these HSCs, we also measured lactate to be significantly increased in TGF-β1 groups compared to PBS groups (P < 0.05, Figure 3). Consistent with the results of enhanced glycolysis, activated HSCs also showed stronger glucose uptake ability (P < 0.05, Figure 3).
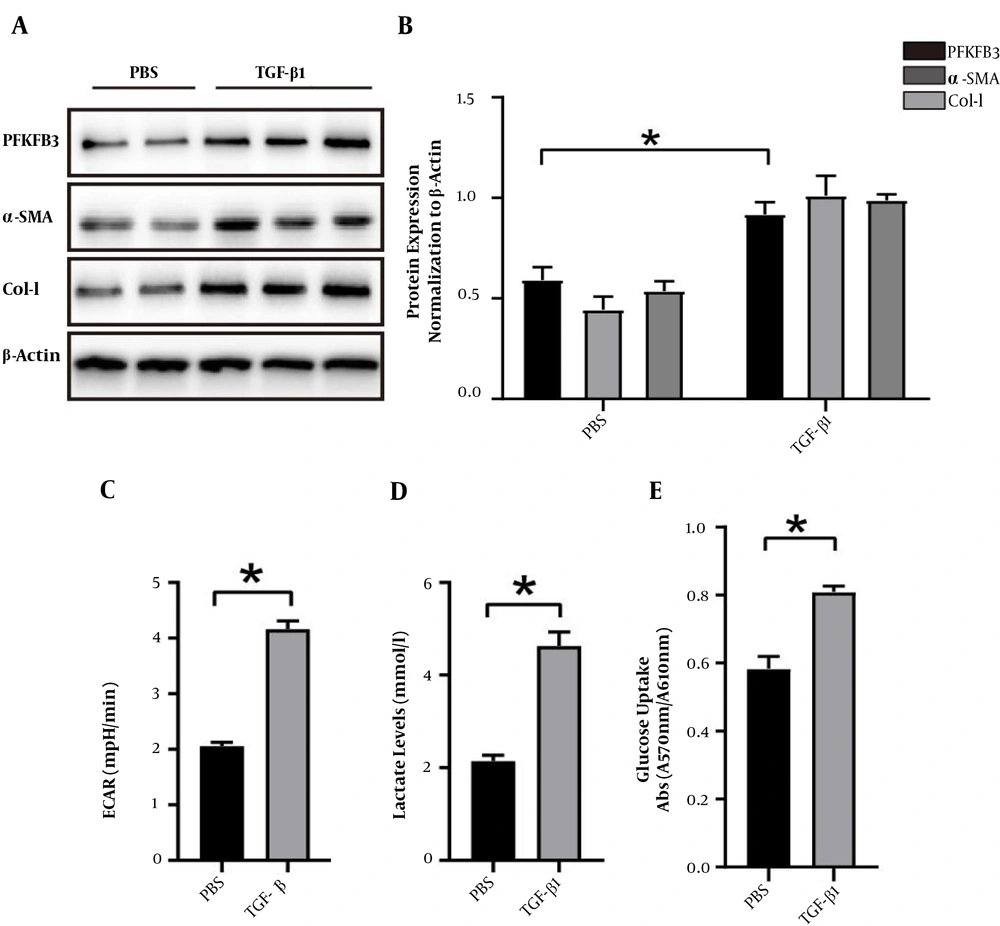
Figure 3.
The expression of PFKFB3 and changes of aerobic glycolysis in LX2 cells induced and activated by TGF-β1. A, expression of PFKFB3, type I collagen, and α-SMA protein in LX2 cells after TGF-β1-induced activation, with β-actin as the internal control; B, analysis of the relative expression levels of PFKFB3, type I collagen, and α-SMA protein (* P < 0.05); C, real-time extracellular acidification rate (ECAR) was recorded and show the basal levels of ECAR (n = 5). * P < 0.05 compared with time zero by unpaired Student’s t-test; D, measurement of lactate in cell culture medium; * P < 0.05; E, measurement of cell glucose uptake; * P < 0.05.
4.4. PFKFB3 Small-Molecule Inhibitor (3PO) Inhibits the Activation and Glycolysis of Human LX-2 HSCs
The 3PO treatment significantly reduced the protein expression of PFKFB3. It also inhibited the protein expression of type I collagen and α-SMA compared to the non-treatment groups (P < 0.05, Figure 4). It inhibited the aerobic glycolysis of LX-2 cells, as shown by low levels of ECAR and reduced lactate production and glucose uptake (Figure 4).
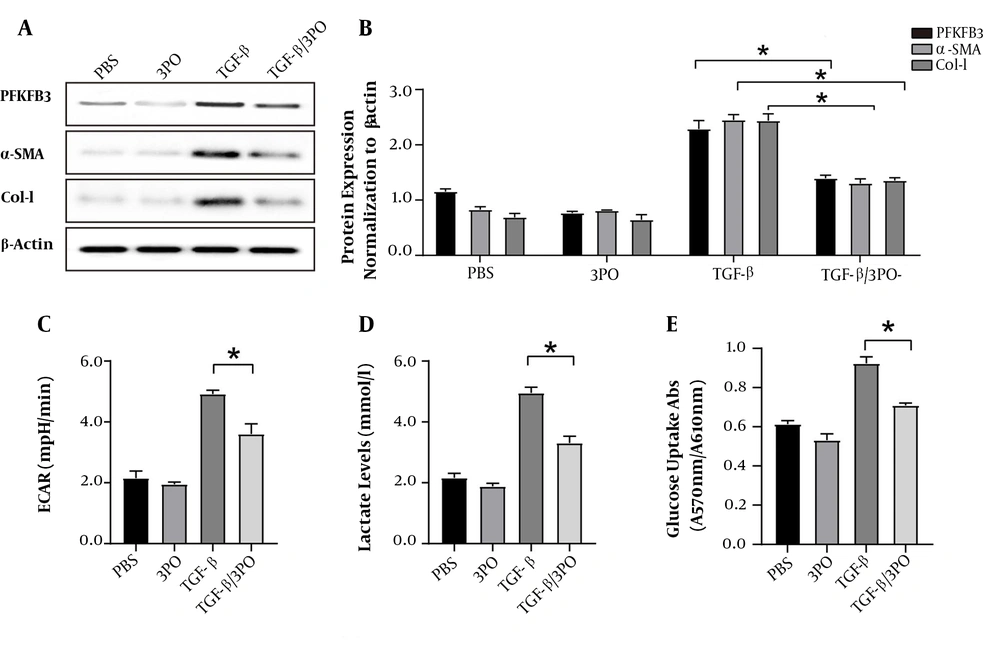
Figure 4.
Inhibition of PFKFB3 by 3PO blocks aerobic glycolysis and activation of LX2 cells. After LX2 cells were activated by TGF-β1, they were treated with 3PO. A and B, WB detection of changes in protein expression levels of PFKFB3, α-SMA, and Col-I in the experimental groups with or without TGF-β1 stimulation and with or without 3PO treatment; C, real-time extracellular acidification rate (ECAR) was recorded and showed the basal levels of ECAR (n = 6). * P < 0.05 compared with time zero by unpaired Student’s t test; D, measurement of lactate in cell culture medium; * P < 0.05; E, measurement of cell glucose uptake; * P < 0.05.
4.5. Adding PFKFB3 Inhibitor to the CCL4-Induced Liver Fibrosis Mouse Model Improves the Progression of Liver Fibrosis
After the successful establishment of the mouse liver fibrosis model, the mice were given 3-PO intragastric therapy (Figure 5A). We confirmed that the addition of the PFKFB3 inhibitor 3PO after successful remodeling improved the progression of fibrosis (Figure 5). The 3PO group showed fewer fiber cords on Sirius staining and Masson staining, reduced α-SMA expression, and improved liver inflammation indicators (Figure 5C and D).
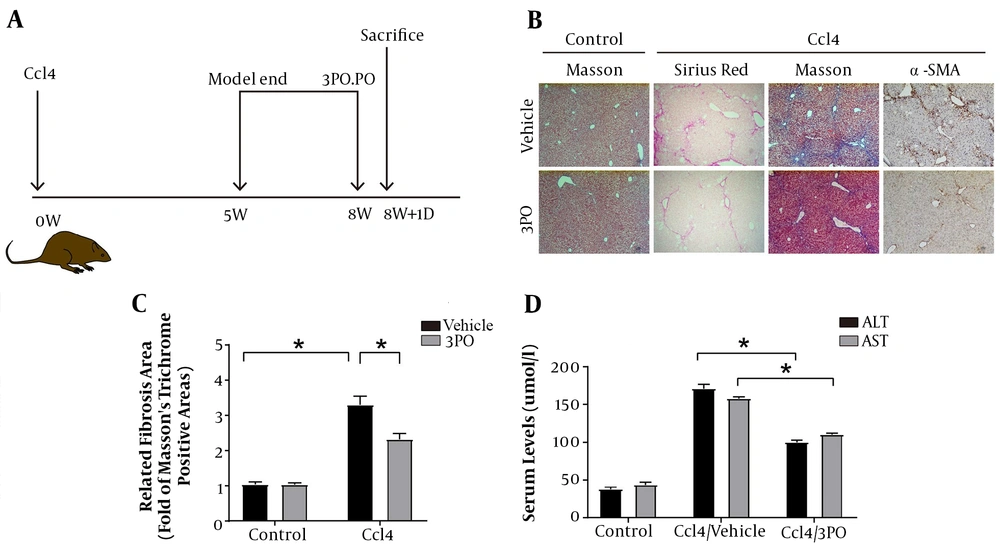
Figure 5.
The effect of adding PFKFB3 inhibitor to the CCl4 liver fibrosis mouse model on the process of liver fibrosis. A, simple flowchart of the experimental design; B, mouse liver histopathology by Sirius staining (100X), Masson trichrome staining (100X), and α-SMA immunohistochemistry (n = 5 – 7); C, analysis of fibrous collagen deposition in liver fibrotic lesions; * P < 0.05; D, serological changes in liver inflammation indicators in mice; * P < 0.05.
5. Discussion
The main histological feature of liver fibrosis is the increased synthesis and decreased degradation of the extracellular matrix that is rich in type I collagen. This imbalance leads to the excessive deposition of collagen in the liver tissue, ultimately leading to the destruction of normal liver structures and loss of liver cells, making the liver unable to carry out its normal synthesis and metabolism functions (11-13). Previous studies in China and abroad have shown that the most important link in the onset of liver fibrosis is related to the activation of HSCs and changes in their functions. The phenotypic transition of quiescent HSCs during the process of trans-differentiation into myofibroblasts is characterized by proliferation and increased matrix production and secretion. This process requires energy expenditure. Based on this discovery, scholars have confirmed that the emergence of aerobic glycolysis is one of the important metabolic characteristics of fibrosis. Differentiated myofibroblasts are similar to highly proliferating tumor cells in their biological functions and biosynthesis, and the reprogramming of cell metabolism is similar to the Warburg effect in tumor cells (14-17).
The natural product oroxylin destroys aerobic glycolysis through LDH-A, inhibits the contraction of HSCs, and reduces liver fibrosis (18). The well-known natural product curcumin can also inhibit aerobic glycolysis by HSCs, the mechanism of which is related to the activation of adenosine monophosphate-activated protein kinase (19). The above results suggest that the trans-differentiation process of HSCs is closely related to glycolysis. Since the outcome of liver injury is determined by factors that control the activation of HSCs, and the reprogramming of cell metabolism during HSC trans-differentiation is one of its important metabolic characteristics, identifying methods capable of targeted regulation of HSC metabolism may lead to novel approaches to reduce HSC activation and slow the progression of liver fibrosis.
In this study, the cell energy metabolism detection method was used to detect the changes in ECAR (Figure 3C), and the level of glycolysis in activated HSCs showed a continual increase. Since acidification induced by lactate is also one of the signs of glycolysis, we measured lactate and found that the lactate content in the culture medium after cell activation was significantly increased. Importantly, this result is consistent with our findings in liver fibrotic tissue. Consistent with the results of lactate measurement, glucose uptake was also significantly increased during the procession of HSC trans-differentiation stimulated by TGF-β1. Therefore, the results of this study clearly indicate that glycolysis occurs during HSC trans-differentiation and liver fibrosis. The TGF-β1 stimulation and activation also upregulated α-SMA and collagen (Figure 3A and E). Together, these results suggest that TGF-β1 stimulates glycolysis during HSC trans-differentiation and participates in the process of liver fibrosis.
As known, PFKFB3 is one of the key rate-limiting enzymes in glycolysis and a member of the PFKFB family. It is a potent allosteric activator of PFK-1. It can positively regulate glucose uptake and increase the production of fructose-2,6-bisphosphate and lactate (20). Therefore, the expression and activation states of PFKFB3 are directly related to the initiation of aerobic glycolysis (21). It is highly expressed in a variety of tumors. The high expression of PFKFB3 in osteosarcoma is closely related to tumor growth and metastasis, as well as the prognosis of patients. The mechanism of these effects may be related to the enhancement of PFKFB3 activity after RAS and Akt activation (22). In 2015, Xie et al. studied in detail the effects of PFKFB3 on pulmonary fibrosis glycolysis in pulmonary fibroblasts, bleomycin-induced pulmonary fibrosis models, and idiopathic pulmonary fibrosis tissues and found that the expression of PFKFB3 increased significantly during the trans-differentiation process of pulmonary fibroblasts. Recent studies have shown that CPEB4 increased the expression of PFKFB3 to induce glycolysis and activate mouse and human hepatic stellate cells (23). In this study, we first confirmed through in vivo and in vitro experiments that the expression of PFKFB3 was significantly increased during HSC activation and liver fibrosis. We further found through immunofluorescence detection that the expression of PFKFB3 and α-SMA in animal liver fibrosis tissues was significantly increased, with colocalization. This indicates that PFKFB3 is positively correlated with the occurrence of liver fibrosis. Finally, we added the PFKFB3 inhibitor 3PO. We chose 3PO over 2-DG for this purpose because 2-DG inhibits glycolysis high up within the glycolytic flux and invokes more complete and permanent glycolytic suppression. Furthermore, 2-DG is a competitive inhibitor of glucose, and glucose is present at high concentrations (about 4 - 6 mM)in the blood, there are still serious concerns about the real possibility that a sufficient therapeutic window may exists for this compound (24). No cell death was observed in the experiment, in agreement with previous studies using 3PO in other cell types. In the in vivo and in vitro systems, 3PO showed a certain degree of efficacy in improving the progression of liver fibrosis in both experiments. The results of this experiment preliminarily show that PFKFB3 is upregulated in the process of liver fibrosis and HSC activation, which may be related to its involvement in regulating aerobic glycolysis during HSC activation.
Only with a thorough understanding of the molecular mechanisms that lead to persistent fibrosis can we develop strategies to reduce liver fibrosis. This study preliminarily confirmed that the expression of PFKFB3 in HSC activation and liver fibrosis is significantly increased, which is related to its involvement in regulating the occurrence of aerobic glycolysis in HSCs. In addition, the PFKFB3 inhibitor showed a certain inhibitory effect on liver fibrosis. Our findings suggest that PFKFB3 plays an important role in regulating HSC aerobic glycolysis and may also become a therapeutic target to modulate HSC metabolism in the treatment of liver fibrosis. Further research is needed to verify the effectiveness and relevance of targeting energy metabolism as a therapeutic strategy to determine its transformative potential in the treatment of liver fibrosis and cirrhosis. Therefore, future studies should explore the effect of PFKFB3 on the progression of human liver fibrosis in human fibrotic tissues and further explore the trigger points of PFKFB3 in HSC aerobic glycolysis to fully describe the relationship between PFKFB3 and liver fibrosis.