
1. Background
Hepatitis B Virus (HBV) infection is a worldwide public health problem. According to WHO 2019, 296 million people suffer from chronic HBV infection, and 1.5 million new cases are detected yearly. In 2019, HBV infection led to 820,000 deaths because of hepatic cirrhosis and carcinoma, three-quarters of whom lived in Asia and the western Pacific Ocean (1, 2). Since viral hepatitis is a public health concern, members of the WHO have committed to reducing its incidence and mortality rate by 65% and 90%, respectively, compared to the baseline of 2015 (3). However, the most important challenge is in developing countries where the cost of diagnostic tests and medications is high (3, 4).
In conjunction with public vaccination, timely diagnosis of HBV infection is a vital measure to decrease complications and mortality (5). Serological biomarkers such as HBsAg, anti-HBs, and anti-HBc antibodies are useful for diagnosing HBV (6, 7).
Quantitative hepatitis B surface antigen (HBsAg) evaluation is a practical method for HBV infection prognosis, infection course, and response to treatment. Studies show a meaningful correlation between serum HBsAg and HBV covalently closed circular DNA (cccDNA) before and after treatment (8-10).
Besides, HBV infection can be diagnosed using molecular and serological assays. Given the high cost of molecular assays, serological tests can be a suitable substitute (11). Guidelines recommend high-quality HBsAg serological tests that are sensitive, practical, cost-effective, and available (10, 12, 13).
2. Objectives
We developed a quantitative in-house ELISA and used clinical samples to compare HBsAg and HBV DNA in serum samples.
3. Methods
3.1. Samples
We received 102 positive and 98 negative samples from Iran's Blood Banking Organization. Informed consent was obtained from all donors. This study was approved by the Ethics Committee of Iran's Blood Banking Organization on 26 October 2020 (Ethic code: IR.TMI.REC.1399.023).
3.2. Polyclonal Antibody Preparation
We subcutaneously injected 2 µg of HBsAg with 95 - 99% purity (Pasteur Institute of Iran) into three New Zealand white rabbits. Booster doses were intramuscularly injected on days 7, 14, and 21. Blood samples were collected on days zero and 28 to assess anti-HBsAb using a commercial kit (Pishtaz Teb, Iran).
3.3. Purification and Quality Assessment
The polyclonal antibody was precipitated using ammonium sulfate (Merck, Cat. No. 101217). Ammonium sulfate was removed using tangential flow filtration (TFF) (Labscale TFF system, Millipore), and the samples were concentrated. A 100 kDa cut-off filter (Millipore, Pellicon® XL50 with Biomax® 100 kDa Membrane, C screen, 50 cm², Cat. No. PXB100C50) and PBS 0.07 M (Gibco, Cat. No.18912014), pH 6.3, were used in TFF. Ammonium sulfate removal was confirmed using the Nessler test. Ion exchange chromatography was then used to remove the remaining impurities. The quality of the purified antibodies was evaluated using SDS-PAGE, and the quantity of the purified antibodies was evaluated using Bradford and Lowry assays.
3.4. Optimization
The prepared polyclonal antibody was diluted (0.5, 1, 2, 5, 10, and 20 µg/mL) in carbonate bicarbonate buffer (pH = 9.6) and used to coat the plates.
We used BSA (1% and 5%) for blocking. Also, standard HBsAg (1 µg/mL, Pasteur Institute of Iran) and biotin-conjugated anti-HBsAg monoclonal antibody (1 mg/mL, Fapon Biotech Inc.) were used to optimize the analyte concentration. Then, various concentrations (0.5, 1, 2, 4, and 8 µg/mL) of the conjugated antibody were used to determine its optimal concentration. Finally, various HBsAg standard concentrations (0.4, 0.5, 0.63, 1.25, 2,5, and 5 ng/mL) were used to generate a standard curve and determine the functional characteristics of the assay.
The ELISA microtiter plates were coated with anti-HBs diluted in coating buffer (100 μL/well). The plates were incubated overnight at 4°C on a shaker. The solutions of the wells were discarded, and the wells were washed 3 times with tris-buffered saline (TBS) solution with the detergent Tween® 20 (TBST) (20 mM Tris-HCl, Merck, Cat. No. 648317, and 150 mM NaCl). Bovine serum albumin phosphate buffer solution was used to block unbound sites (BSA, Sigma, Cat. No. A2153). The plates were incubated at room temperature for 2 h on a shaker. After 3 washes with TBST and drying, samples (100 μL) were added, incubated at 37°C for 1 hour, and washed 3 times with TBST. Next, 25 μL/well of anti-HBs/Biotin was added, incubated at 37°C for 1 hour, and washed 3 times with TBST. Afterward, 50 μL/well of streptavidin/peroxidase was dispensed, plates were sealed and incubated at 37ºC for 30 min, washed 5 times with TBST, and dried. Each well was then filled with 50 μL of the working chromogen solution (1 mL of substrate chromogen with 10 mL of substrate tetramethylbenzidine (TMB)), sealed, and incubated in the dark at 15 - 25ºC for 15 min. The reaction was stopped by adding 100 μL/well of stopping solution (1 M H2SO4). Finally, the optical density (OD) was measured at 450 nm with an ELISA plate reader (Hyperion Microplate Reader, Germany, MPR4++).
3.5. Functional Characteristics
3.5.1. Limit of Detection
Twenty repeats of the blank sample were tested using the developed assay. Mean and standard deviation (SD) were calculated, and a cut-off OD (mean + 2SD) was determined. Some references consider this value as the cut-off (9, 15). We, however, used a different approach to obtain a more accurate cut-off. Twenty repeats of low HBsAg standard concentrations (0.4, 0.5, 0.63, and 1.25 ng/mL) were tested using the developed assay, and the sample-to-cut-off ratio (S/C ratio) was calculated. The LOD was regarded as the lowest concentration, at which 95% of the repeats were positive.
3.5.2. Clinical Sensitivity
The developed assay was compared with a commercial ELISA kit and a molecular assay. First, 102 plasma samples, which were positive for HBV-DNA in TaqMan real-time PCR (Altona (AltoStar® HBV PCR Kit 1.5, Germany)), were tested using the developed assay. Second, 101 samples, which were positive with the commercial ELISA kit (Iran Pishtaz Teb Diagnostics, PT-HBs Antigen-96), were tested using the developed assay.
3.5.3. Clinical Specificity
The developed assay was compared with a commercial ELISA kit and a molecular assay. First, 98 plasma samples, which were negative in TaqMan real-time PCR, were tested by the developed assay. Second, 99 plasma samples, which were negative using the commercial ELISA kit, were tested by the developed assay.
3.5.4. Intra-assay and Inter-assay Evaluation
Three repeats of 4 HBsAg standard concentrations (0.63, 1.25, 2.5, and 5 ng/mL) were tested in a single run, and the coefficient of variation (CV) values of ODs and S/C ratios were calculated for intra-assay evaluation. Three repeats of 4 HBsAg standard concentrations (0.63, 1.25, 2.5, and 5 ng/mL) were tested on three different days, and the CV values of ODs and S/C ratios were calculated for inter-assay evaluation.
3.5.5. Accuracy
Accuracy is the correlation between the actual concentration of the analyte in the sample and the measured concentration of the standards. The accuracy was calculated by testing 3 repeats of 4 HBsAg standard concentrations in each run and 3 different runs on different days.
3.5.6. Limit of Quantification and Linearity
The limit of quantification is the lowest concentration of the analyte that could be measured precisely and accurately in the assay's linear range. Three repeats of the 4 standard concentrations (0.63, 1.25, 2.5, and 5 ng/mL) were tested using the developed assay. Linearity was calculated by testing 3 repeats of the 4 standard concentrations.
3.6. Clinical Evaluation
Two hundred plasma samples were tested using (1) HBV PCR Kit 1.5 (Altona, Germany), (2) commercial ELISA kit (Iran Pishtaz Teb Diagnostics, PT-HBs Antigen-96), and (3) the developed assay. One hundred and two samples were positive using the molecular assay, and 101 samples were positive using the commercial ELISA.
3.7. HBV-DNA Real-time PCR
The DNA from the clinical samples was purified using a DNA purification kit (DNJia Virus DNA Kit, RojeTechnology, Iran). Real-time PCR was performed using StepOne™ Real-time PCR System (Applied Biosystems, USA).
The amplification profile included one cycle of enzyme activation at 95°C for 15 min, followed by 45 cycles of denaturation at 95°C for 15 s, annealing at 55°C for 40 s, and 72°C for 20 s with a single fluorescence acquisition at green/yellow channel. Positive control and no template control were included in each qPCR assay.
3.8. Statistical Analysis
Linear regression and analytical sensitivity were used to analyze standard curve data. Specificity, sensitivity, reproducibility, and correlation coefficients were calculated using SPSS (version 25; Inc., Chicago). The CV was calculated for between-run and within-run in Microsoft Excel (2016).
4. Results
4.1. Purification and Quality Assessment
The HBsAb titer was more than 200 mIU/mL, indicating rabbits' immunization and antibody production. The rabbit polyclonal antibody was then purified using ion exchange chromatography and TFF. The concentration of the polyclonal antibody was 1.7 and 1.4 mg/mL using Bradford and Lowry assays, respectively. The mean concentration (1.55 mg/mL) was used in the calculations.
The quality of the polyclonal antibody was evaluated after purification using 10% PAGE with and without reducing agents (Figure 1). The single band in Figure 1A indicates the high purity of the antibody. Figure 1B shows the light and heavy chains of the polyclonal antibody in reducing conditions. The results indicated that the polyclonal antibody is suitable for ELISA.
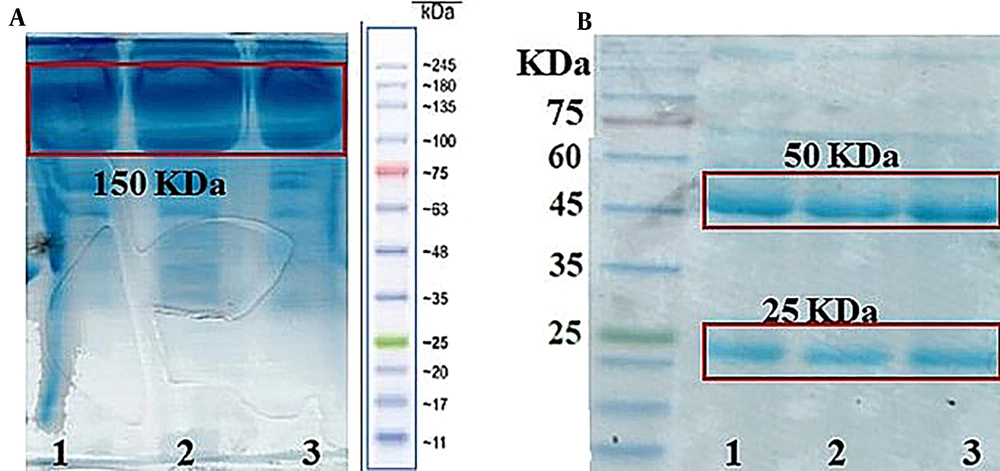
Figure 1.
Analysis of purified antibodies on 10% resolving SDS PAGE. A, non-reducing 10% acrylamide gel electrophoresis was performed to assess the quality of the antibody. The single and sharp bands observed in lanes 1, 2, and 3 indicate rabbit antibody purification; B, reducing 10% acrylamide gel electrophoresis was performed to assess the quality of the antibody. 25KDa and 50KDa bands in each well indicate light and heavy chains of rabbit Abs, respectively.
4.2. Determination of Optimal Concentrations of Antibodies
The aim of determining the concentrations of rabbit polyclonal HBsAb, monoclonal antibody, and BSA was to establish the appropriate concentrations for the developed ELISA.
The developed ELISA was performed using a constant concentration of HBsAg (2.5 ng/mL) and conjugated monoclonal HBsAb (1 µg/mL). The best OD was achieved at 5 µg/mL of the rabbit polyclonal HBsAb and 5% BSA. After primary optimization, various concentrations of conjugated monoclonal Ab were used. The best concentration was 1 µg/mL.
4.3. Functional Characteristics
4.3.1. Limit of Detection
The mean + 2SD of OD (20 repeats of the blank sample) was 0.32, which was considered a cut-off. Based on the results, all 20 repeats of 0.5, 0.63, and 1.25 ng/mL were positive, while 35% of the repeats of 0.4 ng/mL were positive. The lowest concentration at which 95% of the repeats were positive was considered LOD. Thus, the LOD of the assay was 0.5 ng/mL.
4.3.2. Clinical Sensitivity and Specificity
The developed assay was compared with commercial molecular and ELISA tests. Two hundred clinical samples were tested, and positive predictive value (PPV) and negative predictive value (NPV) were calculated. Table 1 shows the results of the commercial molecular assay and commercial ELISA.
Table 1.
Sensitivity, Specificity, Positive Predictive Value, and Negative Predictive Value of the Developed Assay Based on Commercial Kits
| Total Samples | TP | TN | FP | FN | Sensitivity (%) | Specificity (%) | PPV (%) | NPV (%) | |
|---|---|---|---|---|---|---|---|---|---|
| Molecular Kit | 200 | 98 | 92 | 6 | 4 | 96 | 93.8 | 94.2 | 95.8 |
| ELISA Kit | 200 | 98 | 93 | 6 | 3 | 97 | 93.9 | 94.2 | 96.8 |
Abbreviations: TP, true Positive; TN, true negative; FP, false positive; FN, false negative; PPV, positive predictive value; NPV, negative predictive value.
4.3.3. Intra-assay and Inter-assay Evaluation
Table 2 shows that the highest and lowest CV values of ODs in intra-assay were 7.23% and 2.44%, respectively. These numbers are similar to the highest and lowest CV of S/C ratios. The highest and lowest CV values of ODs in inter-assay were 8.59% and 0.51%, respectively. The highest and lowest CV values of S/C ratios were 9% and 2.2%, respectively.
Table 2.
Intra- and Inter-assay Reproducibility of HBs Ag Quantitation Aliquots from a Single Stock of Standard Dilutions (0.63 – 5 ng/mL) in Reproducibility Experimentsa
| HBs Ag Concentration (ng/mL) | Intra-assay | Inter-assay Ct Values | ||||||
|---|---|---|---|---|---|---|---|---|
| OD of the Run | CV (%) of OD | S/C Ratio of Run | CV (%) Of S/C Ratio | OD of Three Runs | CV (%) of OD (3 Runs) | S/C Ratio of Three Runs | CV (%) of S/C Ratio (3 Runs) | |
| 5 | 3.36 ± 0.08 | 2.44 | 10.5 ± 0.3 | 2.4 | 3.37 ± 0.02 | 0.51 | 10.5 ± 0.2 | 2.2 |
| 2.5 | 2.22 ± 0.09 | 4.08 | 6.9 ± 0.3 | 4.1 | 2.14 ± 0.08 | 3.51 | 6.7 ± 0.3 | 4.3 |
| 1.25 | 1.41 ± 0.1 | 7.23 | 4.4 ± 0.3 | 7.2 | 1.47 ± 0.13 | 8.59 | 4.6 ± 0.4 | 9.0 |
| 0.63 | 0.82 ± 0.05 | 6.16 | 2.6 ± 0.2 | 6.2 | 0.83 ± 0.02 | 1.85 | 2.6 ± 0.2 | 7.5 |
a Values are expressed as mean ± SD.
4.3.4. Accuracy
Two approaches were used to calculate the accuracy of the developed assay. First, the ratio of the observed OD of the HBsAg standard concentration to the actual concentrations (expected) was determined. The lowest and highest ratios were 0.523 and 1.184, respectively (Table 3). Second, the same calculation was performed for the samples' OD and the calculated cut-off value. The lowest and highest ratios were 0.507 and 1.184, respectively (Table 3). The CV for 0.63, 1.25, 2.5, and 5 ng/mL was less than 20%, and that of 0.5 ng/mL was less than 50%. Thus, 0.63 ng/mL was considered the limit of quantification (LOQ). Plotting the results showed that the developed assay was linear over the range of 0.63 - 5 ng/mL (Figure 2). The R2 values for OD and S/C ratio methods were 0.9835 and 0.9828, respectively.
Table 3.
Accuracy Determination of Each Standard Dilution. Accuracy = Observed Average Value of Concentration/Expected Value of Concentration
| HBs Ag Concentration (ng/mL) | Mean OD ± SD | Observed Value (ng/mL) | Ratio of Obs/Exp | Mean S/C Ratio ± SD | Observed Value (ng/mL) | Ratio of Obs/Exp |
|---|---|---|---|---|---|---|
| 5 | 3.37 ± 0.02 | 4.89 | 0.978 | 10.5 ± 0.2 | 4.89 | 0.978 |
| 0.63 | 0.83 ± 0.02 | 0.33 | 0.523 | 2.6 ± 0.2 | 0.32 | 0.507 |
| 2.5 | 2.14 ± 0.08 | 2.68 | 1.072 | 6.7 ± 0.3 | 2.69 | 1.076 |
| 1.25 | 1.47 ± 0.13 | 1.48 | 1.184 | 4.6 ± 0.4 | 1.48 | 1.184 |
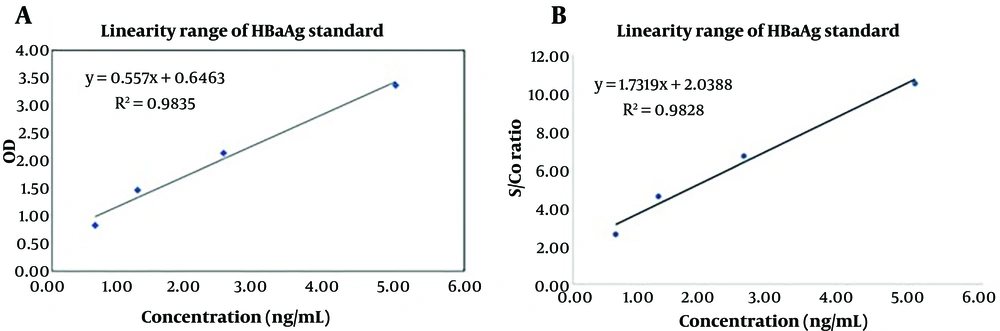
Figure 2.
Calibration curve for HBsAg standard dilutions obtained by linear regression analysis of measured OD and S/C ratio values versus HBsAg concentration. The standard curve generated by HBsAg standard solutions has a dynamic range from 0.63 to 5 ng/mL.
4.4. Clinical Evaluation
Two hundred clinical samples were evaluated using a commercial molecular kit, a commercial ELISA kit, and the developed ELISA. One hundred and two samples were positive using the molecular assay. Compared to the molecular assay, the developed ELISA had 6 false-positive and 4 false-negative results (Table 1).
One hundred and one samples were positive using the commercial ELISA. Compared to the commercial ELISA, the developed ELISA had 6 false-positive and 3 false-negative results (Table 1). Pearson's correlation coefficient was 0.987 (P-value = 0.024) (Figure 3). Fifty-six samples had a concentration of more than 5 ng/mL. Note that the samples that fell in the assay's linear range were included in the calculation. The correlation of both the ELISA and the molecular assay was not desirable.
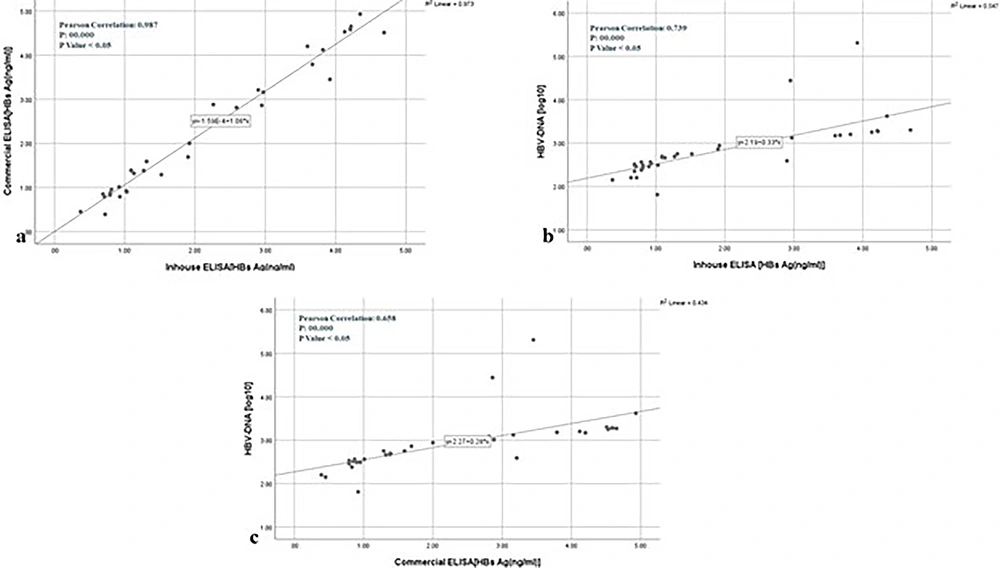
Figure 3.
The plots of correlation between the three assays. a, correlation between the developed assay and the commercial ELISA; b, correlation between the developed assay and the commercial molecular assay; c, correlation between the commercial ELISA and the commercial molecular assay.
5. Discussion
Hepatitis B virus infection is important due to its various transmission routes and high morbidity/mortality rates. Also, transmission through blood transfusion is still possible despite the measures to decrease transmission risks (16-18). Timely diagnosis of the infection using a reliable, available, and cost-effective assay is a public health priority. Quantitative HBsAg assessment is a useful biological parameter for HBV infection in patients treated using peg-interferon and nucleoside analogs. In fact, decreasing HBsAg level is a suitable predictor of treatment response (7, 8). Serological assays such as ELISA are mostly used to evaluate HBsAg (19). They also do not need expensive equipment and professional personnel; thus, they are easily available and applicable (9, 19, 20).
Several monthly tests are required to follow chronic HBV patients' status and treatment response. This imposes a high financial burden on the patients, especially in developing countries. That is why new, inexpensive, and in-house assays are required (21).
The American FDA recommends a 0.5 ng/mL LOD for HBsAg ELISA (12). The LOD of the developed assay was 0.5 ng/mL. In this study, the polyclonal antibody was produced, purified, and optimized to develop the ELISA. The assay characteristics indicate that the polyclonal antibody performance was desirable. Kim used a monoclonal antibody for coating and yet achieved a higher LOD and LOQ (1 and 1 ng/mL) than our assay (0.5 and 0.63 ng/mL) (8).
One of the advantages of our assay is its high correlation with the commercial HBsAg ELISA. Fatema et al. developed an HBsAg ELISA. They evaluated its correlation with a commercial assay and obtained an r = 0.929. Our developed assay achieved a higher correlation with the commercial assay with an r = 0.987 (2).
Molecular assays are also used for HBV detection. Tuaillon et al. compared 4 automated serological assays with an HBV-DNA molecular assay. They reported a low correlation between the serological and molecular assays (10). Such results have also been obtained in Gupta's study (r = 0.443, P < 0.01) (22). Lee et al. even reported a lower correlation (r = 0.121, P < 0.01) (23). The correlation of our developed assay with the commercial ELISA and molecular assay was not high enough, yet it was higher than those in the mentioned studies (r = 0.739 and 0.568, respectively, P < 0.05).
Another advantage of our in-house assay is that all functional characteristics of the assay were carefully evaluated. Importantly, all functional characteristics were in the acceptable ranges recommended by the guidelines. One disadvantage of our assay could be its correlation with the commercial molecular assay. Although it is higher than those in other studies, it could be improved.
5.1. Conclusions
Our in-house assay is reliable, available, and inexpensive. It can be used to quantify HBsAg with high sensitivity and specificity. It is also reproducible and well-correlated with commercial assays.