1. Background
Liver fibrosis has become a significant concern in our rapidly changing world. If left untreated, it can progress to cirrhosis, a condition with a mortality rate exceeding 1 million cases per year, ultimately increasing the risk of hepatocellular carcinoma (HCC) (1, 2). Liver fibrosis can develop as a result of various underlying causes, including chronic viral infections, such as hepatitis B virus (HBV) and hepatitis C virus (HCV), as well as nonalcoholic fatty liver disease (NAFLD) and alcohol-related liver disease. These factors can contribute to the development and progression of fibrosis in the liver (3). The accumulation of extracellular matrix (ECM) proteins, particularly fibrillar collagen (specifically type Iα) and α-smooth muscle actin (α-SMA), is a significant contributor to the activation and repeated trans-differentiation of hepatic stellate cells (HSCs). This process ultimately leads to the progression of hepatic fibrosis (4, 5). Hepatic stellate cells are typically located in the space between hepatocytes and sinusoidal cells in the liver. The presence of numerous growth cytokines, such as transforming growth factor-beta (TGF-β) and platelet-derived growth factor-beta (PDGF-β), plays a crucial role in activating HSCs and inducing a fibrogenic state. This process contributes to the development and progression of hepatic fibrogenesis (6).
The TGF-β family includes structurally and functionally related proteins such as activins and bone morphogenetic proteins (BMPs), which are of particular importance in the pathogenesis of this disease (7). This pro-fibrogenic mediator promotes HSC transition to a myofibroblast-like phenotype through the TGF-β1/Smads signaling pathway, thus prompting the vast accumulation of ECM proteins like α-SMA and leading to the promotion of hepato-fibrogenesis (8). Once TGF-β receptor type I (TβRI) is activated, it phosphorylates SMAD2/3 at the specific C-terminal serine and linker residues. Following activation, SMAD2/3 molecules form heterodimeric and trimeric complexes with SMAD4 before being translocated into the nucleus. Inside the nucleus, these complexes contribute to the expression of hepatic fibrosis-promoting factors, such as ECM components like collagen-Iα and α-SMA (9). Thus, TGF-β can stimulate the expression of the genes related to the progression of liver fibrosis (10).
MicroRNAs, a type of non-coding RNAs with a size ranging from around 19 to 22 nucleotides, are involved in an array of physiological and pathological processes, including the development of liver fibrosis (11). When miRNAs bind to the 3' untranslated regions (3' UTR) of target mRNAs, they suppress the translation of the target genes. These molecules are highly important for their roles in cellular functions, including cellular energy metabolism, proliferation, and apoptosis (12). Based on recent studies, the over-expression of miR-126a is likely to inhibit the activation and proliferation of TGFβ1-activated HSCs by targeting SMAD4, which is a mediator in the TGF-β signaling pathway. Consequently, miR-126a seems to have the potential to be a therapeutic target for liver fibrosis (13, 14).
Mesenchymal stem cells (MSCs) are a type of pluripotent stem cells with significant potential for disease treatment. These cells are considered a credible source with promising features for various therapeutic applications (15). Exosomes derived from MSCs are extracellular membrane microvesicles (30 - 100 nm) comprising diverse proteins, mRNAs, microRNAs, and immunomodulatory factors (16). As evidenced by up-to-date studies, MSCs-derived exosomes outperform MSCs, considering that exosomes are small particles that can more readily find their way toward target cells. Also, exosomes are less complex than MSCs, so they can be produced and stored with ease (17). MSCs-derived exosomes have been shown to facilitate the repair of damaged tissues and suppress inflammatory responses (18).
Lipopolysaccharide (LPS), a critical component of the cell wall in Gram-negative bacteria, has the potential to induce pro-inflammatory responses in immune cells, including macrophages and neutrophils, through interaction with toll-like receptor 4 (TLR4), which serves as an immune receptor. The activation of TLR4 by LPS leads to the production of pro-inflammatory cytokines such as IL-1β, IL-6, and TNF-α, contributing to inflammatory responses and host defense mechanisms against bacterial infections (19). Reports from contemporary studies have demonstrated that LPS-stimulated MSCs can be more proficient in secreting anti-inflammatory factors (20). Studies suggest that exosomes are beneficial therapeutic alternatives for interventions such as chemotherapy and transplantation that can have many side effects (21). Here, exosomes derived from LPS-pretreated MSCs were extracted to study their effects on the genes linked to the development of liver fibrosis.
2. Objectives
The aim of this study was to investigate the impact of exosomes derived from MSCs (with or without pretreatment with LPS) on the expression of miRNAs involved in the progression of liver fibrosis, with a focus on miR-126a in the HSC-T6 cell line.
3. Methods
3.1. Cell Culture (HSC-T6)
HSC-T6 cells were cultured in DMEM containing 1% penicillin-streptomycin antibiotics and 10% fetal bovine serum. The cells were incubated in a humidified cell culture environment at 37°C with 5% CO2. For the in vitro study, HSC-T6 cells were seeded into 6-well culture plates at a density of 2 × 10⁵ cells per well. When they reached approximately 80% confluency, the cells were subjected to a 24-hour period of serum starvation in DMEM supplemented with 0.1% FBS. To activate HSCs, HSC-T6 cells were treated with TGFβ1 at a concentration of 2 ng/mL for 24 hours. Subsequently, the cells were collected and stored at -80°C for further analysis.
3.2. Isolation and Identification of Wharton's Jelly Mesenchymal Stem Cells
The umbilical cord tissue was washed with PBS and then chopped into small pieces (4 - 5 mm in size), followed by the removal of blood vessels. Subsequently, umbilical cord-derived mesenchymal stem cells were cultured in DMEM containing 10% FBS and 100 U/mL penicillin-streptomycin. These cells were maintained in an incubator at 37°C with 5% CO2. Over the course of the next five days, non-adherent cells were discarded. Once the cells reached a confluency of 70 - 80%, the media was changed. The cells were qualified for experiments after three passages. To achieve the desired cell differentiation capacity, Wharton's jelly mesenchymal stem cells (WJ-MSCs) were cultured using adipogenic and osteogenic media for three weeks. The phenotype of WJ-MSCs was evaluated using flow cytometry analysis with specific surface CD markers (CD44 and CD105).
3.3. Induction of Wharton's Jelly Mesenchymal Stem Cells with LPS
To examine the differentiation capabilities of MSCs in response to LPS treatment, LPS dilutions were prepared by aliquoting into serum-free DMEM. MSCs were pre-treated with LPS at a concentration of 1 μg/mL (22). After the removal of the stimulant, the cells were transferred to a serum-free or induction medium to conduct differentiation assays.
3.4. Extraction of Exosomes
The culture medium for WJ-MSCs was changed to a medium with a lower percentage of FBS every two days to facilitate the isolation of exosomes. After the FBS level was gradually reduced to zero, exosomes were isolated using an Exocib kit (Cib Biotech Co.). Within 72 hours, cell debris was removed by the centrifugation of the conditioned medium (CM) at 4000 × g for 10 minutes at 4°C. Purified CM was combined with the exosome pellet and left in an incubator overnight. The samples were then centrifuged at 3000 rpm for 40 minutes. Afterward, the supernatant was discarded, and the pellet was re-suspended in phosphate-buffered saline. The filtered exosome-containing solution was stored at - 70°C.
3.5. Real-time PCR
An RNA extraction kit (Idea-zist, Iran) was applied for the isolation of total RNAs, and qRT-PCR Master Mix 2x (Amplicon, USA) was used for reverse transcription through Quantistudio3 System (Applied Biosystems, USA). Target genes’ expression levels were normalized in relation to a reference gene (GAPDH). The adjusted expression of each gene was quantified by the 2-ΔΔCt method. After HSCs were treated with TGFβ1 (2 ng/mL), the gene expressions of miR-126a, α-SMA, collagen-Iα, E-cadherin, and N-cadherin were calculated. All experiments were repeated three times. The primers designed were prepared by Sinaclon Company (Iran) (Table 1).
Table 1.
Primer Sequences Used for RT-PCR
| Genes and Primers Sequence | Size of PCR Product (bp) |
|---|---|
| COLA1 | 188 |
| F. 5′-TGAAGGGACACAGAGGTTCA-3′ | |
| R. 5′-ACCATCATTTCCACGAGCA-3′ | |
| α-SMA | 196 |
| F. 5′-CAAGTCCTCCAGCGTTCTGA-3′ | |
| R. 5′-GCTTCACAGGATTCCCGTCTT-3′ | |
| E-cad | 179 |
| F. 5′-GCTGGACCGAGAGAGTTTCC-3′ | |
| R. 5′- CGACGTTAGCCTCGTTCTCA-3′ | |
| N-cad | 119 |
| F. 5′- AGGCTTCTGGTGAAATCGCA -3′ | |
| R. 5′-GCAGTTGCTAAACTCACATTG -3′ | |
| Hsa‐miR-126a | 153 |
| F. 5′-UGAGAACUGAAUUCAUGGUU-3′ | |
| U6 | |
| F. 5′-GCAGCACATATACTAAATTGG-3′ | |
| F. 5′-AAAATATGGAACGCTTCACGA-3 | |
| GAPDH | 181 |
| F. 5′- TCGGAGTCAACGGATTTGGT-3′ | |
| F. 5′- TTCCCGTTCTCAGCCTTTGAC-3′ |
Abbreviations: RT-PCR, reverse transcription-polymerase chain reaction; COLA1, collagen type I; α-SMA, alpha-smooth muscle actin; E-cad, E cadherin; N-cad, N cadherin; GAPDH, glyceraldehyde 3-phosphate dehydrogenase; F, forward; R, reverse.
3.6. Western Blot
The homogenization step was initiated using the Radio-Immunoprecipitation Assay (RIPA lysis buffer) to lyse cells and solubilize proteins. Subsequently, the lysed samples were centrifuged at 14,000 g for 20 minutes at 4°C to remove debris. Following protein concentration assessment, equal volumes of proteins (approximately 50 μg) were loaded onto a 7.5 - 12% SDS-PAGE gel for electrophoresis. The separated proteins were then transferred on a nitrocellulose membrane, and blocking was performed using skimmed milk (5%) for one hour at 25°C. For the detection of phosphorylated Smad3, diluted primary antibodies (1: 1000) were applied, and incubation was carried out overnight at 4°C. After washing the membrane with tris-buffered saline (TBS), the samples were incubated with mouse anti-rabbit IgG-HRP secondary antibodies (1: 10,000 diluted) for one hour at 25°C.
3.7. Statistical Analysis
All statistical analyses and comparisons between different groups were conducted using PRISM Software (GraphPad v9.4, CA). The data were reported as mean ± standard error of the mean (SEM), and a P-value of less than 0.05 was considered statistically significant. The ANOVA test was used for between-group comparisons.
4. Results
4.1. Wharton's Jelly Mesenchymal Stem Cells Phenotype
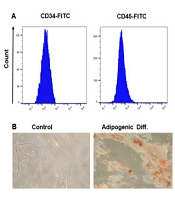
Flow cytometry analysis confirmed the presence of CD105 and CD44 and the absence of CD45 and CD34 on WJ-MSCs, confirming their identification (Figure 1A). The WJ-MSCs showed a fibroblastic appearance. Adipogenic differentiation was confirmed using Oil Red O staining, which showed increased aggregation of fat droplets containing red granules (Figure 1B). Additionally, Alizarin Red staining was performed to confirm the osteogenic differentiation of WJ-MSCs, evidenced by a significant increase in calcium deposition (Figure 1C).
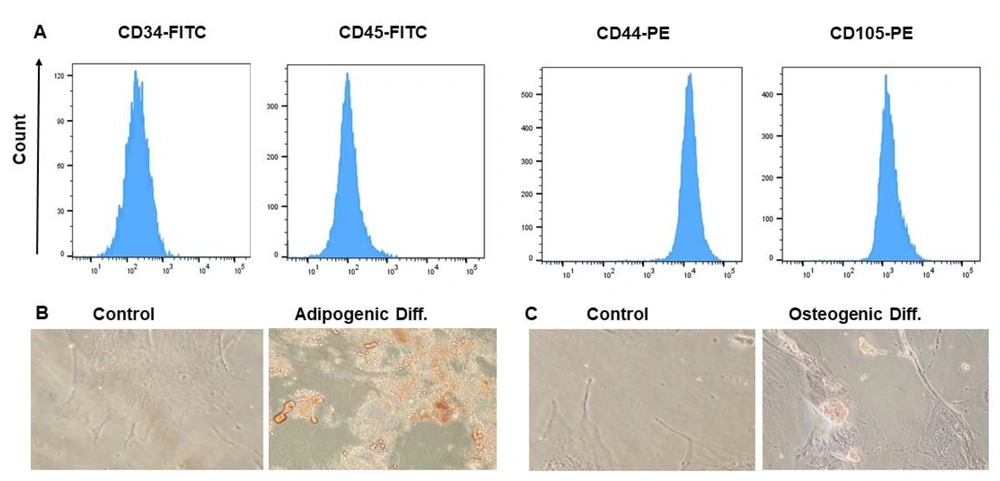
Figure 1.
Phenotypic and differentiation markers of WJ-MSCs. (A) The phenotype of WJ-MSC was affirmed by identifying their immunophenotypic characteristics by flow cytometry. CD44 and CD105 were positive markers compared to CD34 and CD45 as negative markers; (B) Adipogenic differentiation of MSCs. Oil Red O staining was utilized to discover lipid droplets; (C) Osteogenic differentiation of MSCs. Alizarin Red S staining was utilized to detect the mineralized matrix
4.2. Characterization of Wharton's Jelly Mesenchymal Stem Cells -Derived Exosomes
TEM images (Figure 2A) clearly showed a bilayer membrane with a low electron density. The mean size of the exosomes was measured at approximately 73 nm (Figure 2B). These results confirmed the successful isolation of exosomes from WJ-MSCs.
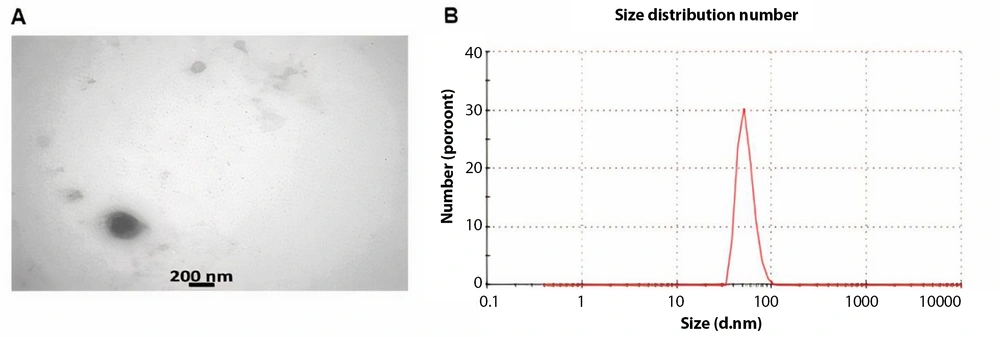
Figure 2.
WJ-MSC-Exo characterization. (A) The shape and size of WJ-MSC-Exo were visualized by a TEM microscope (scale bar: 0.3 μm); (B) The size distribution of WJ-MSC-Exo was determined by the Malvern zeta sizer
4.3. TGFβ1 and Exosomes Impact on Liver Fibrosis-Linked Genes
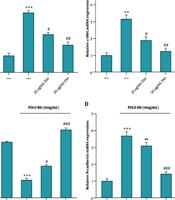
Treatment with TGFβ1 at a concentration of 2 ng/mL led to an increase in the expression levels of ECM-related genes such as collagen-Iα (P < 0.001, Figure 3A), α-SMA (P < 0.01, Figure 3B), and N-cadherin (P < 0.01, Figure 3D). Conversely, the expressions of miR-126a (P < 0.01, Figure 4A) and E-cadherin (P < 0.05, Figure 3C) were downregulated. Furthermore, after treatment of HSC-T6 cells with MSCs-Ex (with or without LPS stimulation) in combination with TGFβ1, the expression levels of Collagen-Iα (P < 0.01, Figure 3A), α-SMA (P < 0.05, Figure 3B), and N-cadherin (P < 0.05, Figure 3D.) significantly decreased, accompanied by the remarkable upregulation of miR-126a (P < 0.05, Figure 4A) and E-cadherin (P < 0.05, Figure 3C).
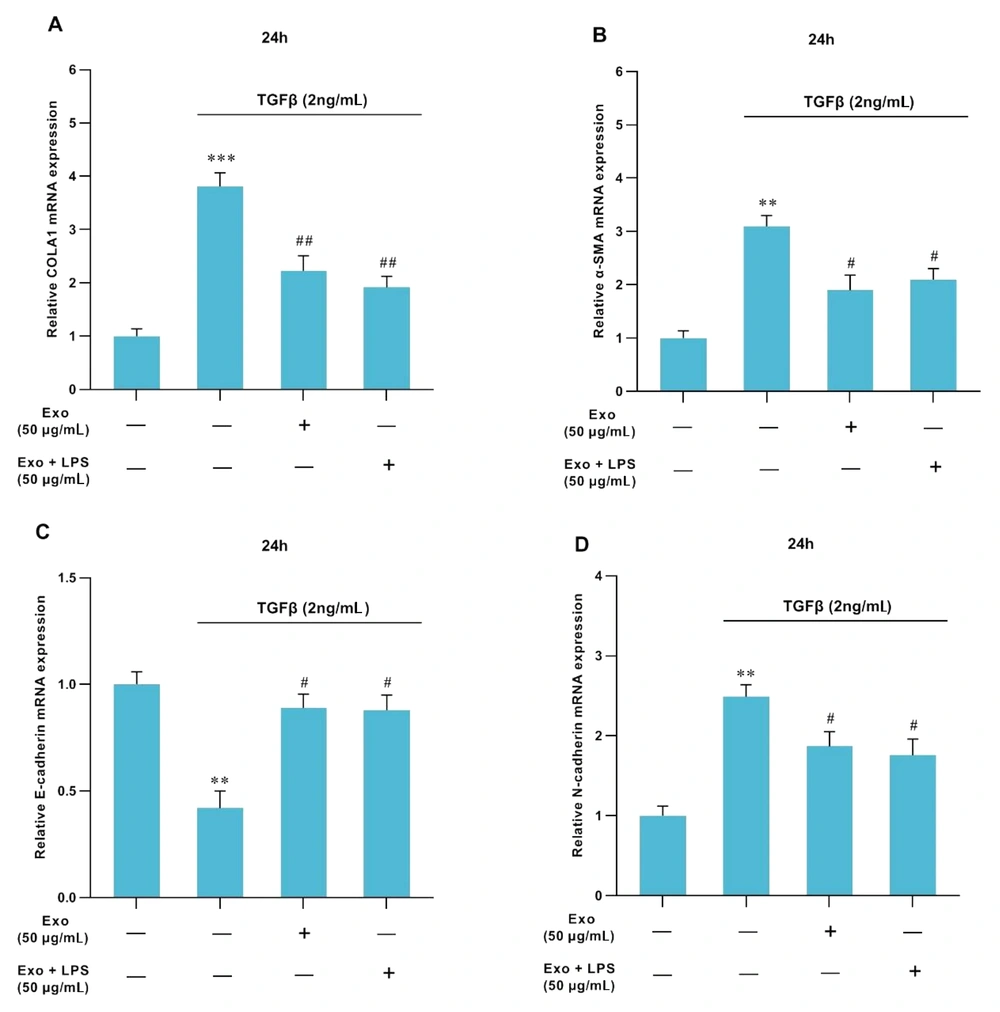
Figure 3.
Effects of MSCs-Ex (LPS-stimulated or non-stimulated) on the expression of fibrotic markers in TGFβ1-activated-HSCs assessed by RT-qPCR. Control cells were not treated. In the TGFβ1 group, HSCs were cultivated in DMEM with 2 ng/mL TGFβ1 for 24 hours. In the Exo group, HSCs were cultivated in DMEM with 2 ng/mL TGFβ1 for 24h, and then they were exposed to exosomes (50 μg/mL) for 24 h. In the LPS-stimulated-exosome group, HSCs were cultivated in DMEM with 2 ng/mL TGFβ1 for 24h, followed by exposure to exosomes (50 μg/mL) for 24h and then stimulation with LPS. The mRNA levels of collagen-Iα (COLA1) (A), α-SMA (B), E-cadherin (C), and N-cadherin (D) were surveyed through quantitative real-time PCR. The expressions of the candidate genes were normalized relative to the control. The data represent means ± standard error of means (SEM). P values of < 0.05 were regarded as statistically significant. **P < 0.01, ***P < 0.001, #P < 0.05, and ##P < 0.01.
4.4. Impact of TGFβ1 and Exosomes on SMAD-3c Phosphorylation
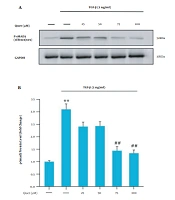
Following the treatment of HSC-T6 cells with TGFβ1 at a concentration of 2 ng/mL, there was a significant increase in SMAD-3c phosphorylation (P < 0.001). However, treatment with MSCs-Ex (with or without LPS stimulation) significantly reduced SMAD-3c phosphorylation (P < 0.001, Figure 4B).
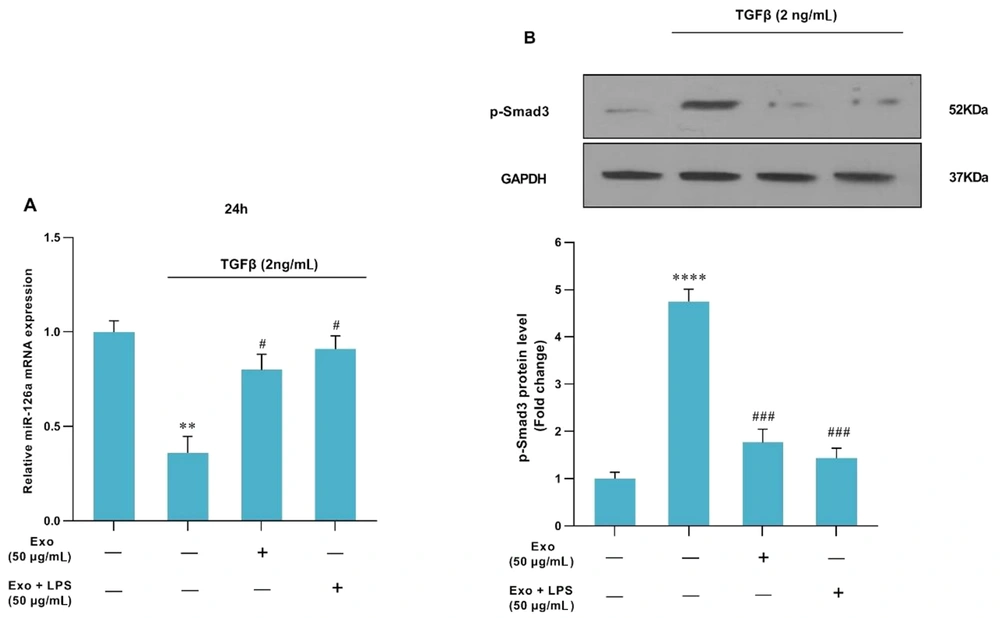
Figure 4.
The effects of MSCs-Ex (LPS-stimulated or non-stimulated) on TGF-β-induced HSC activation. (A) HSCs were treated with TGF-β1 (2 ng/mL) for 24 h in DMEM supplemented with FBS (1%). miR-126a expression was downregulated in response to TGF-β1, while it was upregulated after treatment with either non-stimulated or LPS-stimulated-exosome. MiR-126a expression was quantified by quantitative real-time PCR and normalized against a control. **P < 0.01; #P < 0.05. (B) The protein level of p-Smad3c was measured by western blot analysis, and the relative expression was adjusted against a control. ****P < 0.0001; ###P < 0.001
5. Discussion
Liver fibrosis occurs due to hepatocyte damage, autoimmune disorders, and alcohol-related liver disease, ultimately leading to cirrhosis and liver failure. These conditions are among the leading global causes of death (23). Hepatic stellate cells play a crucial role in the development of liver fibrosis mediated through factors such as TGFβ1 and PDGF, which are instrumental in the activation of HSCs, with TGFβ1 being particularly important (24).
Recent studies have indicated that TGFβ1-treated HSCs can induce the transition of HSCs into myofibroblast-like cells through the TGFβ1 signaling pathway, where SMAD3c serves as an intermediate signaling molecule (25). As a result of this transformation, these cells acquire new characteristics, including increased cell migration and adhesion, as well as elevated expression of collagen-Iα and α-SMA. This, in turn, leads to the accumulation of ECM components in response to the factors that contribute to liver fibrosis, ultimately causing liver injury (26). An array of studies has notified that miRNAs function as regulators of HSCs’ functions (e.g., proliferation, differentiation, and apoptosis) (27). MicroRNAs associated with the TGFβ1/SMAD3 signaling pathway can be categorized into two groups. The first group consists of profibrogenic miRs, including miR-33, miR-34, miR-21, and miR-199, which tend to increase during fibrogenesis. The second group comprises antifibrogenic miRs, such as miR-29 (a, b, c), miR-133, and miR-126, which are decreased during fibrogenesis. The imbalance between these two groups can exacerbate the progression of fibrosis (28). Regarding previous studies, miR-126a has been proven to be downregulated in HSCs activated by TGF β1, correlating with an increase in the deposition of ECM proteins (13). Hence, we conducted an analysis to assess the impact of exosomes derived from LPS-stimulated MSCs on miR-126a expression and smad3c phosphorylation, aiming to investigate the potential anti-fibrosis effects of exosomes. The results showed that MSC-derived exosomes, whether stimulated with LPS or not, were effective in mitigating the activation of HSCs (29).
Since exosomes can produce anti-inflammatory cytokines in inflammatory conditions following LPS stimulation (30), we stimulated MSC-Ex with LPS to enhance the secretion of anti-inflammatory factors and compared their effects with unstimulated MSC-Ex. We noticed that the progression of hepatic fibrosis, driven by HSC activation, was associated with the upregulation of collagen-Iα and α-SMA along with increased ECM deposition, ultimately leading to liver damage. Although many investigators have strived to divulge the pathways associated with hepatic fibrogenesis, it is yet not well-known how HSC activation or suppression can modulate this process (31).
In 2019, a study conducted by Rong et al., who investigated the mechanisms underlying the therapeutic effectiveness of exosomes from human bone marrow-derived MSCs (hBM-MSCs-Ex) in improving CCl4-induced liver fibrosis, the findings revealed that treatment with hBM-MSCs-Ex alleviated hepatic fibrogenesis by inhibiting the Wnt/β-catenin signaling pathway, which was accompanied by a reduction in the expression levels of collagen-Iα and α-SMA both in vitro and in vivo (32). In the present study, we focused on a different signaling pathway and witnessed a decrease in the expression of ECM-related genes following treatment with LPS-stimulated MSCs-Ex. In a study conducted by Yong He and his colleagues, they found that miR-126a was overexpressed, leading to the suppression of TGF-β-induced HSC proliferation by reducing SMAD4 protein levels without affecting its mRNA levels. Additionally, the overexpression of miR-126a increased apoptosis in HSCs, and both the mRNA and protein levels of α-SMA decreased as well (13). In our study, we obtained similar results, evidenced by a reduction in SMAD3 phosphorylation and, thereby, its upstream transcription factor, SMAD4, leading to a decline in collagen-Iα and α-SMA deposition and preventing liver fibrosis development. The results of Wu et al. in 2019 showed that collagen-Iα and α-SMA were reduced after treatment with salvianolic acid-B in DEN-induced liver fibrosis mice models, mediated via the linker area and the MAPK pathway, but not the carboxy region. These researchers also witnessed an increase in the phosphorylation of SMAD3c (33), while in our study, P-SMAD3c decreased after exposure to MSCs-Ex.
Our results indicated that the TGF-β1 signaling pathway was suppressed in HSC-T6 cells treated with LPS-stimulated MSCs-Ex primarily through the reduction of p-SMAD3c. Consequently, we observed a decrease in collagen-Iα and α-SMA as markers of HSC activation, as well as an increase in miR-126a. These findings collectively suggest an anti-liver fibrosis effect for MSCs-Ex (Figure 5), highlighting them as a promising candidate for preventing and treating liver fibrosis.
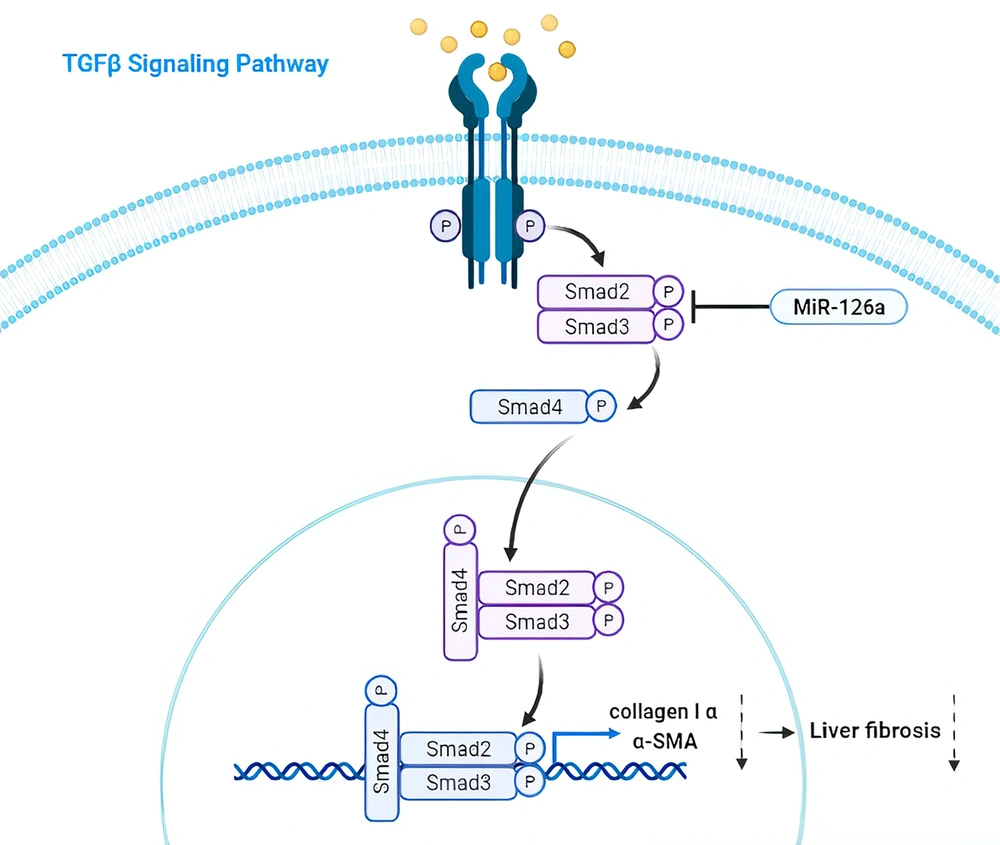
Figure 5.
The effects of miR-126a on the expression of ECM genes by inhibiting the TGFB/SMAD3c signaling pathway, resulting in the alleviation of liver fibrosis.