


1. Background
2. Methods
2.1. Population
2.1.1. Inclusion criteria
2.1.2. Exclusion Criteria
2.2. Magnetic Resonance Imaging Technique
2.3. Analysis and Measurement of Magnetic Resonance Imaging Images
2.4. Staging from Tumor Intervention to Recurrence
2.5. Magnetic Resonance Imaging Sign Analysis
2.6. Statistical Analysis
3. Results
3.1. Comparison of Lesion Signal on T1-Weighted Imaging, T2-Weighted Imaging, Liver Acquisition with Volume Acceleration, and Diffusion-Weighted Imaging Sequences in Different Groups
| Groups | T1WI Signal | T2WI Signal | DWI Signal | LAVA Strengthen | |||||||||||
|---|---|---|---|---|---|---|---|---|---|---|---|---|---|---|---|
| Higher | Wait | Low | Mix | Higher | Wait | Low | Mix | Higher | Wait | Low | Mix | Significant Enhancement | Mild Enhancement | No Enhancement | |
| Recurrence (n = 105) | 0.0 | 3.3 | 85.81 | 17.16 | 90.86 | 0.0 | 0.0 | 15.14 | 97.92 | 0.0 | 0.0 | 8.8 | 89.85 | 16.15 | 0.0 |
| Suspicious (n = 105) | 18.17 | 11.11 | 33.31 | 43.41 | 35.33 | 21.20 | 27.26 | 22.21 | 57.54 | 10.1 | 24.23 | 14.13 | 23.22 | 13.12 | 69.66 |
| Postoperative (n = 105) | 47.45 | 18.17 | 16.15 | 24.23 | 3.3 | 29.28 | 60.57 | 13.12 | 4.4 | 28.27 | 59.56 | 14.13 | 0.0 | 20.19 | 85.81 |
| χ2 /P (three group) | 50.138/0.000 | 39.107/0.000 | 40.895/0.000 | 40.50/0.000 | |||||||||||
| χ2 /P (recurrence group vs. postoperative group) | 41.695/0.000 | 45.405/0.000 | 48.563/0.001 | 42.001/0.000 | |||||||||||
| χ2 /P (recurrence group vs. suspicious group) | 40.701/0.000 | 41.002/0.000 | 45.117/0.004 | 50.067/0.012 | |||||||||||
| χ2 /P (recurrence group vs. suspicious group) | 40.500/0.000 | 40.211/0.000 | 42.885/0.001 | 47.883/0.000 | |||||||||||
Abbreviations: T1WI, T1-weighted imaging; T2WI, T2-weighted imaging; DWI, diffusion-weighted imaging; LAVA, liver acquisition with volume acceleration.
a Values are expressed as percent.
3.2. Operating Characteristic Curve Analysis of the Diagnostic Value of T1-Weighted Imaging, T2-Weighted Imaging, Liver Acquisition with Volume Acceleration, and Diffusion-Weighted Imaging in the Recurrence Group-Postoperative Group
| Signals | AUC (%) | Rating Threshold | Strengthen Signal (%) | Specificity (%) |
|---|---|---|---|---|
| T1WI signal | 75.9 | 2.5 | 95.2 | 61 |
| T2WI signal | 96.3 | 1.5 | 96 | 82.9 |
| DWI signal | 96.8 | 2.5 | 93.4 | 95.2 |
| LAVA strengthen signal | 95.8 | 2.5 | 84.8 | 94.1 |
Abbreviations: T1WI, T1-weighted imaging; T2WI, T2-weighted imaging; DWI, diffusion-weighted imaging; LAVA, liver acquisition with volume acceleration; AUC, area under the curve.
3.3. Comparison of T1-Weighted Imaging, T2-Weighted Imaging, Diffusion-Weighted Imaging and Liver Acquisition with Volume Acceleration Signal Rates Diagnostic Criteria
| Variables | T1WI | T2WI | DWI | LAVA | ||||
|---|---|---|---|---|---|---|---|---|
| 1 | 0 | 1 | 0 | 1 | 0 | 1 | 0 | |
| Suspicious | 73 | 32 | 59 | 46 | 72 | 33 | 22 | 83 |
| Postoperative | 40 | 65 | 18 | 87 | 5 | 100 | 2 | 103 |
| χ2 | 67.925 | 66.303 | 59.733 | 93.333 | ||||
| P-value | 0.012 | 0.000 | 0.000 | 0.000 | ||||
Abbreviations: T1WI, T1-weighted imaging; T2WI, T2-weighted imaging; DWI, diffusion-weighted imaging; LAVA, liver acquisition with volume acceleration.
3.4. Comparison of Lesion Morphology on T1-Weighted Imaging, T2-Weighted Imaging, Liver Acquisition with Volume Acceleration, and Diffusion-Weighted Imaging Sequences in Different Groups
| Groups | T1WI Lesion Morphology | T2WI Lesion Morphology | DWI Lesion Morphology | LAVA Lesion Morphology | ||||||||
|---|---|---|---|---|---|---|---|---|---|---|---|---|
| Nodular | Semilunar | No Displayed | Nodular | Semilunar | No Displayed | Nodular | Semilunar | No Displayed | Nodular | Semilunar | No Displayed | |
| Recurrence | 69.66 | 36.34 | 0.0 | 68.65 | 37.35 | 0.0 | 71.68 | 34.32 | 0.0 | 67.64 | 38.36 | 0.0 |
| Suspicious | 11.10 | 20.18 | 74.72 | 14.13 | 22.20 | 69.67 | 71.68 | 34.32 | 0.0 | 67.64 | 38.36 | 81.77 |
| Postoperative | 0.0 | 0.0 | 105.100 | 0.0 | 2.2 | 103.98 | 0.0 | 2.2 | 103.98 | 0.0 | 0.0 | 105.100 |
| χ2/P-value (three groups) | 22.720/0.002 | 9.058/0.000 | 21.379/0.000 | 27.891/0.000 | ||||||||
| χ2/P-value (recurrence group vs. postoperative group) | 13.319/0.000 | 24.897/0.000 | 14.418/0.000 | 20.398/0.000 | ||||||||
| χ2/P-value (recurrence group vs. suspicious group) | 10.149/0.001 | 7.462/0.001 | 13.877/0.000 | 21.045/0.002 | ||||||||
| χ2/P-value (recurrence group vs. suspicious group) | 24.814/0.000 | 20.870/0.000 | 17.894/0.001 | 19.565/0.000 | ||||||||
Abbreviations: T1WI, T1-weighted imaging; T2WI, T2-weighted imaging; DWI, diffusion-weighted imaging; LAVA, liver acquisition with volume acceleration.
a Values are expressed as percent.
3.5. Combination of T1-Weighted Imaging, T2-Weighted Imaging, Diffusion-Weighted Imaging, and Liver Acquisition with Volume Acceleration Had High Diagnostic Sensitivity and Specificity
| Suspicious Group (N = 105) | Sensitivity (%) | Specificity (%) | Diagnostic Accuracy |
|---|---|---|---|
| T1WI | 78.1 | 61.9 | 70 |
| T2WI | 69.5 | 81 | 75.2 |
| DWI | 76.2 | 93.3 | 84.8 |
| LAVA | 59 | 98.1 | 68.6 |
| T1WI + T2WI | 70.5 | 88.6 | 79.5 |
| T1WI + DWI | 83.8 | 93.3 | 88.6 |
| T1WI + LAVA | 59 | 98.1 | 78.6 |
| T2WI + DWI | 83.8 | 93.3 | 88.6 |
| T2WI + LAVA | 77.1 | 80 | 78.6 |
| DWI + LAVA | 79 | 93.3 | 86.2 |
| T1WI + T2WI + DWI | 90.5 | 93.3 | 91.9 |
| T1WI + DWI + LAVA | 81.7 | 92.3 | 89.5 |
| T2WI + DWI + LAVA | 85.7 | 93.3 | 89.5 |
| T1WI + T2WI + DWI + LAVA | 85.7 | 93.3 | 89.5 |
Abbreviations: T1WI, T1-weighted imaging; T2WI, T2-weighted imaging; DWI, diffusion-weighted imaging; LAVA, liver acquisition with volume acceleration.
4. Discussion
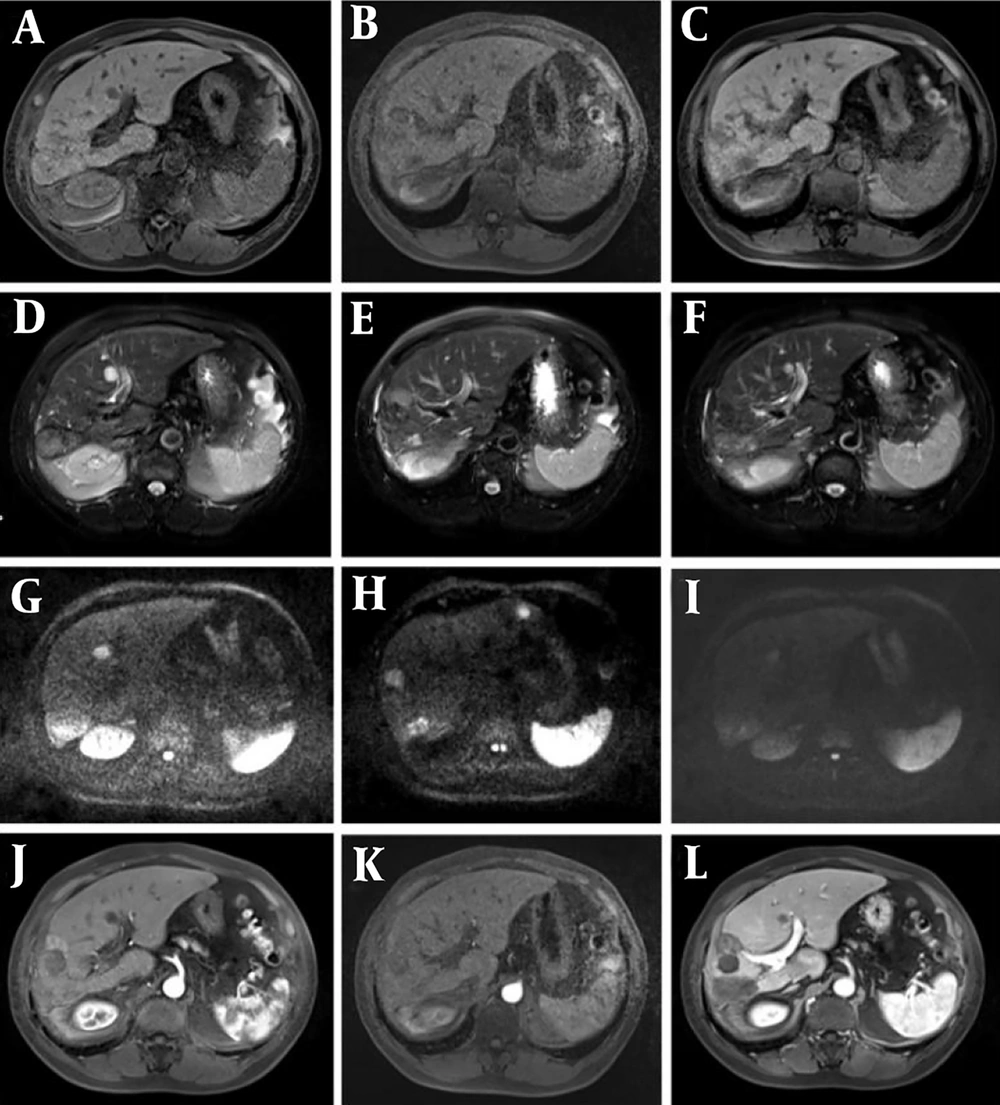
Representative magnetic resonance imaging (MRI) images of the HCC patient. Follow-up was conducted three months after transcatheter arterial chemoembolization (TACE) + radiofrequency ablation (RFA) surgery, and recurrence of the interventional lesion was found after 10 months of follow-up. A - C, T1-weighted imaging (T1WI) phase III (recurrence, suspicious, and postoperative groups); D - F, phase III T2-weighted imaging (T2WI) images; G - I, diffusion-weighted imaging (DWI) phase III images; J - L, LAVE enhanced arterial phase three phase images. When dynamic enhancement of liver acquisition with volume acceleration (LAVA) in the suspicious group showed marginal or nodular enhancement of the lesion, and small abnormal blood vessels were found, attention should be paid to the presence of viable tumor cells.
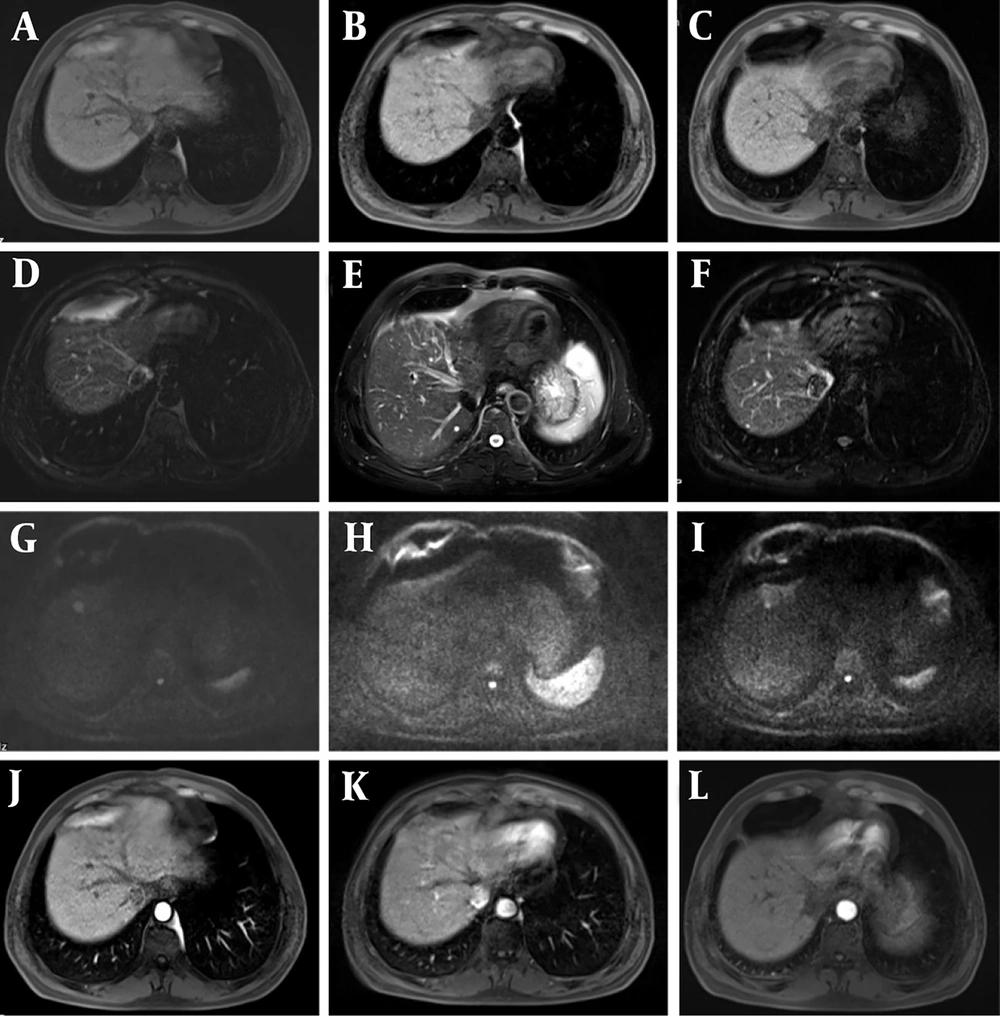
Transcatheter arterial chemoembolization (TACE) + radiofrequency ablation (RFA) observation was performed 2 months after surgery. After 12 months of follow-up, recurrence of the intervention lesion was found. A - C, phase III T1-weighted imaging (T1WI) (recurrence, suspicious, and postoperative groups); D - F, phase III T2-weighted imaging (T2WI) images; G - I, diffusion-weighted imaging (DWI) phase III images; J - L, LAVE enhanced arterial phase three phase images. DWI was sensitive to residual and recurrent lesions, so it presented slightly higher mixed signal shadows.
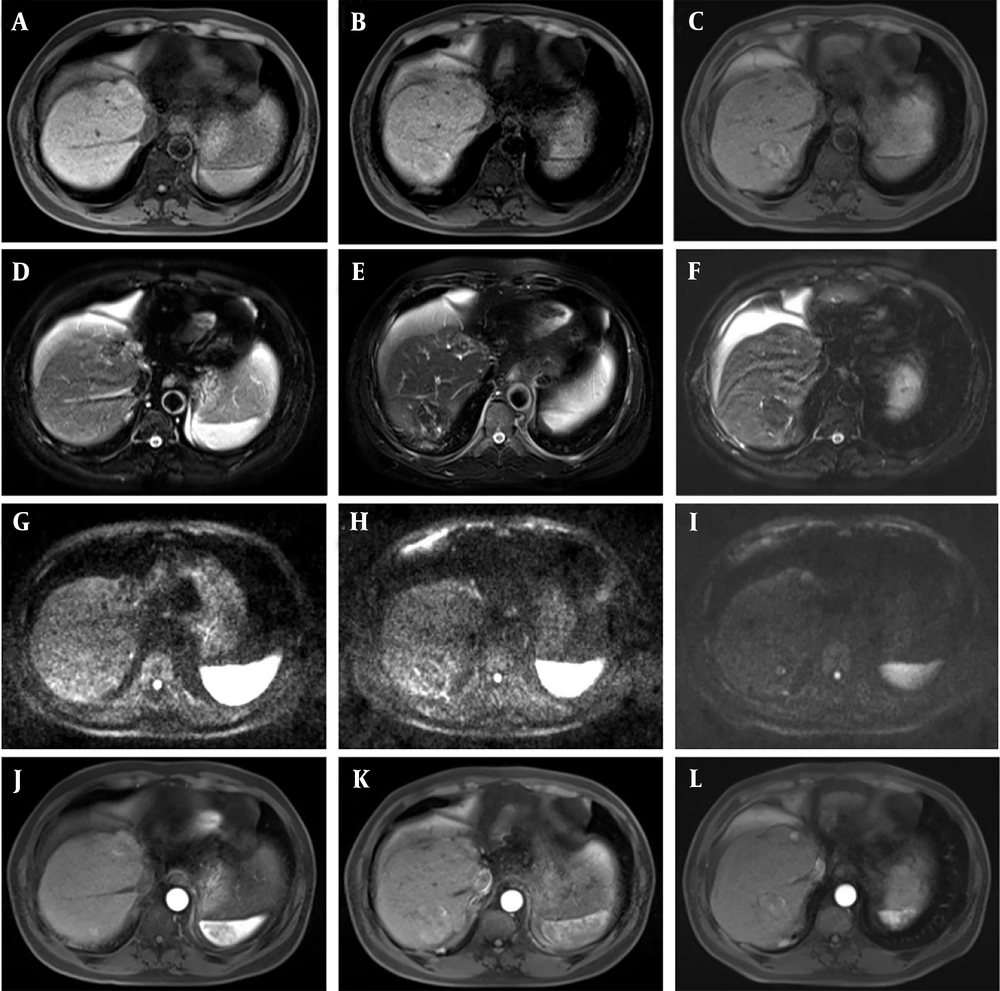
Five months after transcatheter arterial chemoembolization (TACE), a recurrence of the lesion was detected and radiofrequency ablation (RFA) surgery was added. One month after surgery, the patient was enrolled for follow-up, and a recurrence of the interventional lesion was found after 15 months of follow-up. A - C, phase III T1-weighted imaging (T1WI) (recurrence, suspicious, and postoperative groups); D - F, phase III T2-weighted imaging (T2WI) images; G - I, diffusion-weighted imaging (DWI) phase III images; J - L, LAVE enhanced arterial phase three phase images. After TACE combined with RFA surgery, the lesion would shrink over time, and if the lesion increased during follow-up, there was also a high suspicion of local recurrence.


