1. Background
Assessment of liver fibrosis in patients with chronic hepatitis C is useful to decide the optimal timing of antiviral therapy. Liver biopsy has been traditionally the standard for evaluation of liver fibrosis (1), but liver biopsy analysis has several limitations; it is costly and carries a small risk of complications (2). Therefore, it has poor acceptance, especially when repeated measures are required. In addition, there can easily be sampling errors, because only approximately 0.002% of the liver is biopsied, and intra- and inter-observer discrepancies of 10% -20% in assessing hepatic fibrosis have been reported (3, 4).
These limitations led to research for alternative, noninvasive tests for fibrosis assessment, including clinical and serum biomarker algorithms. The number of serum biomarker algorithms for liver fibrosis has increased significantly over the past decade, and they are beginning to be incorporated into routine clinical practice. Many of algorithms have good accuracy in determining advanced fibrosis and cirrhosis. However, there is still a challenge of determining fibrosis stage using inexpensive and easy-to-use markers.
Liver fibrosis is associated with a state of hypoxia. According to the progression of liver fibrosis, characteristic fenestrated phenotype of the sinusoidal epithelial cells is lost, and an organized basement membrane is established, which leads to impairment of oxygen diffusion, even though increased arterial flow provides a large supply of oxygenated blood. This increased resistance to blood flow and oxygen delivery results in hypoxia (5). Hypoxia in the liver parenchyma stimulates the epithelial-to-mesenchymal transition (EMT) of hepatocytes (6). The EMT of hepatocytes means that hepatocytes differentiate into fibroblasts. Hepatocytes from rats with carbon tetrachloride-induced cirrhosis exhibit the characteristics of mesenchymal cells (7). In addition, EMT, especially type II EMT, is related to liver fibrogenesis together with other pro-fibrogenic and pro-inflammatory molecules (8, 9). EMT has a major influence on a shortage of vitamin K uptake (10).
DCP has several variants based on the number of glutamic acid (Glu) residues from 0 to 10. NX-DCP is a DCP variant that contains fewer Glu residues and released due to vitamin K deficiency. Recent studies have shown that the value of NX-des-γ-carboxy prothrombin (NX-DCP) was predominantly increased in the serum of patients with vitamin K deficiency such as warfarin users and obstructive jaundice patients, but basically not in patients with HCC (11). Moreover, the value of NX-DCP could more sensitively reflect a hypoxic state following a shortage of vitamin K uptake (12). However, no studies have shown that NX-DCP is related to liver fibrosis in chronic liver disease.
2. Objectives
In the present study, we aimed to clarify whether NX-DCP could become a new noninvasive model to predict liver fibrosis in hepatitis C virus (HCV)-related liver disease.
3. Patients and Methods
3.1. Ethics Statement
All patients provided a written consent to participate in the study and the protocol was approved by the institutional ethics review board at Kobe University. This study complies with the standards of the Declaration of Helsinki and current ethical guidelines. The URL of the online registry is www.umin.ac.jp/ctr/index.htm, and the clinical trial number is UMIN000014264.
3.2. Study Size
In a pilot study, 12 (60.0%) patients had significant fibrosis (F3-4) and 8 (40.0%) patients did not have significant fibrosis (F0-2). NX-DCP values in patients with F3-4 were 96.0 ± 70.8 (mean ± SD) and those in patients with F0-2 were 46.9 ± 4.6 (mean ± SD). To calculate either estimates of sample size or power for differences in means, a Two Arm Normal (13) was used in this study. The formulae are the classic two sample formulae for sample size and power for two sample normal problems with constant variance. From the formulae, it was calculated that the expected sample size would be 88 and the expected power of 0.90. Therefore, total sufficient sample size in our study was estimated to be 100.
3.3. Patients
We performed a prospective cohort study on a total consecutive group of 101 patients (mean age of 64.6 years, range: 31-92 years; male/female ratio: 44:57) who underwent liver biopsy for HCV-related liver disease between December 2010 and January 2013 at Kobe University Hospital. All patients were Japanese, aged over 18 years and had chronic hepatitis C of varying severity. Determination of chronic hepatitis C was made using standard diagnostic criteria; serological detection of HCV antibodies and positive serum HCV-RNA by polymerase chain reaction for at least six months. All patients were naïve to antiviral treatment. We excluded patients with other etiologies of chronic liver disease, such as hepatitis B, autoimmune liver disease, nonalcoholic steatohepatitis, Wilson’s disease, hemochromatosis, human immunodeficiency virus infection and severe alcoholics (more than 30 grams of ethanol daily). We also excluded patients who had hepatocellular carcinoma, those who were taking warfarin, antibiotics, or vitamin K supplementation before laboratory measurements, and those who had an absolute contraindication for liver biopsy.
3.4. Clinical Evaluation
The clinical evaluation was performed based on the results of a physical examination and laboratory measurements. To rule out biliary obstruction and the presence of liver focal lesions, abdominal ultrasonography was performed for all patients upon inclusion in the study. Laboratory measurements included platelets, prothrombin time (PT), PT-INR, aspartate aminotransferase (AST), alanine aminotransferase (ALT), γ-glutamyltranspeptidase (γ-GTP), Alb, total bilirubin (T-Bil), total cholesterol (T-Cho), alpha fetoprotein (AFP), and DCP, which were measured by electrochemiluminescence immunoassay (ECLIA) automatic equipment Picolumi 8220 (Eidia, Tokyo, Japan) using a monoclonal antibody, MU-3. A novel parameter, NX-DCP, which is more specific for premature prothrombin produced under the condition of vitamin K absence, was measured by Picolumi 8220 using monoclonal antibodies P-16 and P-11 (EIDIA, Tokyo, Japan) as described previously (12). Each concentration of DCP and NX-DCP in serum sample was calculated by comparing the sample’s luminescence to that of a calibrated solution of known standard for DCP and NX-DCP. The equipment was calibrated through adjustment of the luminescence count of the Picolumi 8220 using the control substance HOT-80 (EIDIA, Tokyo, Japan). All patients were evaluated using the abovementioned noninvasive liver fibrosis markers, such as AST/ALT ratio (AAR) (14), AST-to-platelet ratio index (APRI) (15-18), modified APRI (19), Fib-4 (20-22), the Göteborg University Cirrhosis Index (GUCI) (23, 24), the Lok index (25), the Forns index (26), the Hui score (27), age platelet index (API) (28), cirrhosis discriminating score (CDS) (29) and the Pohl score (30, 31).
3.5. Histological Assessment
A percutaneous liver biopsy was performed using 16-18 gauge Monopty needles (Bard Biopsy Systems, AZ, USA) on the same day as the laboratory measurements in all patients. Liver specimens of 15-20 mm in length with four minimal portal tracts were fixed in 10% neutral formalin, and then processed and embedded in paraffin. Sections were stained with hematoxylin and eosin and Masson trichrome stains for detection of fibrosis. The sections were then analyzed by an expert pathologist blinded to patients. The degree of fibrosis was scored according to the New Inuyama classification (32) from F0 to F4. Significant fibrosis was defined as F3-4.
3.6. Statistical Analysis
Statistical analyses were conducted using SPSS Statistics 18.0 (SPSS Inc., Chicago, IL, USA). Data distributions were evaluated with 2-sided Fisher’s exact test and Chi squared test as appropriate. Normally distributed variables were compared using the Student’s t test, and non-normally distributed variables were assessed using the Wilcoxon rank sum test. The Jonckheere-Terpstra trend test was performed to examine a monotone trend for the class parameter. Univariate analyses of demographic factors were performed to investigate the differences between the two groups. Significant univariate factors were introduced into the multivariate analyses. The multivariate analyses were performed using backward stepwise logistic regression. To assess the diagnostic accuracy, nonparametric area under the curve (AUC) was calculated using MedCalc Version 12.7.7 (MedCalc Software, Ostend, Belgium). Receiver operator characteristic (ROC) curves were constructed to assess the AUC. The diagnostic accuracy was also evaluated by the Youden’s index J. The optimal cut-off point was the score that produced the maximal sum of sensitivity and specificity. A calibration plot of multivariate factors was constructed to confirm the difference between the predictive value and the observed average. The DeLong method with Bonferroni correction was performed to make pairwise comparisons of ROC curves. Values of P < 0.05 were considered significant and p values in Table 4 indicate differences compared with AUC = 0.05.
4. Results
4.1. Factors Associated With Presence of Significant Fibrosis
According to the inclusion and exclusion criteria, 101 patients were included and 19 patients were excluded. Among 101 patients (the mean age of 64.6 years; SD = 11.8), there were 44 males (43.6%) and 57 females (56.4%). Sixty-one (60.4%) patients had significant fibrosis (F3-4). Demographic, laboratory and histological features of patients with HCV-related liver disease are presented in Table 1. Table 2 shows univariate analyses of factors associated with the presence of significant fibrosis. Age, PT-INR, AST, ALT, AFP and NX-DCP were significantly higher in patients with significant fibrosis (F3-4) than those without it (F0-2) (P = 0.000, 0.000, 0.000, 0.017, 0.000, and 0.002, respectively). Platelet, PT, Alb, and T-cho were significantly lower in patients with significant fibrosis than those without it (P = 0.000. 0.004, 0.000, and 0.000, respectively). These 10 significant univariate factors were introduced into backward stepwise multivariate logistic regression analyses, and then three factors (age, platelets, and NX-DCP) were selected for the multivariate analyses (P = 0.001, 0.000, and 0.026, respectively) (Table 3).
For the whole sample, NX-DCP values ranged from 14 to 2967. Using the Jonckheere-Terpstra trend test, the increase in NX-DCP was significantly related to the increase in fibrosis stage (p = 0.006) (Figure 1). NX-DCP was significantly higher in patients with significant fibrosis (F3-4) than those without it (F0-2) (P = 0.002) (Figure 2). The differences were also statistically significant when patients with cirrhosis (F4) were compared with those without it (F0-3) (P = 0.001). However, NX-DCP could not significantly discriminate F0-1 from F2-4 (P = 0.141), or F0 from F1-4 (P = 0.271).
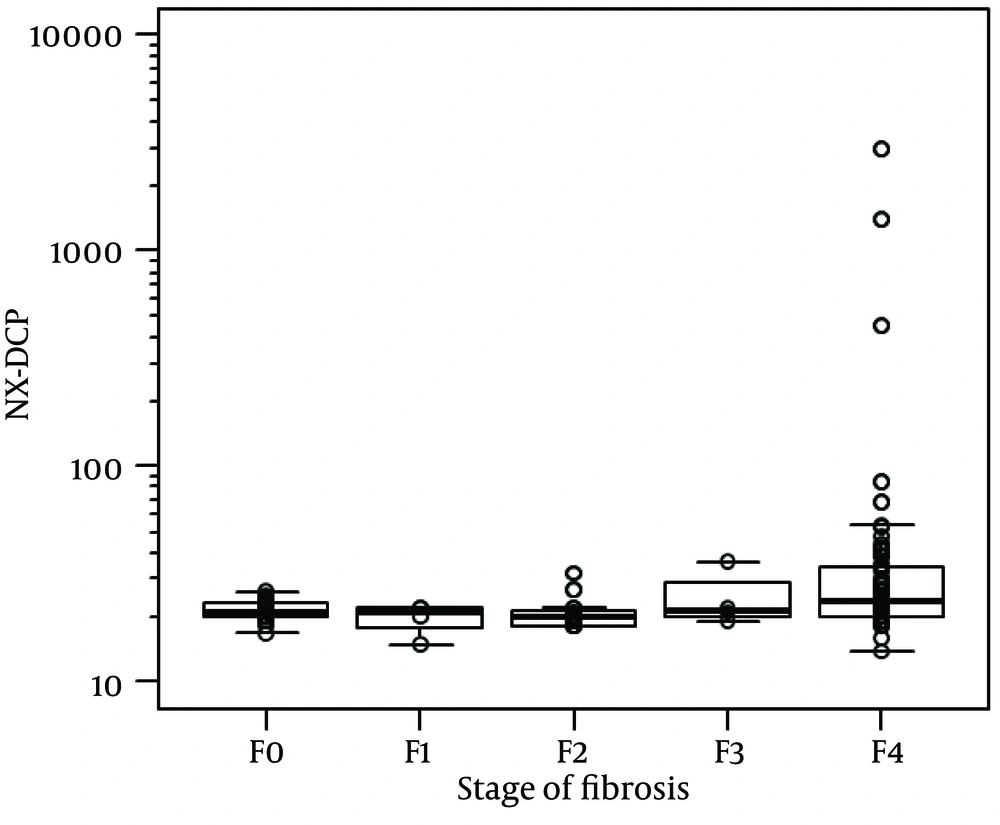
Figure 1.
The numbers of HCV-related patients with F0, F1, F2, F3, and F4 were 20, 4, 16, 4, and 57, respectively. Using the Jonckheere-Terpstra trend test, the increase of NX-DCP was significantly related to the increase of fibrosis stage (P = 0.006).
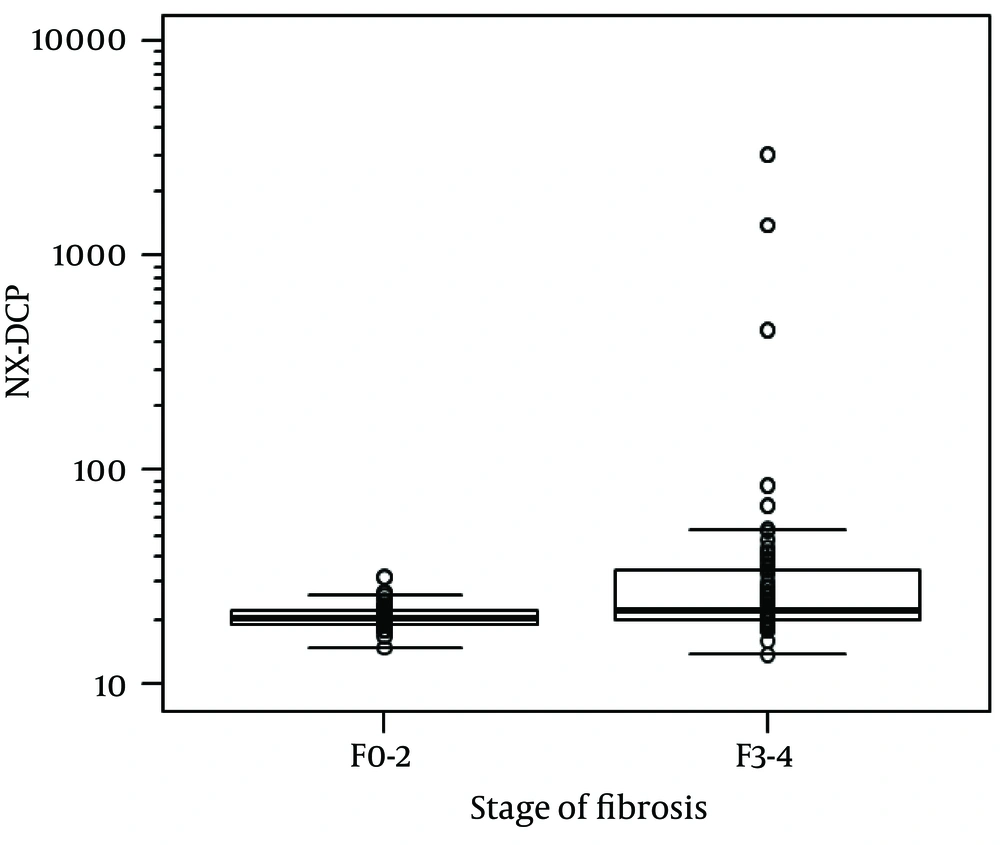
Figure 2.
NX-DCP was significantly higher in patients with significant fibrosis (F3-4) than in those without it (F0-2) (P = 0.002).
Table 1.
| Variable | Patients, n = 101 |
|---|---|
| Age, y | 64.6 ± 11.8 (31-92) |
| Gender, male/female | 44/57 |
| Height, cm | 158.0 (141.2-175.1) |
| Body weight, kg | 57.4 ± 11.2 (32.2-84.0) |
| BMI, kg/m2 | 22.7 ± 3.5 (15.7-32.8) |
| Platelet, ×109/l | 115 (46-370) |
| PT, % | 100.0 (48.2-100.0) |
| PT-INR | 0.99 (0.82-1.71) |
| AST, IU/L | 43 (14-237) |
| ALT, IU/L | 39 (8-309) |
| γ-GTP, IU/L | 30 (7-467) |
| Alb, g/dL | 4.0 (1.7-4.9) |
| T-Bil, mg/dL | 0.8 (0.3-3.2) |
| T-Cho, mg/dL | 163.6 ± 35.8(71-278) |
| HCV serotype, 1/2 | 79/22 |
| AFP, ng/mL | 8(2-211) |
| DCP, mAU/mL | 25(7-1468) |
| NX-DCP, mAU/mL | 21(14-2967) |
| Liver fibrosis | |
| F0 | 20 |
| F1 | 4 |
| F2 | 16 |
| F3 | 4 |
| F4 | 57 |
a Abbreviations: BMI, Body Mass Index; PT, Prothrombin Time; INR, International Normalized Ratio; AST, Aspartate Aminotransferase; ALT, Alanine Aminotransferase; γ-GTP, γ-Glutamyltranspeptidase; Alb, Albumin; T-Bil, Total Bilirubin; T-cho, Total Cholesterol; AFP, Alpha Fetoprotein; DCP, Des-γ-Carboxy Prothrombin.
b The Degree of fibrosis was scored according to the New Inuyama Classification from F0 to F4.
c Data represent n, mean ± SD (range), or median (range).
Table 2.
Univariate Analyses of Factors Associated With the Presence of Significant Fibrosis a
| Factors | F0-2, n = 40 | F3-4, n = 61 | P Value |
|---|---|---|---|
| Age, y | 58.6 ± 12.4 (31-81) | 68.5 ± 9.6 (44-92) | 0.000 b |
| Gender, male/female | 14/26 | 30/31 | 0.160 d |
| Height, cm | 155.9 (141.2-175.1) | 159.4 (143.4-172.6) | 0.391 c |
| Body, weight/kg | 57.2 ± 12.4 (37.0-84.0) | 57.5 ± 10.8 (32.2-83.6) | 0.454 b |
| BMI, kg/m2 | 23.0 ± 3.9 (16.0-32.8) | 22.6 ± 3.3 (15.7-29.7) | 0.657 b |
| Platelet, ×109/l | 210 (88-370) | 94 (46-227) | 0.000 c |
| PT, % | 100.0 (67.1-100.0) | 96.5 (48.2-100.0) | 0.004 c |
| PT-INR | 0.95 (0.82-1.21) | 1.02 (0.83-1.71) | 0.000 c |
| AST, IU/L | 28 (14-237) | 56 (17-235) | 0.000 c |
| ALT, IU/L | 26 (10-309) | 44 (8-280) | 0.017 c |
| γ-GTP, IU/L | 27 (7-285) | 34 (11-167) | 0.124 c |
| Alb, g/dL | 4.3 (3.3-4.9) | 3.9 (1.7-4.7) | 0.000 c |
| T-Bil, mg/dL | 0.8 (0.4-2.3) | 0.9 (0.3-3.2) | 0.100 c |
| T-cho, mg/dL | 181.8 ± 35.1 (122-278) | 152.0 ± 31.2 (71-228) | 0.000 b |
| HCV serotype (1/2) | 31/9 | 48/13 | 0.887 d |
| AFP (ng/mL) | 5 (2-55) | 11 (2-211) | 0.000 c |
| DCP (mAU/mL) | 24 (13-43) | 28 (7-1468) | 0.155 c |
| NX-DCP (mAU/mL) | 21 (15-32) | 22 (14-2967) | 0.002 c |
a Abbreviations: BMI, Body Mass Index; PT, Prothrombin Time, INR: International Normalized Ratio; AST, Aspartate Aminotransferase; ALT, Alanine Aminotransferase; γ-GTP, γ-Glutamyltranspeptidase; Alb, Albumin; T-Bil, Total Bilirubin; T-cho, Total Cholesterol; AFP, Alpha Fetoprotein; DCP, Des-γ-Carboxy Prothrombin.
bTwo sample t-test.
d Chi squared test.
cWilcoxon rank sum test.
Table 3.
Multivariate Analyses of Significant Univariate Factors Associated With the Presence of Significant Fibrosis a
| Variable | B | SE | P value | Exp (B) | 95% CI of Exp (B) | |
|---|---|---|---|---|---|---|
| lower limit | upper limit | |||||
| Age, y | 3.250 | 0.068 | 0.001 | 1.201 | 1.075 | 1.341 |
| Platelet | -3.770 | 0.083 | 0.000 | 0.588 | 0.447 | 0.775 |
| NX-DCP | 2.220 | 0.189 | 0.026 | 1.362 | 1.037 | 1.787 |
a Abbreviation: B, Regression coefficient; CI, Confidential interval; Exp (B), odds ratio; SE: standard error.
4.2. Diagnostic Accuracy of NX-DCP and Known Noninvasive Liver Fibrosis Markers Associated With the Presence of Significant Fibrosis
By calibration plot of NX-DCP in patients with or without significant fibrosis (Supplementary Figure 1), there was no discrepancy between the predicted value and the observed average. The 95% confidence interval (CI) also did not deviate from a diagonal line, which demonstrates a complete conformity. NX-DCP value discriminated well between patients with and without significant fibrosis (AUC: 0.687; 95% CI: 0.586 to 0.788). The optimal cut-off point was 23 and the sensitivity and specificity were 49.2% and 87.5%, respectively (Table 4). APRI, modified-APRI, Fib-4, GUCI, the Lok index, the Forns index, the Hui score, API, CDS, and the Pohl score also discriminated well between patients with and without significant fibrosis. On the other hand, AAR did not discriminate well between these two groups (Table 4). The ROC curves of these markers are presented in Figure 3.
Table 4.
Diagnostic Accuracy of NX-DCP and Known Noninvasive Liver Fibrosis Markers Associated With the Presence of Significant Fibrosis a
| Item | Cutoff value | Sensitivity, % | Specificity, % | PPV, % | NPV, % | Accuracy, % | AUC | Youden | P value |
|---|---|---|---|---|---|---|---|---|---|
| NX-DCP | > 23 | 49.2 | 87.5 | 85.7 | 53.0 | 64.4 | 0.687 | 0.367 | 0.0003 |
| AAR | > 0.9545 | 80.3 | 35.0 | 65.3 | 53.8 | 62.4 | 0.563 | 0.153 | 0.2942 |
| APRI | > 0.9521 | 88.5 | 75.0 | 84.4 | 81.1 | 83.2 | 0.843 | 0.635 | < 0.0001 |
| Modified APRI | > 0.0012 | 91.8 | 76.9 | 86.2 | 85.7 | 86.0 | 0.876 | 0.687 | < 0.0001 |
| Fib-4 | > 3.6244 | 85.2 | 87.5 | 91.2 | 79.5 | 86.1 | 0.927 | 0.728 | < 0.0001 |
| GUCI | > 0.914 | 88.3 | 71.4 | 84.1 | 78.1 | 82.1 | 0.831 | 0.598 | < 0.0001 |
| Lok index | > 0 | 70.5 | 87.5 | 89.6 | 66.0 | 77.2 | 0.864 | 0.580 | < 0.0001 |
| Forns index | > 6.6415 | 95.1 | 76.9 | 86.6 | 90.9 | 88.0 | 0.923 | 0.720 | < 0.0001 |
| Hui score | > 4.1449 | 69.2 | 88.9 | 93.1 | 57.1 | 75.4 | 0.843 | 0.581 | < 0.0001 |
| API | > 7 | 90.2 | 80.0 | 87.3 | 84.2 | 86.1 | 0.913 | 0.702 | < 0.0001 |
| CDS | > 6 | 71.7 | 91.4 | 93.5 | 65.3 | 78.9 | 0.886 | 0.631 | < 0.0001 |
| Pohl score | 0 | 68.9 | 87.5 | 89.4 | 64.8 | 76.2 | 0.782 | 0.564 | < 0.0001 |
a Abbreviations: AAR, Aspartate Aminotransferase-to-Alanine Aminotransferase Ratio; APRI,
Aspartate Aminotransferase-to-Platelet ratio Index; GUCI, Goteborg University Cirrhosis Index; API, age platelet index; CDS, cirrhosis discriminating score; PPV, positive predictive value; NPV, negative predictive value; AUC, area under the curve.
By pairwise comparison of ROC curve between NX-DCP and the other markers other than AAR, the AUC of NX-DCP showed no significant differences compared with those of APRI, modified-APRI, GUCI, the Lok index, the Hui score, CDS, and the Pohl score (P = 0.360, 0.086, 0.763, 0.086, 1.000, 0.053, and 1.000, respectively). On the other hand, the AUC of NX-DCP was significantly worse than that of Fib-4, the Forns index and API (P = 0.001, 0.001, and 0.002, respectively). The specificity of NX-DCP was higher than the sensitivity, with a lower negative predictive value (NPV) and a higher positive predictive value (PPV). Regarding the specificity of the markers, NX-DCP showed good specificity compared with Fib-4, the Forns index and API.
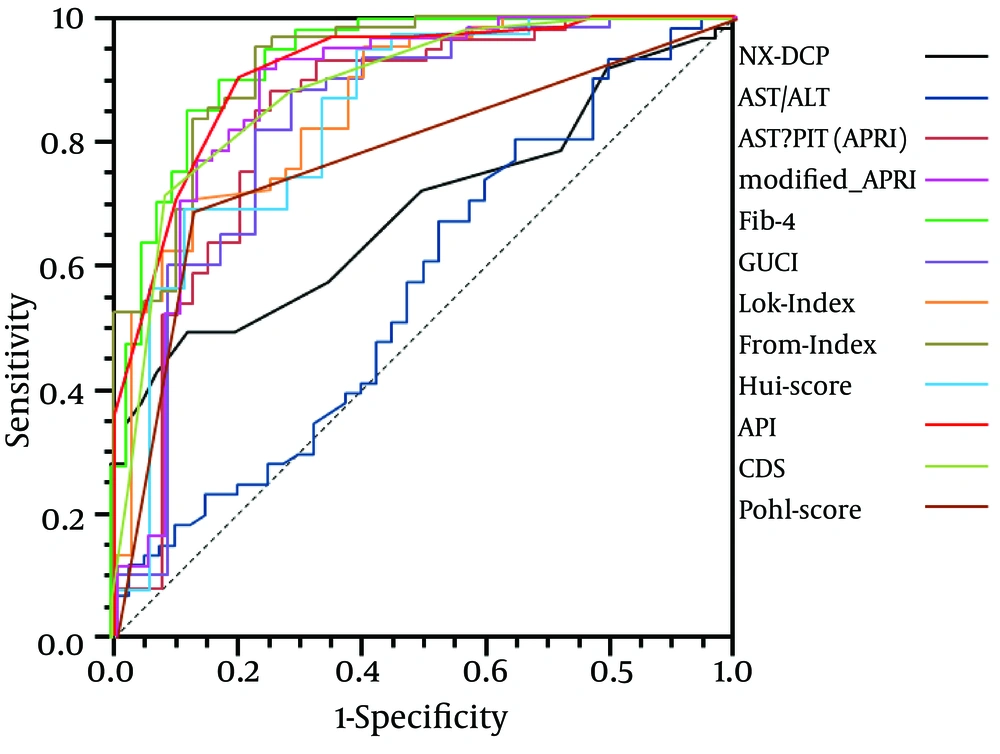
Figure 3.
NX-DCP, APRI, modified-APRI, Fib-4, GUCI, Lok index, Forns index, Hui score, API, CDS, and Pohl score also discriminated well between patients with and without significant fibrosis. On the other hand, AAR did not discriminate well between the two groups (Figure 4).
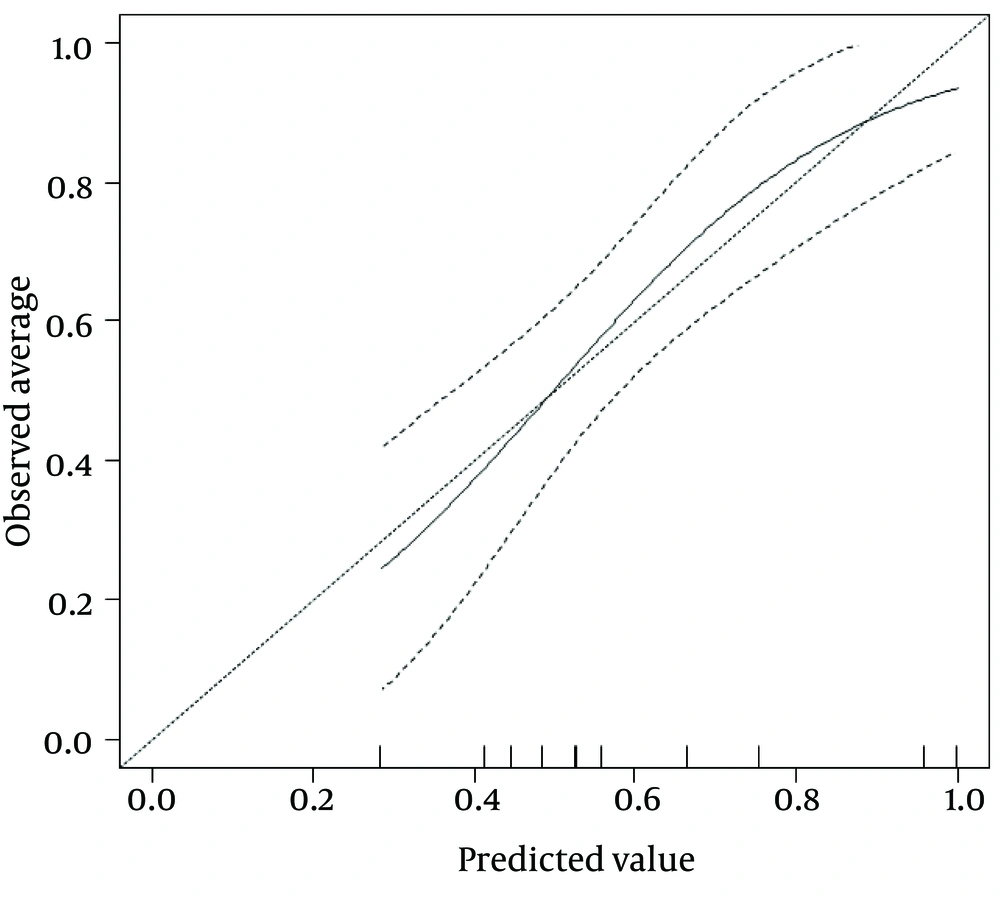
Figure 4.
By calibration plot of NX-DCP in patients with or without significant fibrosis, there was no discrepancy between the predicted value and the observed average. The 95% CI (the portion surrounded by two broken lines) also did not deviate from a diagonal line, which indicates complete conformity.
5. Discussion
Developing noninvasive models to predict liver fibrosis is needed instead of an invasive liver biopsy. For the availability of models in the clinical setting, low cost and simplicity are essential. Using models that require specific equipment for measurement is limited in some institutions, even though they are less expensive than a liver biopsy. DCP has been routinely used as a tumor marker for hepatocellular carcinoma in the clinical setting. NX-DCP can be measured easily by ECLIA using P-11 and P-16 monoclonal antibodies without specific apparatus, and is less expensive than a liver biopsy. Moreover, NX-DCP is a single parameter, not a complicated combination model, so it is simple and easily understandable.
Our study showed that NX-DCP was an independent factor associated with significant fibrosis. In addition, NX-DCP was positively associated with the stage of fibrosis and related to the presence of cirrhosis. NX-DCP could more sensitively reflect a hypoxic state following a shortage of vitamin K uptake (12). The more the liver fibrosis progressed, the stronger the hypoxia in the liver parenchyma became. This suggested that the value of NX-DCP is related to the severity of liver fibrosis, accompanied by hypoxia in liver parenchyma. However, NX-DCP could not discriminate patients with or without mild fibrosis. It was considered that liver parenchyma with mild fibrosis only undergoes a slight hypoxic change. In addition, it was speculated that the results would show a rather large overlap.
Our study showed that age and platelets were independent factors associated with significant fibrosis. The older the studied patients became, the more the liver fibrosis advanced. This could be explained by the longer duration of exposure to HCV infection. The age of acquisition of infection was also important, because the rate of fibrosis progression was higher in older patients irrespective of duration of infection (33, 34). Thrombocytopenia in patients with significant fibrosis may be due to reduced hepatic production of thrombopoietin, increased splenic sequestration of platelets secondary to portal hypertension or myelosuppressive action of HCV (35, 36).
We also performed a pairwise comparison of ROC curves between NX-DCP and known noninvasive fibrosis markers. The predictive ability of NX-DCP showed good performance, similar to those of APRI, modified-APRI, GUCI, the Lok index, the Hui score, CDS and the Pohl score. However, NX-DCP showed poor performance compared with Fib-4, the Forns index, and API. It was considered that NX-DCP had a lower sensitivity than these models. Each parameter of Fib-4, the Forns index and API had higher sensitivity, so these parameters would be better screening tools for significant fibrosis. On the other hand, NX-DCP had a higher specificity for detection of significant fibrosis. Therefore, a measurement of NX-DCP would be important for detection and diagnosis of significant fibrosis, even when the other noninvasive markers were measured simultaneously. NX-DCP could become a noninvasive diagnostic tool for significant fibrosis.
In conclusion, NX-DCP correlated positively with the stage of fibrosis and could discriminate well between HCV-related patients with or without significant fibrosis. Moreover, NX-DCP had a similar predictive ability to APRI, modified-APRI, GUCI, the Lok index, the Hui score, CDS, and the Pohl score. NX-DCP is easy to use, because only a single parameter is different from the known parameters, giving a new noninvasive prediction tool for fibrosis. Moreover, NX-DCP had a higher specificity, so NX-DCP could also become a noninvasive diagnostic tool for significant fibrosis. However, we consider that the sensitivity of NX-DCP is not necessarily sufficient for screening patients with significant fibrosis, so large-scale studies should be conducted to improve the ability of NX-DCP to predict significant fibrosis in HCV-related liver disease. Moreover, future combination of NX-DCP and the abovementioned serum noninvasive fibrosis markers might offer better results and performance, although this needs to be confirmed.