1. Background
Nine main genotypes (A - I) and a ‘putative’ genotype J of human hepatitis B virus (HBV) are presently known and their serotype classification as well as the geographical distribution has been extensively documented (1-3). The HBV is divided into four major serotypes (adr, adw, ayr, and ayw) based on antigenic epitopes present on its envelope proteins (3, 4). Hepatitis B Virus causes the death of over one million people per year by liver failure or hepatocellular carcinoma (5). Hepatitis B Virus viral nucleocapsid encloses the viral DNA and a DNA polymerase that has reverse transcriptase activity (6). The genome of HBV consists of partially double stranded DNA and has about 3200 base pairs (7, 8). The virus has four overlapping open reading frames (ORFs) including large S region (PreS/S), PreC/C, and P and regulatory elements of transcription, replication and encapsidation, within these ORFs (9). For example, the surface open reading frame (S) is entirely overlapped by that encoding the polymerase (P) (10).
Any mutation with loss of protein activity has destructive effects on virus, and loss of some point mutations may have not any obvious effect, because the amino acid may not be changed or the functional structures of the RNA or protein may not be affected (11). Number of these silent mutations may be part of the quasi-species, which are subsequently selected by the host immune response (11). Some of these silent mutations are identified as rare codons that may have an important role in protein folding and activity that should be considered in HBV genome studies.
Genetic code redundancy allows most amino acids to be encoded by multiple codons that are non-randomly distributed along coding sequences (12). Some of synonymous codons in every organism are used with higher frequency, while others have very low frequency that have been introduced in the literature as rare codons, low usage codons or unflavored codons (13). The result of previous studies show that rare codons tend to have depleted concentration of tRNAs that have an effect on ribosomes and pause the growing polypeptide until the rare activated tRNA brings the next amino acid (14, 15). Furthermore, some studies have shown that rare codons, which often exist in large clusters, instead randomly scatter across genes that are known as rare codon clusters (RCCs) (13). Rare codon clusters have been identified in genes of the wide variety of organisms (13, 16). Furthermore, many highly expressed genes contain rare codon clusters and a correlation between the position of RCCs in mRNA and protein domain boundaries was observed (17). The clustering of rare codons indicates that there are forces that influence the selection of rare codons within mRNA sequences (16). Several studies have reported the replacement of rare codons with frequent synonymous ones that have a variety of effects on structure and functions of proteins (18). These results indicate that RCCs are functionally important for protein activity, and have an important role in all aspects of protein expression, mRNA stability, folding, secretion, and protein-protein interactions (13, 19). Because of the importance of RCCs in function and activity of proteins, we studied for the first time the RCCs in the genome and proteins of HBV (20).
2. Objectives
The aim of this study was to identify rare codon clusters in the genome and the position of hepatitis B virus proteins’ structure.
3. Methods
At first, the protein family accession numbers (Pfam), number of seven overlapping open reading frames (ORFs) including PreS/S, P protein, hepatitis core antigen, X protein, N-terminal domain of DNA polymerase, external core antigen and truncated HBeAg protein were identified using Pfam search tool database (21, 22). Then, these IDs of Pfams were analyzed in Sherlocc program that detects statistically relevant conserved rare codon clusters (19). Subsequently, the structures of TrEMBL entries from Sherlocc program were studied for HBV proteins that were obtained from PDB database or by homology modeling. Translated EMBL Nucleotide sequence data library (TrEMBL) is a computer-annotated supplement of SWISS-PROT that contains all the translations of EMBL nucleotide sequence entries not yet integrated in SWISS-PROT (23).
3.1. Sequence Retrieval and Organization
The genome of HBV is made of circular DNA, but it is unusual because the DNA is not fully double-stranded (24). There are four known genes encoded by the HBV genome, called C, X, P, and S and by proteolytic processing and different “start” (ATG) codons, the HBV proteins are produced (25). This shows that this genome, in comparison with other hepatitis viruses such as HCV, has high complexity and needs to be carefully evaluated. For accurately bioinformatics’ analysis, the nucleotide sequences and features of the genotypes of HBV were retrieved from GenBank (http://www.ncbi.nlm.nih.gov/nuccore/X70185.1). Since the subtype adw2 is found to genotype A, B and C, this genome was used in further bioinformatics analysis (26, 27) (Table 1).
Table 1.
The Characteristics of Gene and Protein of the Subtype adw2 (GenBank: X70185.1)a
| Polymerase | Env Protein | X Protein | C Protein | |
|---|---|---|---|---|
| Codon location | 5-ATGCCTCAT…. GAGACCACCG-3 | 5-ATGGGAGGTT.... CATGCAGTGGAA..3 | 5-ATGGCTGCTA..ACCTCTGCC-3 | 5-ATGGACATTG..ATCTCAATGT-3 |
| Frame | 1 | 1 | 3 | 2 |
| Codon number | 421 - 1620 | 2854 - 3221 | 1374 - 1835 | 1901 - 2455 |
| Nucleotide number | 1200 | 368 | 462 | 555 |
| N-terminal protein | MPHLLV | MGGWSSK | MAARLY- | MDIDPYKE- |
| C-terminal protein | PLHVAWRPP | DSHPQAMQW | PCNFFTSA | SQSRESQC |
| Amino acid number | 400 | 122 | 154 | 214 |
aAs show, the polymerase and Env protein were translated in frame1, the X protein translated from frame 3 and P protein translated from frame2 in DNA sequence of HBV.
3.2. Protein Family Accession Numbers Identification
The Pfam database is a large collection of protein domain families. Each family is represented by multiple sequence alignments and Hidden Markov Models (HMMs). The Pfam version 30.0 was produced at the European Bioinformatics Institute using a sequence database called Pfamseq, which is based on UniProt release 2016 - 02. At first, by analysis the HBV genome (GenBank: X70185.1) in sequence search option of Pfam 30.0 (http://pfam.xfam.org/search/sequence), six-frame translation of this gene and their characteristics were obtained. Protein Family accession numbers 30.0 searches for DNA sequence (GenBank: X70185.1) for Pfam-A matches using the normal Pfam-A HMMs and GA cut-offs. When a Pfam model is built, the Pfam team keeps track of per-sequence and per-domain scores of every sequence in a large non-redundant database. The GA cutoffs (gathering cutoffs) are the scores that are used as cutoffs in constructing Pfam (28). Furthermore, by description and families of these proteins, the identification of protein family accession numbers (Pfam) of HBV proteins is done in UniProt database (http://www.uniprot.org). On the other hand, by introducing the DNA sequence of HBV (GenBank: X70185.1) into Pfam search tool (http://pfam.xfam.org/search#tabview=tab1), it searches for matching Pfam families.
3.3. Identification of Rare Codon Clusters
These Pfam IDs were separately analyzed in Sherlocc program. Sherlocc is a PERL written program able to scan Pfam protein families for conserved regions that have a low codon usage frequency (rare codon clusters) (19). This program is efficient enough to perform large-scale analysis of the proteome via the Pfam protein family database. For this, these Pfam IDs were introduced in the PFAM Accession ID menu of Sherlocc Finder Interface (http://bcb.med.usherbrooke.ca/sherlocc_finder.php) and the RCCs of HBV proteins and their properties were detected and shown as a table in Sherlocc Finder Interface. Furthermore, by appropriate translation table the correspondence of the nucleotide sequence with the amino-acid sequence provided in the Pfam alignment was verified and the species-specific codon usage frequencies were retrieved using the Kazusa codon usage frequency online database (29). By clicking on the Pfam IDs in left column, the accurate location of these RCCs in nucleotide sequence of HBV protein were shown. Analysis of these Pfam IDs in Sherlocc program allowed discrimination of positions of the alignment occupied by rare codons. Finally, estimation of the locus of these RCCs in HBV genome and HTML output of Sherlocc program were conducted.
3.4. Analysis of Rare Codon Clusters in the Structure of Hepatitis B Virus Proteins
For analysis of RCC in the structure of HBV proteins, the structures of TrEMBL entries proteins were studied in PDB databank (30). TrEMBL is a computer-annotated protein sequence database supplementing the Swiss-Prot Protein Sequence Data Bank. This study showed that crystal structures of HBV proteins, reported by the Sherlocc Program, have not been completely reported in protein data bank. For this reason, by submission of sequences of hepatitis core antigen, large envelope protein and DNA polymerase in Swiss model (31) and I-TASSER server (32), 3D models of these proteins were prepared. Stereochemical analyses of the homology model were carried out using the Ramachandran plot obtained from PROCHECK. PROCHECK checks the stereochemical quality of a protein structure producing a number of PostScript plots and residue-by-residue geometry (33). The stereochemical parameters are described in detail by Morris et al. (1992). These parameters are not included in standard refinement procedures and are available in Table 1 of Appendix A from manual option of PROCHECK home page (http://www.ebi.ac.uk/thornton-srv/software/PROCHECK/). A Ramachandran plot that is also known as a Ramachandran diagram or a [φ, ψ] plot, is a way to visualize energetically allowed regions for backbone dihedral angles ψ against φ of amino acid residues in proteins’ structure (34). This plot was used for theoretical evaluation of different conformations of the ψ and φ angles that are possible for an amino-acid residue in a protein and structure validation. Furthermore, 3D structures of the HBV proteins and locations of RCCs were visualized and studied using Swiss PDB Viewer software (35). The relative assessment of models show that results of I-TASSER server have better quality and we used these results in the final study.
4. Results
Genetic properties of HBV genotypes of this study are listed in Table 2. The results show that HBV DNA sequence had nine protein families in three frames.
Table 2.
Genetic Properties of Hepatitis B Virus Genotypes
| Locus | DEFINITION | Gene Bank | Accession | Version | Protein ID | |
|---|---|---|---|---|---|---|
| HBV-A | AP007263 | HBV genotype A DNA, complete genome, isolate: HB-JI444AF | AP007263.1 | AP007263 | AP007263.1 GI:62006064 | "BAD91279.1" |
| 3221 bp DNA circular VRL 05- DEC-2008 | "BAD91280.1" | |||||
| "BAD91276.1" | ||||||
| "BAD91277.1" | ||||||
| "BAD91278.1" | ||||||
| HBV-B | LC036263 | HBV genotype B DNA, complete genome, isolate: BAJT2001-1 | LC036263.1 | LC036263 | LC036263.1 GI:930588558 | "BAS53332.1" |
| 3215 bp DNA circular VRL 25-SEP-2015 | ""BAS53333.1" | |||||
| "BAS53331.1 | ||||||
| HBV-C | LC064755 | HBV genotype C DNA, complete genome, isolate: BRJT2014-1B | LC064755.1 | LC064755 | LC064755.1 GI:973412648 | "BAU25818.1" |
| 3215 bp DNA circular VRL 29-APR-2016 | "BAU25819.1" | |||||
| "BAU25817.1" | ||||||
| HBV-D | HE815465 | HBV genotype D, serotype ayw3, complete genome | HE815465.1 | HE815465 | HE815465.1 GI:394556647 | "CCH63720.1" "CCH63722.1" |
| 3182 bp DNA circular VRL 09- JUL-2012 | "CCH63723.1" | |||||
| "CCH63724.1" | ||||||
| "CCH63725.1" | ||||||
| "CCH63726.1" | ||||||
| HBV-E | HE974384 | HBV genotype F2 complete genome, isolate Mart-B26 | HE974384.1 | HE974384 | HE974384.1 GI:399923529 | "CCK33758.1" |
| 3212 bp DNA circular VRL 01- AUG-2013 | "CCK33757.1" | |||||
| "CCK33759.1" | ||||||
| "CCK33760.1" | ||||||
| HBV-F | DQ823095 | Hepatitis B virus genotype F isolate BA45, complete genome | DQ823095.1 | DQ823095 | DQ823095.1 GI:112145641 | "ABI13477.1" |
| 3215 bp DNA circular VRL 29-MAR-2011 | "ABI13478.1" | |||||
| "ABI13479.1" | ||||||
| "ABI13480.1" | ||||||
| "ABI13481.1" | ||||||
| "ABI13482.1" | ||||||
| "ABI13483.1" | ||||||
| HBV-G | HE981176 | Hepatitis B virus complete genome, genotype G, clone ARG56.5.9 | HE981176.1 | HE981176 | HE981176.1 GI:402169060 | "CCK86668.1" |
| 3248 bp DNA circular VRL 14-DEC-2012 | "CCK86669.1" | |||||
| "CCK86670.1" | ||||||
| "CCK86665.1" | ||||||
| "CCK86666.1" | ||||||
| "CCK86667.1" | ||||||
| HBV-H | AB275308 | Hepatitis B virus DNA, complete genome, genotype: H. | AB275308.1 | AB275308 | AB275308.1 GI:122703723 | "BAF45141.1" |
| 3215 bp DNA circular VRL 16- JAN-2007 | "BAF45142.1" | |||||
| "BAF45143.1" | ||||||
| HBV-I | - | - | - | - | - | - |
| Hepatitis B Virus X, C, P and S overlapping ORF's | X70185 | Hepatitis B Virus X, C, P and S overlapping ORF's. | X70185.1 | ACCESSION X70185 | X70185.1 GI:59455 | |
| 3221 bp DNA linear VRL 04-JUN-1998 |
4.1. Detection of Rare Codon Clusters
After selection of the HBV genome (GenBank: X70185.1) and translation in six frames, Pfam search tool found nine protein families in three frames and provided a striking example of overlapping genes. In the DNA search results page (Figure 1), each open reading frame is represented graphically. The any domain, positions represented by the standard Pfam domain representations and the positions of the stop codons location in the reading frame are highlighted by red square lollipops. This search tool accepts sequences up to 80000 nucleotides in length, and searches the Pfam-A HMM library using the gathering threshold. The location of nine significant hits and properties of these hits are reported in Figure 1.
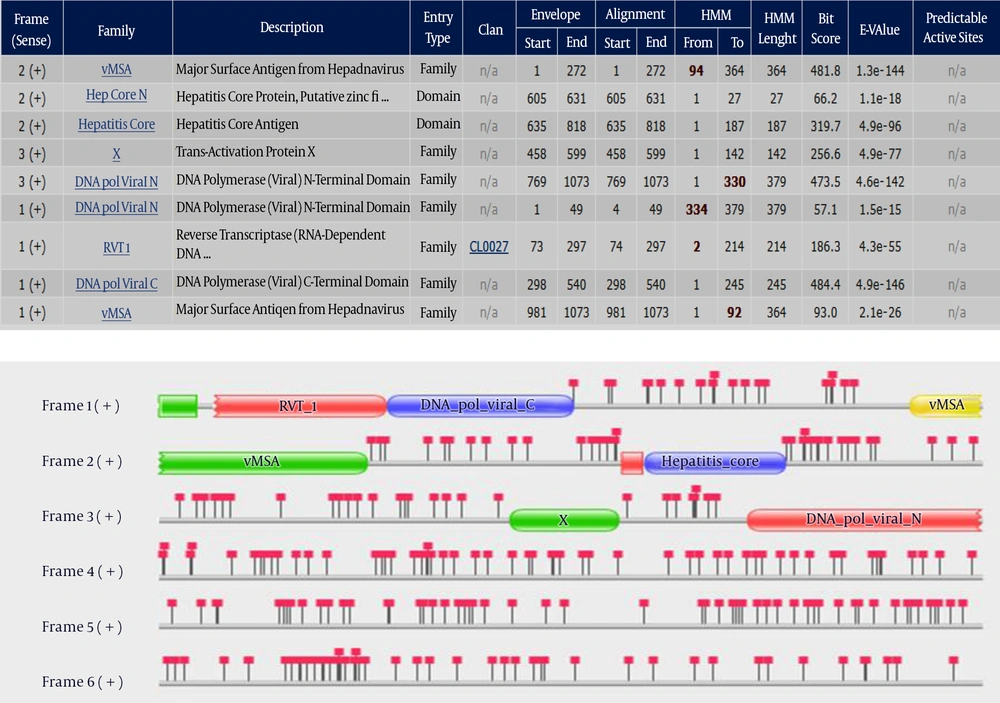
Figure 1.
The six reading frames are displayed graphically in the top box. All three reading frames from the positive strand contain matches to Pfam-A, which are tabulated below. The positions of stop codons are indicated by the square lollipops. HMMn is the consensus of the HMM. Capital letters indicate the most conserved positions.
The envelope co-ordinates delineate the region on the sequence where the match has been probabilistically determined to lie, whereas the alignment co-ordinates delineate the region over which HMMER is confident that the alignment of the sequence to the profile HMM is correct (36). As shown in Figure 1, with DNA translation at frame 1, four protein families were identified that included DNA pol viral N (envelope 1 - 49), RVT 1 (envelope 73 - 297), DNA pol viral C (envelope 298 - 540) and vMSA (envelope 981 - 1073). The DNA pol viral N domain is at the N terminus of hepadnavirus P proteins and covers the so-called terminal protein and the spacer region of the protein. A reverse transcriptase (RT) is an enzyme used to generate complementary DNA (cDNA) from an RNA template, a process termed reverse transcription. It is mainly associated with retroviruses. However, non-retroviruses also use RT (for example, the hepatitis B virus, a member of the Hepadnaviridae, which are dsDNA-RT viruses, while retroviruses are ssRNA viruses) (37). The DNA pol viral C domain is at the C terminus of hepatitis B-type viruses P proteins and represents a functional domain that controls the RNase H activities of the protein. The vMSA family contains the major surface antigens of the hepatitis viruses (Hepadnaviridae). The protein is most likely required for an early step of the life cycle involving entry or uncoating of virus particles.
Frame 2 translation produced the vMSA (envelope 1 - 272), Hep core N (envelope 605 - 631) and Hepatitis core (envelope 635 - 818). The Hep core N domain represents a short region found at the N terminus of some viral capsid (HBcAg) proteins from various hepatitis B virus (HBV), which is a major human pathogen. The conservation of four Cys residues suggests that this region acts as a zinc-binding domain. The core antigen of hepatitis viruses possesses a carboxyl terminus rich in arginine. On this basis it was predicted that the core antigen would bind DNA (38).
However, frame 3 translation produced the X (envelope 458 - 599) and DNA pol viral N (envelope 769 - 1073). The hepatitis B virus (HBV) X gene shares sequences with both the polymerase and precore genes, carries several regulatory signals critical to the replicative cycle, and its product has a trans-activating function (39). The trans-activating function is probably associated with a tumourigenic potential of HBx, since x gene sequences, encoding functional HBx, have been repeatedly found integrated into the genome of liver carcinoma cells (40).
As mentioned in material and methods and shown in Figure 1, HBV genome was translated with different frame HBV to create the HBV proteins. These nine significant hits were studied in Uniprot database (www.uniprot.org) and the Pfam of these hits were detected (Table 3). Furthermore, these Pfams were studied in the Sherlocc program. Sherlocc program detected statistically relevant conserved RCCs and anywhere that this did not exist, the program could not detect the RCCs. In this program, a statistically significant threshold can be chosen that allows discrimination of positions of the alignment occupied by rare codons with a statistically significant low codon usage frequency average (19). From this, the threshold can be chosen and will allow us to discriminate positions of the alignment occupied by rare codons. All codon usage frequency averages under this threshold are tagged as slow. Results showed that this program has not identified RCCs in the external core antigen (PF08290) and truncated HBeAg protein (PF08290). This indicates that these proteins have no statistically relevant conserved RCCs. However, the single rare codon may be in these proteins that needs more analysis. On the other hand, RCCs become identified in Hepatitis core antigen (PF00906) large envelope protein S (PF00695), X protein (PF00739), DNA polymerase (viral) N-terminal domain (PF00242) and Protein P (Pf00336) (Table 3). However, if all of the HBV genotypes have a similar sequence of DNA and protein particularly in these positions, these RCCs may be found in all HBV genotypes. To answer this question we need comprehensive and precise studies. On the other hand, these RCCs have no effects on the overlapping genes as with change of the translation frame, these codon are completely changed. This was evaluated in further studies. The Pfam ID, number of RCCs and codon usage average threshold are listed in Table 3.
Table 3.
The Number of Rare Codon Clusters, Protein Family Accession Numbers ID and Codon Usage Threshold in Hepatitis B Virus Genome
| HBV Protein | PFAM ID | RCC Number | Codon Usage Threshold |
|---|---|---|---|
| Hepatitis core antigen | PF00906 | 2 | 17 |
| Large and small envelope protein S | PF00695 | 2 | 18 |
| X protein | PF00739 | 5 | 18 |
| N-terminal domain of DNA polymerase | PF00242 | 3 | 16 |
| Protein P | Pf00336 | 1 | 18 |
| External core antigen | PF08290 | 0 | - |
| Truncated HBeAg protein | PF08290 | 0 | - |
The core antigen (PF00906) of hepatitis viruses possesses a carboxyl terminus rich in arginine. Hepatitis virus is composed of an outer envelope of host-derived lipid containing the surface proteins, and an inner protein capsid that contains genomic DNA. The monomer fold is stabilized by a hydrophobic core. The capsid is assembled from dimers via interactions involving a highly conserved arginine-rich region near the C terminus. This viral capsid acts as a core antigen, the major immunodominant region lying at the tips of the alpha-helical hairpins that form spikes on the capsid surface. However, the external core antigen family (PF08290) or Hep_core_N is a short region that was found at the N-terminus of some hepatitis core proteins. Its conservation of four Cys and his suggests a zinc-binding domain.
Studying HTML output that reports of the TrEMBL entries in Sherlocc program showed that some of the relevant conserved RCCs do not cover the TrEMBL entries from HBV proteins. For this reason, we given up the results of Sherlocc program analysis for X protein (Ground squirrel hepatitis virus (GSHV) and Protein P (Woodchuck hepatitis virus) Pfam IDs. The Pfam ID, Swiss-Prot or TrEMBL entries, organism, RCCs position usage and other detailed information are listed in Table 4.
Table 4.
Sherlocc Program’s Output and Rare Codon Clusters Characteristics in Hepatitis B Virus Proteins
| HBV Protein | PFAM ID | Swiss-Prot or TrEMBlentries | Organism | Residue Length of Alignment | RCC Position | RCC Usage Frequency | RCC Middle Point | Fraction of the Pfam Occupied by RCC |
|---|---|---|---|---|---|---|---|---|
| Hepatitis core antigen | PF00906 | HBEAG_HHBV | Heron HBV (HHBV) | 265 | 224 - 234 | 16.836 | 229 | 0.0641509434 |
| 251 - 255 | 16.047 | 252 | ||||||
| Large and Small Envelope Protein S | PF00695 | HBSAG_HHBV | Heron HBV (HHBV) | 400 | 53 - 56 | 15.148 | 54 | 0.0475000000 |
| 70 - 84 | 15.453 | 76 | ||||||
| X Protein | PF00739 | X_GSHV | Ground Squirrel Hepatitis Virus (strain 27) (GSHV) | 145 | 10 - 24 | 16.973 | 16 | 0.6068965517 |
| 29 - 83 | 15.928 | 55 | ||||||
| 95 - 99 | 14.979 | 96 | ||||||
| 122 - 129 | 15.348 | 125 | ||||||
| 139 - 143 | 16.948 | 140 | ||||||
| DNA Polymerase (viral) N-terminal domain | PF00242 | Q80MM5_HBV | Woolly Monkey HBV | 425 | 59 - 62 | 14.567 | 60 | 0.0352941176 |
| 214 - 217 | 15.296 | 215 | ||||||
| 407 - 413 | 15.991 | 409 | ||||||
| Protein P | PF00336 | Q918N4_9HEPA | Woodchuck Hepatitis Virus | - | 225 - 228 | 12.932 | 226 | 0.0163265306 |
4.2. Analysis of Rare Codon Clusters’ positions in Hepatitis B Virus mRNA Sequences
After identification of RCCs, the relative position of these RCCs was evaluated in HBV mRNA sequences (41). Figure 2 shows estimated locus’s of these Rare Codon Clusters in DNA genome of HBV.
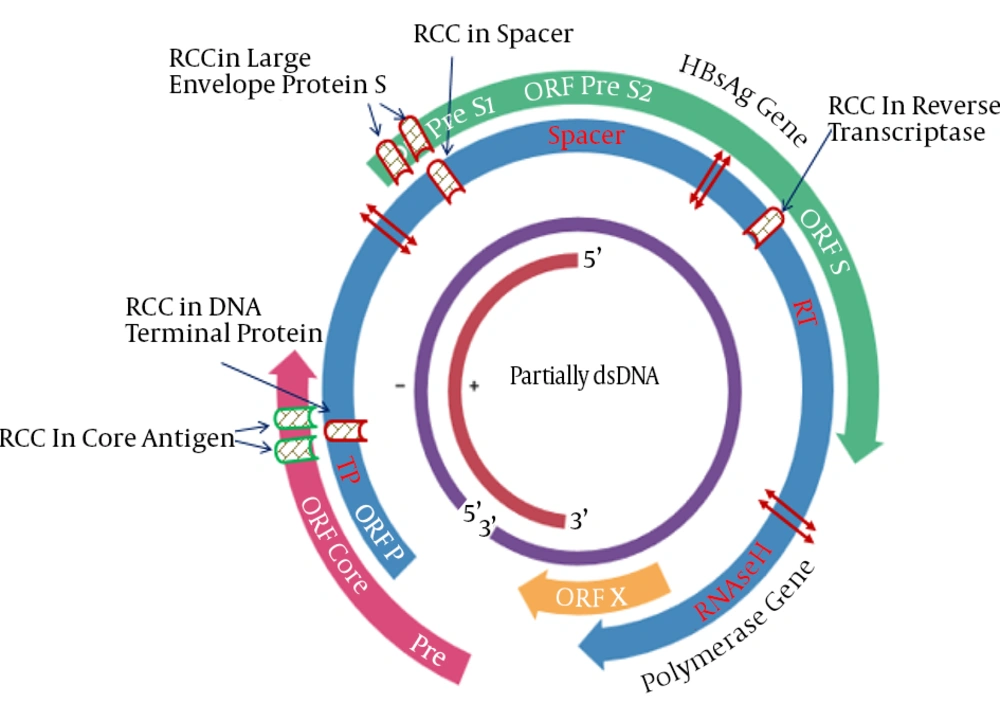
Figure 2.
The approximate position of TP. Spacer, RT and RNaseH were shown as previous studies.
The polymerase gene has four functional domains including the Terminal Protein (TP), Spacer (SP), Reverse Transcriptase (RT), and RNase H. These analysis show that polymerase gene has three RCC that are located in TP, spacer and RT. The situation of RCC in TP and spacer were similar to the position of RCC in ORF core and PreS1, respectively. Furthermore, the special and accurate position of RCCs in the HBV genome was obtained. The HTML output of Sherlocc program and positions of RCCs are shown in considered ‘slow’ and tagged in orange.
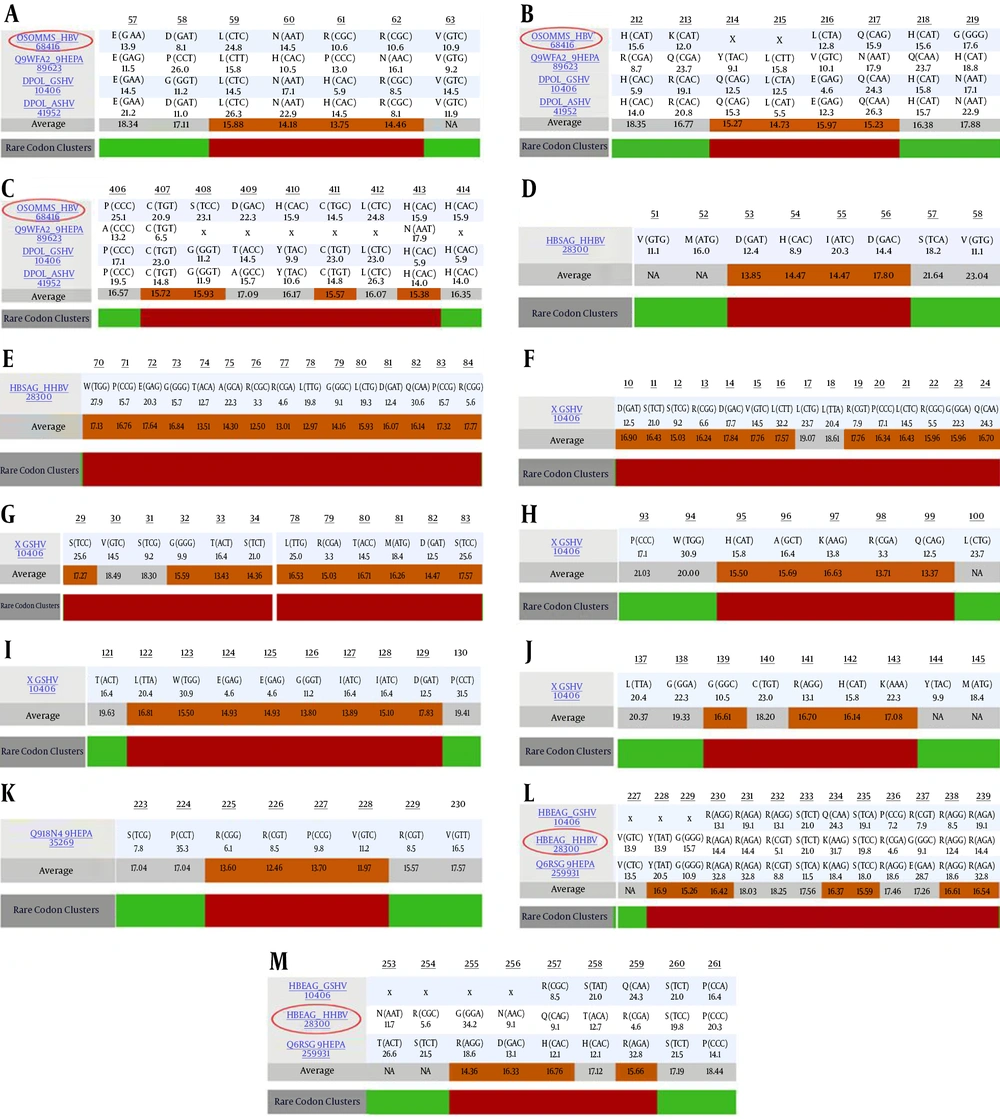
Figure 3.
A, B, C, DNA polymerase (viral) N-terminal domain; D, E, Large envelope protein S; F, G, H, I, J, X protein; K, Protein P and Hepatitis core antigen (l, m). At the bottom (gray row), average codon usage frequency was calculated at each position by the first window displayed in bold. Each row represents a protein from the alignment and displays the amino acid, its corresponding codon and the corresponding codon usage frequency (bold). Averages under the selected threshold are considered ‘slow’ and tagged in orange.
4.3. Rare Codon Clusters in the Structure of Hepatitis B Virus Proteins
In HBV genome, seven RCCs were found in hepatitis core antigen, large envelope protein S and DNA polymerase proteins. Furthermore, by submitting sequences of hepatitis core antigen (HBEAG_HHBV), large envelope protein S (HBSAG_HHBV) and DNA polymerase (Q80MM5_HBV) in Swiss Model (31) and I-TASSER servers (32), 3D models of these proteins were achieved. Next, the PROCHECK server was used for Ramachandran plot analysis of the models (Figure 4).
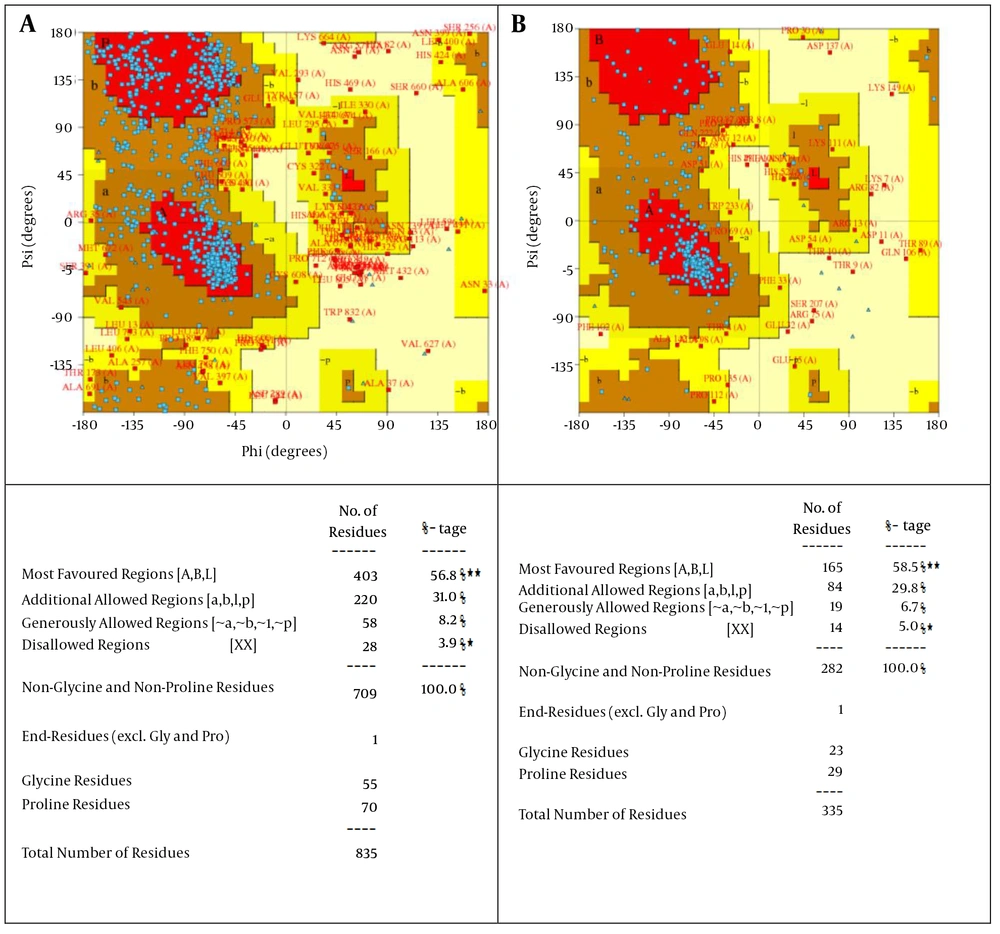
Figure 4.
This plot shows the dihedral angles Psi and Phi of amino acid residues. Each amino acid residue is shown as a dot on a graph of φ vs. ψ, more commonly known as a Ramachandran plot or Ramachandran map. Residues are shown as blue dots. The residues, which lie in most favored regions (ABL) are shown in red curves and the residues, which lie in additional allowed regions (A, B, l, and P) are in dark and yellow curves.
The Ramachandran plot is a fundamental tool in the analysis of protein structures. The Ramachandran plot is the 2D plot of the φ-ψ torsion angles of the protein backbone. It provides a simple view of the conformation of a protein (34, 42). This plot gives the percentage of residues in favorable and disallowed regions. Analysis of the modeled L-protein from HBSAG-HHBV and DNA polymerase protein in PROCHECK showed that 96.1% and 95% of the residues are located in the favored region and 3.9% and 5% in disallow region of the Ramachandran plot, respectively (Figure 4). The reference set and resulting φ and ψ distributions are described in structure validation by Cα geometry: φ, ψ and Cβ deviation (43).
The TrEMBL entry that Sherlocc program has identified for hepatitis core antigen was HBEAG_HHBV, and by Swiss-Model and I-TASSER server (32). This TrEMBL entry sequence is used for obtaining a 3D model of this protein. The Heron hepatitis core antigen protein sequence has 261 residues and two rare codon clusters are found in the C terminal of HBEAG_HHBV sequence from amino acids 228 to 239 and from amino acids 255 to 259. The overall structure of Heron hepatitis core antigen was not determined and therefore Swiss-model and I-TASSER server could not be used for modeling the entire sequence. However, the results of this modeling showed that these rare codon clusters are located in the end of C-terminal sequence of HBEAG_HHBV and have been deleted, leading to mature and secreted HBEAG_HHBV protein.
For large envelope protein S, the Sherlocc program identified TrEMBL entries HBSAG_HHBV. The large envelope protein S in HBSAG_HHBV has 400 residues and two RCCs were found in poly-protein extending from amino acids 53 - 56 and 70 - 84 located in pre-S1 domain of the L-protein. The crystal structure of pre-S1 domain of the L-protein has not been determined and we tried to model the structure of this protein.
The results of modeling showed that C-terminal S region of this sequence was excellently modeled but the N-terminal S region was not excellent. No crystal structure of pre-S1 domain of L-protein or similar species have been determined, so Swiss-model and I-TASSER server were not able to provide a satisfactory model for the pre-S1 domain. Figure 5 shows L-protein modeled and positions of RCCs.
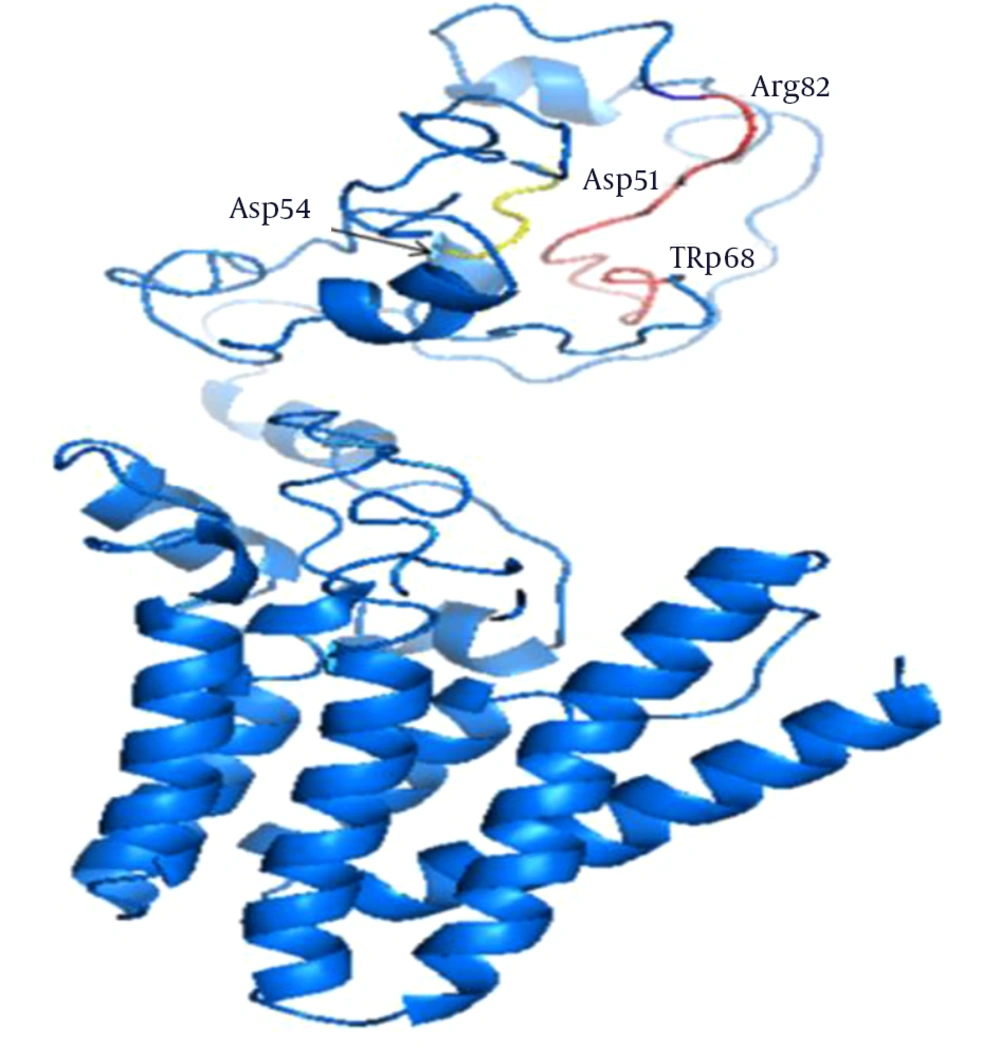
Figure 5.
The overall structure is in blue color, except RCCs Asp51-Asp54 in yellow and Trp68-Arg82 in red.
Sherlocc program identified TrEMBL entries Q80MM5_HBV for DNA polymerase. The DNA polymerase in Q80MM5_HBV has 835 residues and three RCCs were found in polymerase based on Sherlocc program alignment extending from amino acids 59 - 62, 214 - 217 and 407 - 413. However, based on the sequence of Q80MM5_HBV polymerase, these RCC positions showed little change. Figure 6 shows positions of these RCCs in structure of DNA polymerase of HBV proteins.
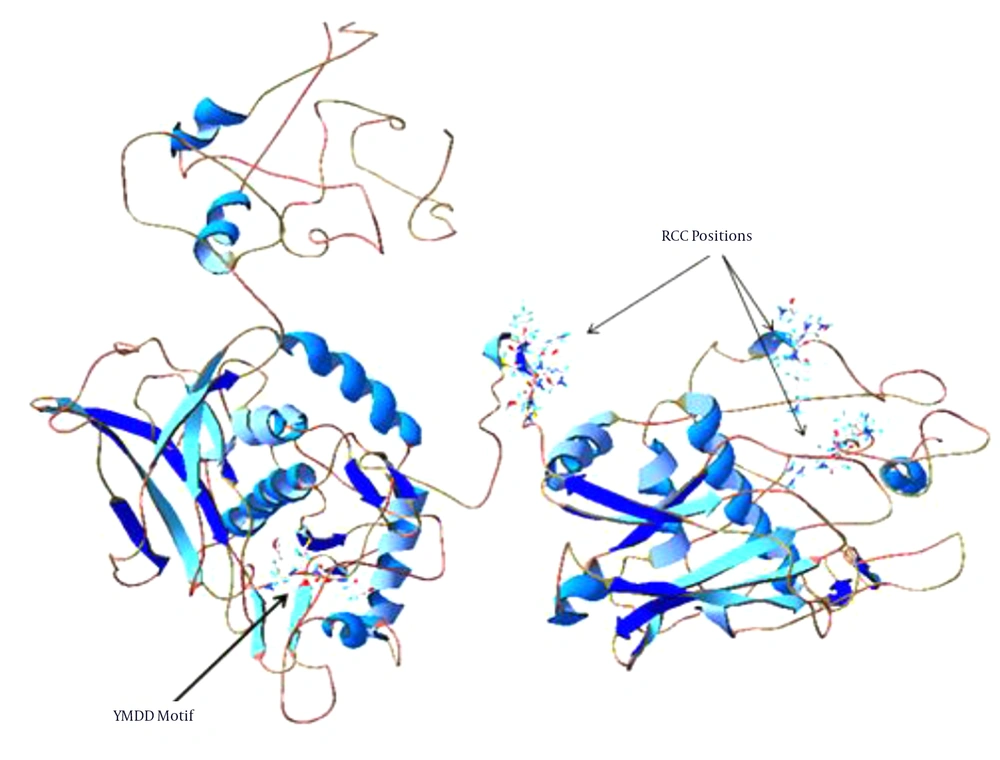
Figure 6.
The position of YMDD motif and RCCs are marked with arrows.
5. Discussion
The genome of HBV is made of circular DNA, but it is unusual because the DNA is not fully double-stranded. One end of the full-length strand is linked to the viral DNA polymerase. The genome is 3020 - 3320 nucleotides long (for the full-length strand) and 1700 - 2800 nucleotides long (for the short length-strand) (24). The negative-sense (non-coding) is complementary to the viral mRNA. The viral DNA is found in the nucleus soon after infection of the cell. Translation of mRNA is regulated by interactions with RNA-binding proteins and structural and non-structural RNA elements (44). One of the significant features of viral genome translation is identification of genetic elements, either RNA sequences or protein domains, which may modulate the viral genome translation. However, position of RCCs and their structural patterns in RNA may be important and open a new research field for extending the possible cures for many disorders or viral infections (20). The Sherlocc program and the online Sherlocc Finder Interface are efficient tools that can be used to study the widespread translational pauses in protein families (2). In the present study, the Sherlocc program was used to analyzes the RCCs in HBV genome and then identify the location of these RCCs in the structure of HBV proteins. The three-dimensional structures of biomolecules provide a wealth of information on their biological function and evolutionary relationships. In many aspects of modern biology, studying the RCCs in structure of proteins is very important. Results of this study were interesting and showed that HBV has seven RCC that may play an essential role in ensuring proper folding of protein chains. Although HBV infection can largely be prevented by use of a safe and effective vaccine, not everyone is vaccinated and there is no vaccine for people who are already chronically infected. Therefore, there is a continuous need for antiviral drugs to suppress viral replication or eliminate the infection. Hepatitis B virus DNA polymerase (HDP) has been of considerable interest as a target for treatment of HBV infections in the last decade (45). Currently, some agents have been approved for HBV treatment. However, issues of practicality, high cost, effectiveness, and severe adverse reactions have limited the use of these agents for the treatment of chronic HBV (46). Therefore, bioinformatics knowledge on rare codon evaluation and homology modeling that provide a new insight in the HBV genome and proteins, can be advantageous for overcoming this challenge. We have previously modeled the structure of HCV proteins, recombinant IL-24, firefly luciferase and cytosine deaminase and have a good experience in homology modeling technique (20, 47-49). In this regard and for the first time, the detection of RCCs and their position in genome and protein of HBV was conducted.
Hepatitis core antigen is driven from a 25-kDa precursor, which is directed to the secretory pathway by a 19-amino acid long signal sequence that is cleaved and produces P22 (22 kDa) (50, 51). P22 is processed further in a post-endoplasmic reticulum compartment by removal of a 34 amino acid-long arginine-rich domain located at its C-terminus, leading to mature and secreted HBeAg (52, 53). In HBV genome, a single open reading frame encodes the envelope proteins, which is translated from three different in-frame start codons (54). The L-protein contains three distinct regions: the N-terminal pre-S1, the central pre-S2, and the C-terminal S regions (55). The M protein includes the pre-S2 and S regions, whereas the S protein consists of the S domain only (55). The infectivity of HBV is directly dependent on the L-protein that is included in the viral envelope through lateral interactions with S (55). Jaoude et al. demonstrated that in addition to a receptor-binding site that was previously identified in the pre-S1 domain of the L-protein, this domain is responsible for determination of infectivity resides in the antigenic loop of HBV envelope proteins (55). As previously mentioned, this domain has an essential role in HBV life cycle and the tertiary structure of this domain provides these special features and these RCCs may have a critical role in proper folding (27, 28). The genome map of HBV illustrates the overlap of the surface protein and polymerase genes (2, 56, 57).
For detection of the one hidden layer of codon usage information that lie in the rare codon clusters, the sequence nucleotide of HBV genome was retrieved, translated in six frames to generate a set of protein sequences and genome map of HBV analyzed in the Pfam search tool and Pfam accession numbers of HBV proteins were identified. The Pfam is a comprehensive collection of protein domains and families represented as multiple sequence alignments (58).
The RCCs have a very critical role in protein synthesis and folding and many studies support the existence of the widespread functional role for RCCs across species (19, 40, 59). With introducing these Pfam in Sherlocc program, the position of RCC was detected. For better evaluation of these RCCs, the 3D structure of HBV proteins was modeled and evaluated by the Ramachandran plot. This plot showed that these models have a low percentage of disallowed amino acid and have a high quality structure. The Ramachandran plot data is very important and showed that the homology modeling process was reliable. Hence, the RCCs and functional elements location were evaluated in the structure of HBV proteins with very low error frequency. This ensuring of the structure can help in understanding the mechanism of protein folding and creation of new pharmaceutical ideas. Consequently, these models are reliable and used for further analysis.
PreS1 contains 108, 118, or 119 amino acids (aa), depending on the genotype, preS2 domain is 55 aa long, and S-domain (S) contains 226 aa. In this study, two RCC that were identified in pre-S1 domain of the L-protein were selected. These RCCs have unknown functions but this function may be vital and may support proper folding of pre-S1 domain of the L-protein to warranty proper activity and folding of the protein. On the other hand, binding site residues are critical in protein-protein interaction and RCCs may play a critical role in positioning of these residues. However, as show in Figure 5, the location of RCCs residues in Ribbon diagram of L-protein was not properly modeled and prediction of the exact role of these RCCs was difficult. For better understanding of the roles of these RCCs, it is needed to first determine the crystal structure of this segment of the protein. On the other hand, the recent study showed the structure of Sodium-Taurocholate Cotransporting Polypeptide (NTCP) binding site in the HBV preS/S region that includes essential and accessory domains. Interestingly, two of the RCCs that were detected in N terminal domain of preS, overlapped with NTCP binding site. One conclusion is that these RCCs support the suitable structure of this polypeptide and help provide the correct binding site. However, this idea must be evaluated with experimental studies (60).
In HBV, the region responsible for encoding virus protein envelope (surface antigen or HBsAg) is completely embedded in the viral polymerase gene (61, 62). In the polymerase gene, the substitutions inside or near the YMDD motif in catalytic core, led to resistance to nucleoside analogues antiviral drugs, such as lamivudine, adefovir and entecavir (63). This shows that this motif and its position has very important role in structure and function of polymerase. Previously, it was found that in 3D-models of polymerase, the conserved amino acids are clustered at the YMDD motif in the catalytic core of the enzyme structure (62). The YMDD motif is one of the highly conserved domains in RNA-dependent DNA polymerase of retroviruses, hepadnavirus, retro transposons, group II intron, bacterial retrons, and the catalytic subunit of telomerase and is involved in nucleotide binding in the catalytic site of the polymerase (64-68). The YMDD motif is also a highly conserved domain in the RNA-dependent DNA polymerase and is involved in nucleotide binding of the catalytic site of the polymerase (69). Previously, it was reported that at least four common motifs are conserved in the sequences of all the polymerases showing RNA template specificity (67). The secondary structure predictions of these RNA-dependent polymerases suggest that these four motifs seem to be well-ordered and could build a large domain of 120 - 210 amino acids that are proposed to be a prerequisite polymerase module (67). Studying the RCC in relation with YMDD position and conserved domain helped us determine that at least one of these RCCs are located at highly conserved domain in the RNA-dependent DNA polymerase and may play a special role in proper folding of this domain. Evaluation of partial CDs of DNA polymerase gene from liver transplanted patients that are submitted in gene bank showed that RCCs are not located in these partial CDs of DNA polymerase proteins. However, these RCCs have unknown features in structure and function of DNA polymerase that indicate the crucial importance of RCCs. With slow down of the translation rate of this mRNA, an efficient time was provided for proper folding of these proteins. This hypothesis should be evaluated by experimental methods as site directed mutagenesis. This study provides a new and deep perspective in protein research and drug design for treatment of HBV. Our findings indicate that RCCs may play an important role in proper folding and activity of HBV proteins. However, there may be other RCCs that could not be identified by the Sherlocc program. Also, RCCs cause ribosomal pauses to regulate specific folding but we cannot say strictly whether such pauses are needed for folding or molecular recognition of HBV proteins. However, based on the situation of RCC in structure of HBV proteins, it seems that RCCs can be considered as targets for development of new drugs. For drug design, we must focus on these RCCs and at first identify the frequently of amino acid codons. Then designing a drug that disorder in the proportion of these specific tRNAs in the cells to interference in the translation rate of mRNA. In a previous study, increasing the expression of tRNAs corresponding to rare codons increased the translation rate, but led to protein misfolding and aggregation (70, 71). By this drug, the rate of the mRNA translation and protein folding was changed. Furthermore, the HBV proteins possess certain features that are very important for HBV life cycle and infectivity such as receptor recognition and binding (72-74). Considering these features is very important in drug designing. These new drugs may finally inhibit the life cycle of HBV.