


1. Background
2. Objectives
3. Methods
3.1. Trial Design
3.2. Participants
3.3. Interventions
3.4. Data Collection
3.4.1. Demographic and Clinical Profile and Anthropometric Assessment
3.4.2. Blood Sampling and Cell Separation
3.4.3. ELISA for Circulating Cytokines
3.4.4. Flow Cytometry
3.4.5. Quantitative Real-time PCR Analysis
3.4.6. Outcomes
3.4.7. Sample Size
3.4.8. Statistical Analysis
4. Results
4.1. Study Population and Baseline
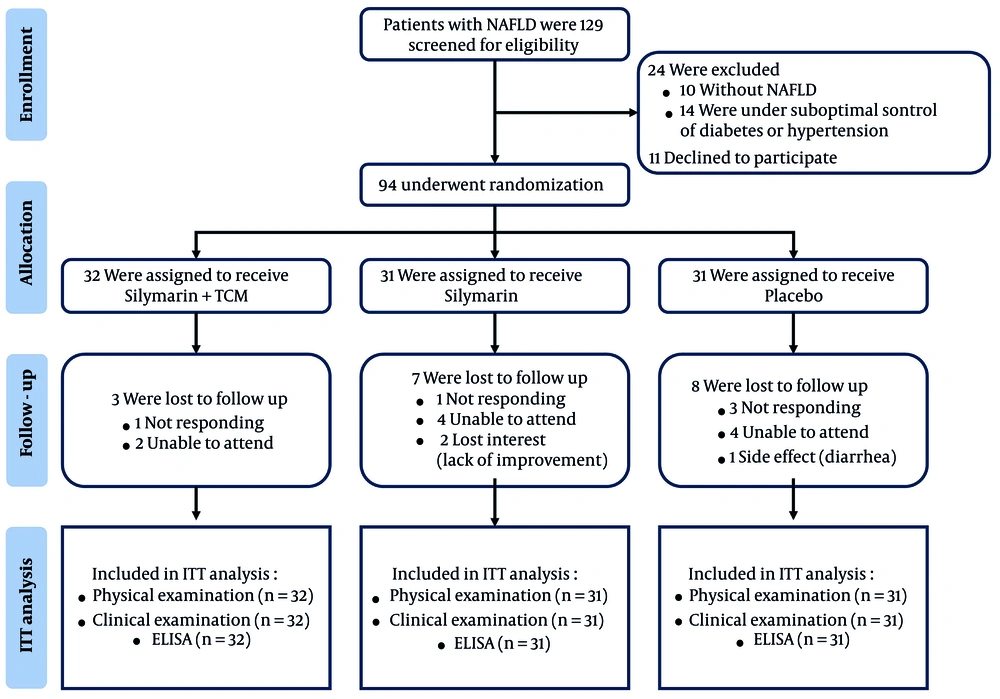
CONSORT flow diagram of patients with NAFLD with silymarin + TCM, silymarin or placebo for 12 weeks. (Abbreviations: ITT, intention-to-treat; NAFLD, nonalcoholic fatty liver disease; TCM, traditional Chinese medicine).
4.2. Primary Outcomes
| Variables | Silymarin + TCM (n = 32) | Silymarin (n = 31) | Placebo (n = 31) | Test Statistics | P-Value |
|---|---|---|---|---|---|
| BMI (kg/m2) | 26.50 (25.44, 28.47) | 26.40 (24.50, 29.40) | 27.14 (25.10, 28.50) | 0.24 | 0.88 b |
| Change rate (%) | -0.71 (-3.04, 1.58) | -1.09 (-3.08, 2.96) | 0.35 (-2.17, 2.60) | 0.96 | 0.62 b |
| Waist circumference (cm) | 92.50 (87.50, 95.00) | 90.60 (86.00, 97.00) | 94.24 (90.00, 100.00) | 3.31 | 0.19 b |
| Change rate (%) | -5.07 ± 7.01 | -3.08 ± 6.66 | -2.47 ± 5.29 | 1.44 | 0.24 c |
| Hip circumference (cm) | 99.50 (97.00, 102.82) | 100.00 (97.00, 102.68) | 100.78 (97.00, 102.00) | 0.38 | 0.83 b |
| Change rate (%) | -2.85 (-6.59, 1.04) | -1.01 (-4.76, 2.13) | -1.77 (-3.57, 2.06) | 2.42 | 0.30 b |
| WHR | 0.92 ± 0.07 | 0.92 ± 0.05 | 0.94 ± 0.05 | 1.13 | 0.33 c |
| Change rate (%) | -2.43 ± 6.31 | -2.18 ± 5.00 | -1.59 ± 5.12 | 0.19 | 0.83 c |
| AST (U/L) | 25.35 (19.40, 29.33) | 27.00 (21.60, 31.73) | 29.93 (22.00, 32.42) | 2.61 | 0.27 b |
| Change rate (%) | 3.23 (-15.10, 22.93) | 7.98 (-6.74, 39.31) | 13.28 (-6.38, 39.88) | 1.49 | 0.47 b |
| ALT (U/L) | 32.10 (21.15, 45.35) | 41.50 (20.60, 47.04) | 38.20 (21.60, 46.60) | 1.36 | 0.50 b |
| Change rate (%) | -3.22 (-31.22, 23.33) | 2.35 (-25.92, 53.73) | 11.83 (-13.51, 46.57) | 2.12 | 0.35 b |
| ALP (U/L) | 73.30 (54.47, 82.55) | 72.76 (61.00, 80.00) | 74.60 (70.20, 94.00) | 4.45 | 0.11 b |
| Change rate (%) | -3.70 (-15.69, 7.50) | -1.22 (-13.88, 5.17) | -0.53 (-9.72, 8.01) | 0.59 | 0.74 b |
| GGT (U/L) | 34.00 (20.00, 54.15) | 46.00 (26.00, 60.00) | 47.96 (23.00, 56.00) | 1.99 | 0.37 b |
| Change rate (%) | -3.31 (-27.27, 17.56) | -5.22 (-21.17, 34.48) | 0.00 (-12.39, 28.57) | 3.01 | 0.22 b |
| AST/ALT | 0.80 (0.63, 1.04) | 0.69 (0.59, 1.06) | 0.81 (0.66, 0.97) | 0.52 | 0.77 b |
| Change rate (%) | 12.22 (-6.27, 35.55) | 5.20 (-9.49, 19.71) | 5.24 (-20.00, 30.96) | 3.01 | 0.22 b |
| Fasting insulin (pmol/L) | 122.15 (76.46, 146.35) | 118.47 (74.18, 139.80) | 119.00 (79.56, 126.90) | 0.52 | 0.77 b |
| Change rate (%) | 5.98 (-26.67, 44.35) | 22.16 (-12.87, 97.99) | 11.56 (-28.52, 35.98) | 2.48 | 0.29 b |
| Fasting blood glucose (mmol/L) | 5.48 (5.32, 6.41) | 5.55 (5.09, 6.06) | 5.65 (5.37, 5.88) | 1.08 | 0.58 b |
| Change rate (%) | 4.36 (-2.57, 12.68) | 2.7 (-1.56, 8.73) | 4.32 (-0.98, 9.92) | 0.79 | 0.67 b |
| HOMA2 IR | 2.34 (1.44, 2.74) | 2.28 (1.37, 2.68) | 2.27 (1.52, 2.43) | 0.76 | 0.68 b |
| Change rate (%) | 4.51 (-26.71, 42.41) | 22.48 (-20.40, 99.47) | 11.21 (-27.08, 36.38) | 2.32 | 0.31 b |
| Total bile acid (μmol/L) | 4.61 (2.50, 6.90) | 3.63 (2.60, 4.93) | 4.15 (2.10, 4.80) | 1.64 | 0.44 b |
| Change rate (%) | 10.46 (-11.78, 69.82) | 35.65 (-25.00, 105.00) | 22.51 (-27.36, 84.43) | 0.69 | 0.71 b |
| TG (mmol/L) | 1.76 (1.29, 2.77) | 2.09 (1.43, 3.34) | 2.11 (1.17, 2.96) | 0.78 | 0.68 b |
| Change rate (%) | -11.94 (-35.75, 11.03) | -10.06 (-25.61, 19.42) | 1.39 (-25.24, 37.40) | 2.43 | 0.30 b |
| TC (mmol/L) | 5.01 ± 0.82 | 5.19 ± 0.77 | 5.06 ± 0.95 | 0.36 | 0.70 c |
| Change rate (%) | 0.11 ± 14.69 | -0.14 ± 13.55 | 1.11 ± 17.81 | 0.06 | 0.94 c |
| HDL-C (mmol/L) | 1.12 (0.97, 1.34) | 1.14 (1.05, 1.34) | 1.22 (1.06, 1.32) | 0.29 | 0.87 b |
| Change rate (%) | 4.53 (-10.84, 15.42) | -4.07 (-12.40, 10.87) | -2.20 (-10.90, 9.92) | 0.91 | 0.64 b |
| LDL-C (mmol/L) | 3.26 ± 0.82 | 3.41 ± 0.76 | 3.09 ± 0.78 | 1.23 | 0.30 b |
| Change rate (%) | 2.04 (-11.49, 15.07) | 4.38 (-10.06, 17.56) | -0.65 (-8.51, 9.55) | 0.63 | 0.73 b |
| IL-10 (pg/mL) | 4.61 (2.00, 5.78) | 4.44 (3.59, 5.21) | 4.34 (2.12, 4.94) | 1.16 | 0.56 b |
| Change rate (%) | -15.74 (-52.68, 27.45) | -11.96 (-29.87, 27.94) | -5.60 (-40.62, 9.31) | 0.64 | 0.72 b |
| IL-18 (pg/mL) | 98.14 (59.23, 142.06) | 133.62 (75.62, 139.71) | 128.48 (60.83, 137.75) | 1.54 | 0.46 b |
| Change rate (%) | -48.00 (-81.71, -25.67) d | -45.33 (-76.79, 26.89) | -24.57 (-52.44, 41.30) | 6.17 | 0.04 b |
Abbreviations: TCM, traditional Chinese medicine; BMI, Body Mass Index; WHR, waist-to-hip ratio; AST, aspartate transaminase; ALT, alanine aminotransferase; ALP, alkaline phosphatase; GGT, γ-glutamyl transferase; HOMA2 IR, homeostasis model assessment 2 of insulin resistance; TG, triglyceride; TC, total cholesterol; HDL-C, high density lipoprotein cholesterol; LDL-C, low density lipoprotein cholesterol; IL, interleukin.
a Values are expressed as means ± SD or median (IQR).
b Kruskal-Wallis test.
c One-way ANOVA.
d P < 0.05 vs the placebo group.
4.3. Secondary Outcomes
4.3.1. Silymarin + Traditional Chinese Medicine Reduces the Th17/Treg Cell Ratio in the Peripheral Blood of Participants
| Variables | Baseline | End of the Trial | ||||||||
|---|---|---|---|---|---|---|---|---|---|---|
| Silymarin + TCM (n = 26) | Silymarin (n = 18) | Placebo (n = 15) | H- Value | P-Value | Silymarin + TCM (n = 26) | Silymarin (n = 18) | Placebo (n = 15) | H- Value | P-Value | |
| Th17 frequency (%) | 1.40 (0.67, 2.26) | 1.36 (1.13, 1.71) | 1.21 (0.81, 2.53) | 0.14 | 0.93 | 0.74 (0.46, 1.27) | 0.94 (0.43, 1.51) | 1.42 (1.05, 1.64) | 5.88 | 0.05 |
| Treg frequency (%) | 6.53 (5.16, 8.24) | 6.26 (5.09, 8.55) | 6.35 (5.31, 11.00) | 0.24 | 0.88 | 6.99 (5.32, 9.38) | 7.10 (4.83, 9.25) | 6.53 (5.18, 11.80) | 0.28 | 0.87 |
| Th17/Treg ratio | 0.17 (0.11, 0.29) | 0.20 (0.13, 0.26) | 0.20 (0.11, 0.31) | 0.43 | 0.81 | 0.11 (0.05, 0.18) b | 0.11 (0.08, 0.22) | 0.23 (0.14, 0.31) | 6.26 | 0.04 |
Abbreviations: TCM, traditional Chinese medicine; Th, T helper; Treg, T regulatory.
a Values are expressed as median (IQR).
b P < 0.05 vs the placebo group.
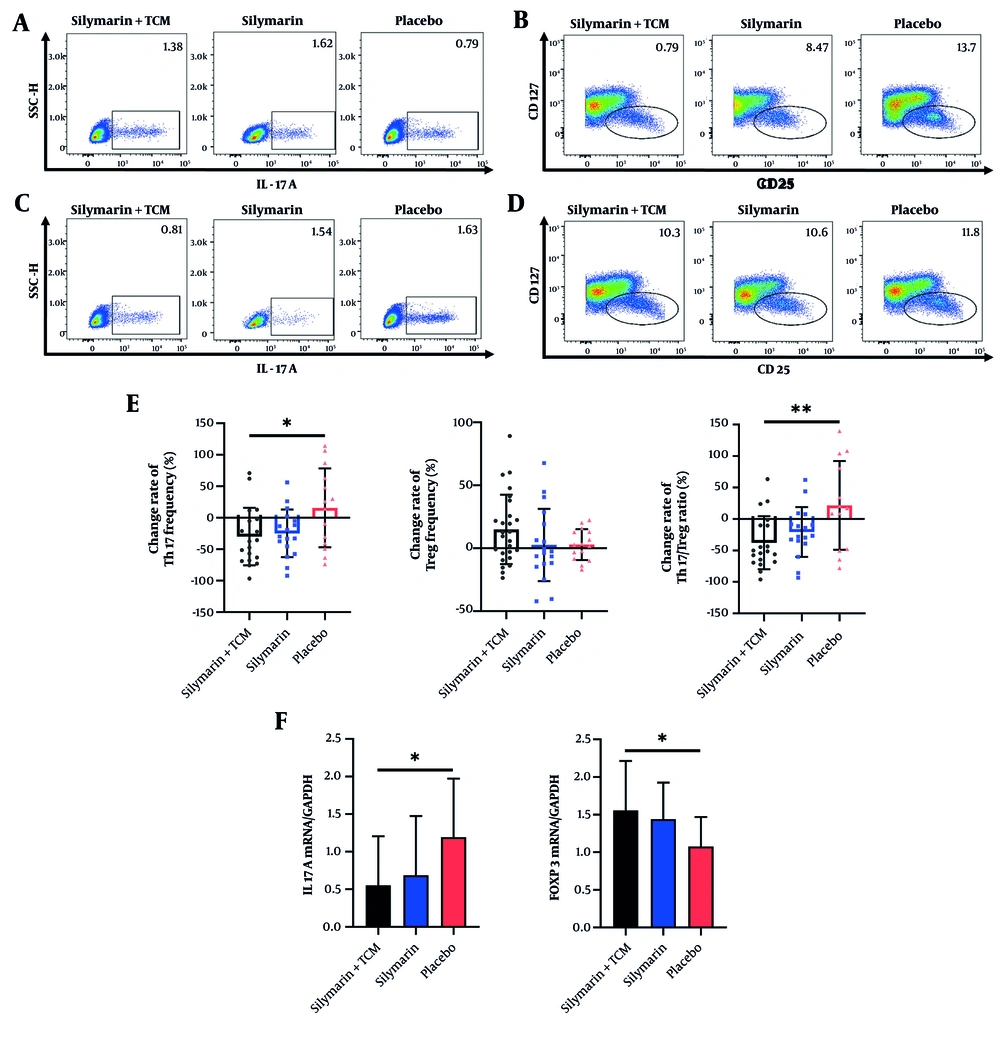
Distribution of Treg and Th17 cells in peripheral blood. A - B, the frequency of Th17 and Treg cells among three groups at baseline; C - D, the frequency of Th17 and Treg cells among three groups at the end of trial; E, the change rate of Th17, Treg cells and Th17/Treg ratio; F, mRNA levels of IL17A and FOXP3. *P < 0.05, **P < 0.01. (Abbreviations: IL, interleukin; TCM, traditional Chinese medicine; Th, T helper; Treg, T regulatory).
4.3.2. Reduced Nucleotide-Binding Oligomerization Domain-Like Receptor Protein 3 Inflammasome-Related Genes in Peripheral Blood Mononuclear Cells in Subjects Receiving Silymarin + Traditional Chinese Medicine or Silymarin Alone
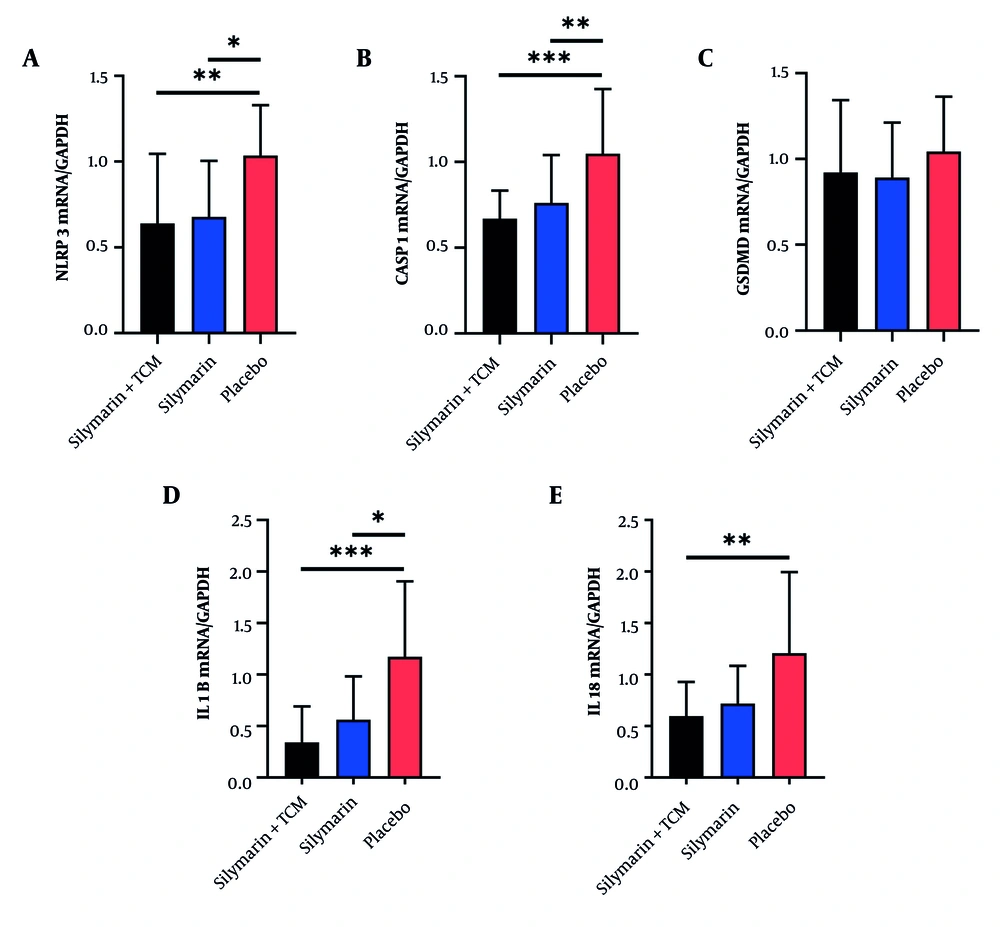
Expression of NLRP3 inflammasome related genes in peripheral blood mononuclear cells of subjects at the end of the trial. A - E, mRNA levels of nucleotide-binding oligomerization domain-like receptor protein 3, CASP1, GSDMD, IL1B and IL18. *P < 0.05, **P < 0.01, ***P < 0.001. (Abbreviations: CASP1, caspase-1; FOXP3, forkhead box p3; GSDMD, gasdermin D; IL, interleukin; NLRP3, nucleotide binding oligomerization domain-like receptor protein 3; TCM, traditional Chinese medicine).



