1. Background
Autoimmune hepatitis (AIH) is a chronic inflammatory liver disease characterized by hepatocellular interfacial inflammation, elevated serum aminotransferases, and hyper-gamma-globulinemia. Its pathogenesis involves a complex interplay of genetic susceptibility, environmental triggers, and immune regulatory imbalance (1-3). The AIH typically presents with nonspecific symptoms; patients may experience hepatomegaly with pressure pain, fatigue, abdominal distension, lack of appetite, itching, and jaundice when the disease is active. In severe cases, patients may present with variceal bleeding as the initial manifestation (4, 5). The global incidence of AIH is approximately 1 - 2/100,000, with significant geographical and ethnic variations (6). Without timely diagnosis and appropriate immunosuppressive therapy, AIH can progress to cirrhosis or even liver failure, resulting in a 5-year survival rate of less than 50%. This progression significantly impacts patients' health and quality of life, underscoring the importance of early diagnosis and intervention (7). Despite recent advances, the precise etiology and pathogenesis of AIH remain incompletely understood, though autoimmune dysregulation is widely accepted as a central mechanism.
Immune checkpoint molecules have emerged as critical regulators of autoimmunity in various diseases. Among these, programmed death factor-1 (PD-1) and its ligand programmed death factor ligand-1 (PD-L1) play essential roles in maintaining immune tolerance (8). The PD-1 is primarily expressed on activated T cells, B cells, and myeloid cells, while PD-L1 is expressed on various cell types including lymphocytes, hepatocytes, and antigen-presenting cells. The PD-1/PD-L1 pathway provides inhibitory signals during T-cell activation and proliferation, negatively regulating immune responses and protecting against autoimmunity (9). Dysregulation of this pathway has been implicated in various autoimmune diseases and cancer immune evasion, making it an attractive target for investigation in AIH (10).
Serum autoimmune antibodies represent another important aspect of AIH diagnosis and classification. These include antibodies to liver cytosol antigen type 1 (anti-LC1), anti-nuclear antibodies (ANAs), and anti-smooth muscle antibodies (ASMA). These autoantibodies reflect the immune imbalance in AIH patients and aid in diagnosis and classification (11). However, as with other autoimmune disorders, diagnosis based on a single autoantibody lacks sufficient sensitivity and specificity, necessitating a comprehensive panel approach (12). Recent evidence suggests that hematological parameters may also reflect underlying inflammatory processes in autoimmune diseases. Red blood cell distribution width (RDW), a measure of erythrocyte size heterogeneity routinely assessed in complete blood counts, has emerged as a potential marker of chronic inflammation and oxidative stress (13). The RDW elevation has been associated with various inflammatory and autoimmune conditions, suggesting its potential utility in AIH assessment (14). While these individual markers — PD-1/PD-L1 expression, autoantibodies, and RDW — have been studied in various contexts, their combined analysis in AIH remains limited. Understanding their clinical significance and relationship with disease occurrence could provide valuable insights into AIH pathogenesis and potentially improve diagnostic approaches.
2. Objectives
This study aims to comprehensively analyze the expression profiles of these markers in AIH patients, assess their relationship with disease occurrence, and evaluate their potential diagnostic utility. These findings may contribute to a deeper understanding of AIH pathophysiology and support the development of more effective diagnostic and therapeutic strategies.
3. Methods
3.1. Statement of Ethics
This study was approved by our Institutional Review Board and Ethics Committee. Given that this study was retrospective and only de-identified subject data were used, informed consent was not required as there was no risk or adverse effect on the subjects. This waiver is in line with regulations and ethical guidelines related to retrospective studies.
3.2. Study Design
This retrospective case-control study examined clinical data from 103 patients with AIH and 119 healthy individuals who underwent routine health check-ups at our hospital between November 2023 and November 2024. Data were retrieved from the electronic medical record system, and subjects were divided into two groups: The AIH group (n = 103) and the control group (n = 119). We acknowledge the potential for selection and information biases inherent to retrospective designs and have implemented rigorous quality control measures to minimize these limitations.
3.3. Inclusion and Exclusion Criteria
1. Inclusion criteria: (1) The control group comprised physically healthy individuals without heart, liver, kidney, or other diseases; (2) age > 18 years; (3) no history of immunosuppressant use; (4) complete clinical data; and (5) AIH diagnosis according to the criteria outlined in "Diagnosis and Management of Autoimmune Hepatitis in Adults and Children" (15). All AIH patients included were newly diagnosed cases who had not yet initiated immunosuppressive therapy.
2. Exclusion Criteria: (1) Alcoholic or viral hepatitis; (2) primary biliary cholangitis, primary sclerosing cholangitis, or overlap syndromes; (3) drug-induced liver injuries or hereditary metabolic liver diseases; (4) other hepatobiliary diseases, such as gallstones or cholecystitis; (5) anemia and malnutrition; (6) cardiovascular diseases that might affect RDW or PD-1/PD-L1 expression, including coronary artery disease, heart failure, and valvular heart disease; (7) active infection or malignancy; and (8) other autoimmune diseases. All AIH patients included in this study were classified as having type 1 AIH based on their serological profile (ANA and/or ASMA positivity) and histological features, following the International AIH Group criteria.
3.4. Data Collection
General demographic data were collected from all study subjects, including age, gender (male/female), family history (yes/no), Body Mass Index, place of residence (urban/rural), history of alcohol consumption (yes/no), history of smoking (yes/no), hypertension (yes/no), diabetes mellitus (yes/no), and hyperlipidemia (yes/no). Place of residence was included as a demographic variable because previous epidemiological studies have suggested variations in AIH prevalence between urban and rural populations, possibly due to differences in environmental exposures and healthcare access (16). All data were collected by two independent researchers, and any discrepancies were resolved by a third senior investigator. To ensure data quality, 10% of the records were randomly selected for verification against the original medical records, with an inter-rater reliability coefficient (Cohen's kappa) of 0.92, indicating excellent agreement.
Hypertension was defined according to "The Japanese Society of Hypertension Guidelines for Self-monitoring of Blood Pressure at Home (Second Edition)" (17); diabetes mellitus according to the "Application of the Chinese Expert Consensus on Diabetes Classification in Clinical Practice" (18); and hyperlipidemia according to the "Report of the Japan Atherosclerosis Society (JAS) Guideline for Diagnosis and Treatment of Hyperlipidemia in Japanese Adults" (19).
3.5. Red Blood Cell Distribution Width Test
Fasting venous blood samples (5 mL) were collected from all subjects in EDTA tubes. The RDW was measured directly from whole blood using a Myriad BC-6800 automatic hematology analyzer (Mindray, Shenzhen, China) according to the manufacturer's instructions. The reference range for RDW in our laboratory is 11.5 - 14.5%. Quality control was performed daily using commercial control materials, with inter-assay coefficient of variation (CV) maintained below 2.5%.
3.6. Serum Autoimmune Antibody Detection
Autoimmune antibody detection was performed using commercially available kits from EUROMMUN Medical Diagnostic Company (Germany). These kits have been validated with reported sensitivities of 85 - 95% and specificities of 90 - 98% for AIH diagnosis when used in combination (20). Three autoimmune antibodies were tested: The anti-LC1, ANA, and ASMA. The Anti-LC1 was measured by immunoblotting, and results were analyzed using EUROlineScan software. Results were considered positive when the semi-quantitative value was ≥ (+). The ANA and ASMA were measured by indirect immunofluorescence on HEp-2 cells and rat stomach/kidney tissues, respectively. Antibody staining patterns were determined based on the appearance of characteristic green fluorescence in tissues or cells. Titers ≥ 1:40 for ANA and ≥ 1:20 for ASMA were considered positive, in accordance with international guidelines (21). All tests were performed by experienced laboratory technicians following standardized protocols, with inter-assay CV of < 5% for all assays.
3.7. T-lymphocyte Programmed Death Factor-1/Programmed Death Factor Ligand-1 Detection
Fasting peripheral venous blood (2 mL) was collected from all subjects in EDTA tubes. For AIH patients, samples were obtained on the second day of admission, prior to any immunosuppressive treatment. For flow cytometric analysis, 150 μL of whole blood was divided into three equal parts (tubes A, B, and C). In tube A, 10 μL each of mouse anti-human CD3-PerCP-Cy5.5 and CD4-FITC monoclonal antibodies were added, along with 10 μL of mouse anti-human PD-1-PE monoclonal antibody. In tube B, 10 μL each of mouse anti-human CD3-PerCP-Cy5.5 and CD8-FITC monoclonal antibodies were added, along with 10 μL of mouse anti-human PD-L1-PE monoclonal antibody. Tube C contained 10 μL each of FITC-IgG1 and PE-IgG1 as isotype controls. After vortexing, samples were incubated for 30 minutes at room temperature protected from light. Then, 450 μL of erythrocyte lysate (10-fold diluted) was added, followed by a 15-minute incubation at room temperature. After complete hemolysis, cells were washed three times with phosphate buffer solution (PBS), resuspended in 300 μL of 1% paraformaldehyde, and immediately analyzed by flow cytometry. Data were analyzed using BD Cell Quest software. Lymphocyte populations were identified based on forward and side scatter properties. CD3+CD4+ cells were identified as CD4+ T cells, while CD3+CD8+ cells were identified as CD8+ T cells. The percentages of PD-1+ and PD-L1+ cells within these populations were determined. All antibodies were purchased from BD Biosciences (USA); erythrocyte lysate and PBS buffer were from Hangzhou Lianke Biotechnology Co. Ltd (China); and flow cytometry was performed using a Cytomics FC 500 flow cytometer (Beckman Coulter, USA). Inter-assay variability was monitored using standardized control samples, with CV maintained below 8% for all measurements.
3.8. Liver Function Tests
Liver function tests, including alanine aminotransferase (ALT), aspartate aminotransferase (AST), alkaline phosphatase (ALP), gamma-glutamyl transferase (GGT), total bilirubin (TBIL), and albumin (ALB), were measured using standard automated biochemical analyzers with commercially available reagents. These tests were performed as part of routine clinical care for AIH patients and during health check-ups for control subjects.
3.9. Statistical Analysis
SPSS 25.0 statistical software (IBM, USA) was used for data analysis. Categorical data were expressed as frequencies (n) and percentages (%), and compared using the chi-square test. Normally distributed continuous data were expressed as mean ± standard deviation (SD) and compared using Student's t-test. Non-normally distributed data were expressed as median [interquartile range, M (P25, P75)] and compared using the Mann-Whitney U test. P < 0.05 was considered statistically significant. To assess multicollinearity among variables, variance inflation factor (VIF) and tolerance were calculated using R language (R package: Logreg6.2.0). Variables with VIF ≤ 10 and tolerance ≥ 0.1 were considered free from significant multicollinearity, as per standard statistical practice (22), and were included in the logistic regression model. Multivariate logistic regression analysis was performed to identify independent risk factors for AIH, with results expressed as odds ratios (OR) and 95% confidence intervals (CI).
Receiver operating characteristic (ROC) curves were plotted to evaluate the predictive value of each marker for AIH. The area under the curve (AUC), sensitivity, specificity, and optimal cutoff values (determined by the maximum Youden Index) were calculated, with 95% CI reported for AUC values. Missing data (occurring in < 3% of cases) were handled using multiple imputation techniques to minimize bias.
4. Results
4.1. Comparison of General Demographic Information
Comparison of demographic characteristics between the AIH and control groups showed no statistically significant differences in age, gender distribution, family history, Body Mass Index, place of residence, alcohol consumption, smoking history, hypertension, diabetes mellitus, or hyperlipidemia (all P > 0.05), indicating well-matched study groups (Table 1).
Table 1.
Comparison of General Demographic Data a
| Variables | AIH Group (N = 103) | Control Group (N = 119) | χ2/t | P |
|---|---|---|---|---|
| Age (y) | 68.25 ± 8.13 | 68.37 ± 8.06 | 0.110 | 0.912 |
| Sex | 0.014 | 0.906 | ||
| Male | 15 (14.56) | 18 (15.13) | ||
| Female | 88 (85.44) | 101 (84.87) | ||
| Family history | 0.264 | 0.607 | ||
| Yes | 3 (2.91) | 5 (4.20) | ||
| No | 100 (97.09) | 114 (95.80) | ||
| Body Mass Index (kg/m2) | 21.15 ± 1.97 | 21.04 ± 1.99 | 0.413 | 0.680 |
| Place of residence | 0.243 | 0.622 | ||
| Urban | 66 (64.08) | 80 (67.23) | ||
| Rural | 37 (35.92) | 39 (32.77) | ||
| Alcohol consumption | 0.024 | 0.876 | ||
| Yes | 40 (38.83) | 45 (37.82) | ||
| No | 63 (61.17) | 74 (62.18) | ||
| Smoking history | 0.297 | 0.586 | ||
| Yes | 32 (31.07) | 33 (27.73) | ||
| No | 71 (68.93) | 86 (72.27) | ||
| Hypertension | 0.308 | 0.579 | ||
| Yes | 7 (6.80) | 6 (5.04) | ||
| No | 96 (93.20) | 113 (94.96) | ||
| Diabetes mellitus | 0.673 | 0.412 | ||
| Yes | 9 (8.74) | 7 (5.88) | ||
| No | 94 (91.26) | 112 (94.12) | ||
| Hyperlipidemia | 0.264 | 0.607 | ||
| Yes | 3 (2.91) | 5 (4.20) | ||
| No | 100 (97.09) | 114 (95.80) |
Abbreviation: AIH, autoimmune hepatitis.
a Values are expressed as mean ± standard deviation (SD) or No. (%).
4.2. Comparison of Serum Autoimmune Antibodies
The positivity rate of anti-LC1 showed no statistically significant difference between the AIH group and the control group (2.91% vs. 0.84%, χ2 = 1.340, P = 0.247). However, the positivity rates of ANA (53.40% vs. 5.04%) and ASMA (47.57% vs. 0.84%) were significantly higher in the AIH group compared to the control group (χ2 = 64.786 and 69.100, respectively, both P < 0.001). These findings confirm the characteristic autoantibody profile in AIH patients, particularly the significantly elevated prevalence of ANA and ASMA, which are established serological markers for type 1 AIH (Table 2).
Table 2.
Comparison of Serum Autoimmune Antibodies Between Groups a
| Variables | AIH Group (N = 103) | Control Group (N = 119) | χ2 | P |
|---|---|---|---|---|
| Anti-LC1 positive | 3 (2.91) | 1 (0.84) | 1.340 | 0.247 |
| ANA positive | 55 (53.40) | 6 (5.04) | 64.786 | < 0.001 |
| ASMA positive | 49 (47.57) | 1 (0.84) | 69.100 | < 0.001 |
Abbreviations: AIH, autoimmune hepatitis; Anti-LC1, antibodies to liver cytosol antigen type 1; ANA, anti-nuclear antibody; ASMA, anti-smooth muscle antibody.
a Values are expressed as No. (%).
4.3. Comparison of Liver Function Tests
Liver function tests showed significant differences between the AIH and control groups. AIH patients had markedly elevated levels of ALT (156.72 ± 83.45 vs. 24.31 ± 8.62 U/L, P < 0.001), AST (142.35 ± 75.28 vs. 21.56 ± 6.94 U/L, P < 0.001), ALP (147.23 ± 56.12 vs. 82.37 ± 21.35 U/L, P < 0.001), GGT (112.45 ± 68.23 vs. 28.76 ± 14.52 U/L, P < 0.001), and TBIL (38.56 ± 21.34 vs. 12.45 ± 4.67 μmol/L, P < 0.001), with decreased ALB levels (32.45 ± 5.16 vs. 42.12 ± 3.25 g/L, P < 0.001). These abnormalities reflect the hepatocellular damage and impaired synthetic function characteristic of AIH. Further analysis revealed significant correlations between liver function parameters and the immunological markers measured in this study. The PD-1/CD4+ expression showed positive correlations with ALT (R = 0.653, P < 0.001), AST (R = 0.687, P < 0.001), and TBIL (R = 0.542, P < 0.001), while RDW positively correlated with ALT (R = 0.489, P < 0.001), AST (R = 0.512, P < 0.001), and inversely correlated with ALB (R = -0.463, P < 0.001). These correlations suggest that the immune markers evaluated in this study may reflect disease activity and severity in AIH patients.
4.4. Comparison of T-lymphocyte Programmed Death Factor-1/Programmed Death Factor Ligand-1 and Red Blood Cell Distribution Width
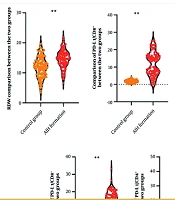
Significant differences in T-lymphocyte PD-1/PD-L1 expression and RDW were observed between the AIH and control groups. AIH patients showed markedly elevated levels of PD-1/CD4+ [20.17 (13.13, 24.46) vs. 5.41 (4.35, 6.71)%, Z = 9.857, P < 0.001], PD-1/CD8+ [13.86 (9.94, 17.66) vs. 1.88 (1.27, 2.40)%, Z = 10.325, P < 0.001], PD-L1/CD4+ [21.10 (14.67, 28.76) vs. 7.40 (4.99, 9.65)%, Z = 9.568, P < 0.001], PD-L1/CD8+ [13.15 (6.39, 16.47) vs. 1.98 (1.24, 2.43)%, Z = 9.903, P < 0.001], and RDW (14.65 ± 3.01 vs. 11.95 ± 3.46%, t = 6.124, P < 0.001) compared to the control group (Figure 1).
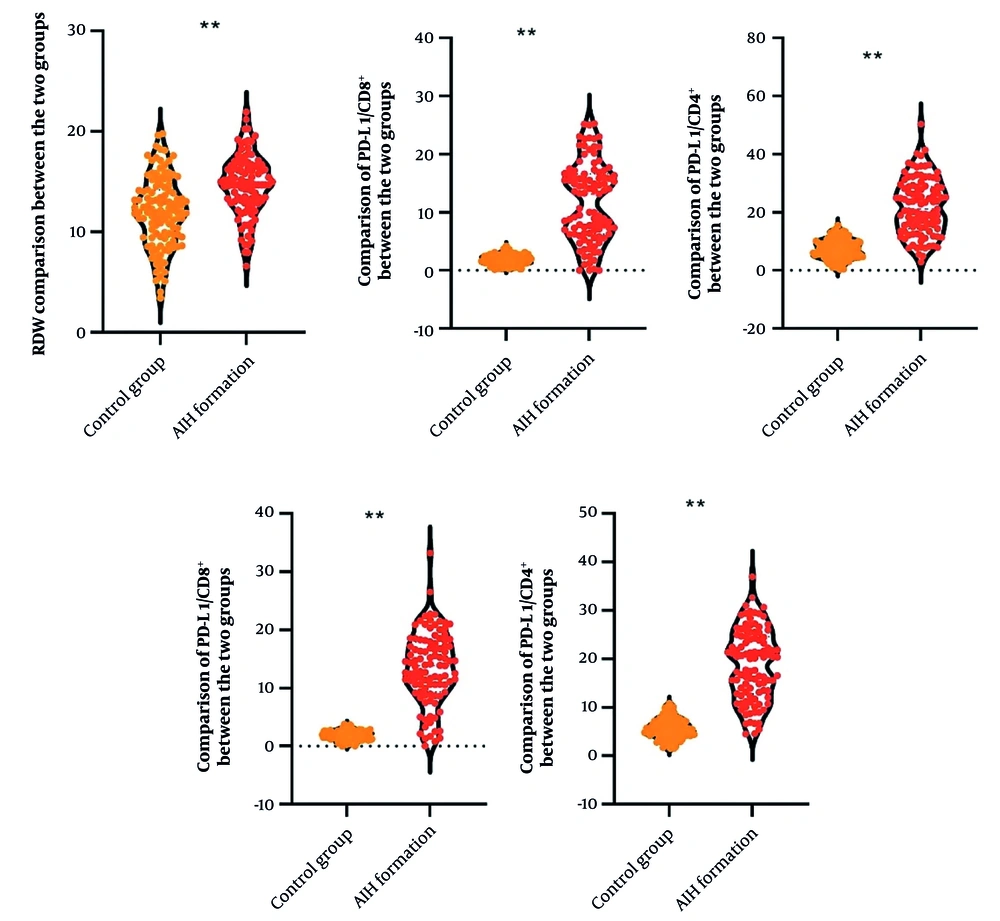
Figure 1.
Comparison of T-lymphocyte programmed death factor-1 (PD-1)/programmed death factor ligand-1 (PD-L1) and red blood cell distribution width (RDW) between groups (** P < 0.001)
4.5. Covariance Analysis
Multicollinearity analysis demonstrated that all variables with significant differences between groups had VIF values ≤ 10 and tolerance values ≥ 0.1, indicating the absence of significant multicollinearity. Therefore, all these variables were suitable for inclusion in the multivariate logistic regression model (Table 3).
Table 3.
Multicollinearity Analysis
| Variables | VIF Value | Tolerance |
|---|---|---|
| PD-1/CD4+ | 2.207 | 0.453 |
| PD-1/CD8+ | 2.506 | 0.399 |
| PD-L1/CD4+ | 1.660 | 0.603 |
| PD-L1/CD8+ | 1.907 | 0.524 |
| ANA | 4.530 | 0.221 |
| ASMA | 4.568 | 0.219 |
| RDW | 1.156 | 0.865 |
Abbreviations: VIF, variance inflation factor; PD-1, programmed death factor-1; PD-L1, programmed death factor ligand-1; ANA, anti-nuclear antibody; ASMA, anti-smooth muscle antibody; RDW, red blood cell distribution width.
4.6. Multivariate Logistic Regression Analysis
Multivariate logistic regression analysis identified T-lymphocyte PD-1/PD-L1 expression, serum autoimmune antibodies (ANA and ASMA), and RDW as independent risk factors for AIH. The OR were 2.109 (95% CI: 1.667 - 2.669) for PD-1/CD4+, 2.869 (95% CI: 1.821 - 4.520) for PD-1/CD8+, 1.512 (95% CI: 1.340 - 1.706) for PD-L1/CD4+, 2.733 (95% CI: 1.965 - 3.801) for PD-L1/CD8+, 21.580 (95% CI: 8.705 - 53.494) for ANA positivity, 107.074 (95% CI: 14.406 - 795.841) for ASMA positivity, and 1.291 (95% CI: 1.175 - 1.419) for RDW (all P < 0.001) (Table 4). These findings indicate that abnormalities in these markers are strongly associated with AIH occurrence, with particularly high OR for autoantibody positivity.
Table 4.
Multivariate Logistic Regression Analysis of Factors Associated with Autoimmune Hepatitis
| Variables | β Value | SE | Wald χ2 | P | OR Value | OR Value 95% CI |
|---|---|---|---|---|---|---|
| PD-1/CD4+ | 0.746 | 0.120 | 38.621 | < 0.001 | 2.109 | 1.667 - 2.669 |
| PD-1/CD8+ | 1.054 | 0.232 | 20.642 | < 0.001 | 2.869 | 1.821 - 4.520 |
| PD-L1/CD4+ | 0.414 | 0.061 | 45.257 | < 0.001 | 1.512 | 1.340 - 1.706 |
| PD-L1/CD8+ | 1.005 | 0.168 | 35.662 | < 0.001 | 2.733 | 1.965 - 3.801 |
| ANA | 3.072 | 0.463 | 43.983 | < 0.001 | 21.580 | 8.705 - 53.494 |
| ASMA | 4.674 | 1.023 | 20.853 | < 0.001 | 107.074 | 14.406 - 795.841 |
| RDW | 0.256 | 0.048 | 28.239 | < 0.001 | 1.291 | 1.175 - 1.419 |
Abbreviations: SE, standard error; OR, odds ratio; CI, confidence interval; PD-1, programmed death factor-1; PD-L1, programmed death factor ligand-1; ANA, anti-nuclear antibody; ASMA, anti-smooth muscle antibody; RDW, red blood cell distribution width.
4.7. Receiver Operating Characteristic Curve Analysis
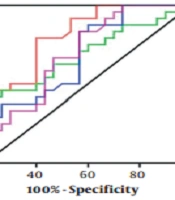
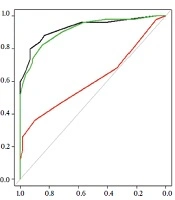
The ROC curve analysis demonstrated good to excellent predictive value for all markers in distinguishing AIH patients from healthy controls. The AUC values were 0.967 (95% CI: 0.943 - 0.991) for PD-1/CD4+, 0.956 (95% CI: 0.929 - 0.983) for PD-1/CD8+, 0.931 (95% CI: 0.898 - 0.964) for PD-L1/CD4+, 0.933 (95% CI: 0.901 - 0.965) for PD-L1/CD8+, 0.742 (95% CI: 0.675 - 0.809) for ANA, 0.734 (95% CI: 0.666 - 0.802) for ASMA, and 0.724 (95% CI: 0.656 - 0.792) for RDW. The optimal thresholds determined by the maximum Youden Index were 8.98% for PD-1/CD4+, 4.05% for PD-1/CD8+, 11.39% for PD-L1/CD4+, 3.72% for PD-L1/CD8+, 1.00 for ANA, 1.00 for ASMA, and 12.81% for RDW (Table 5, Figure 2).
Table 5.
Receiver Operating Characteristic Curve Analysis for Predicting Autoimmune Hepatitis
| Variables | AUC Value (95% CI) | Sensitivity | Specificity | Youden Index | Optimal Threshold (%) |
|---|---|---|---|---|---|
| PD-1/CD4+ | 0.967 (0.943 - 0.991) | 0.913 | 0.941 | 0.854 | 8.98 |
| PD-1/CD8+ | 0.956 (0.929 - 0.983) | 0.913 | 1.000 | 0.913 | 4.05 |
| PD-L1/CD4+ | 0.931 (0.898 - 0.964) | 0.864 | 0.899 | 0.763 | 11.39 |
| PD-L1/CD8+ | 0.933 (0.901 - 0.965) | 0.874 | 0.983 | 0.857 | 3.72 |
| ANA | 0.742 (0.675 - 0.809) | 0.534 | 0.950 | 0.484 | 1.00 |
| ASMA | 0.734 (0.666 - 0.802) | 0.476 | 0.992 | 0.467 | 1.00 |
| RDW | 0.724 (0.656 - 0.792) | 0.786 | 0.605 | 0.391 | 12.81 |
Abbreviations: AUC, area under the curve; CI, confidence interval; PD-1, programmed death factor-1; PD-L1, programmed death factor ligand-1; ANA, anti-nuclear antibody; ASMA, anti-smooth muscle antibody; RDW, red blood cell distribution width.
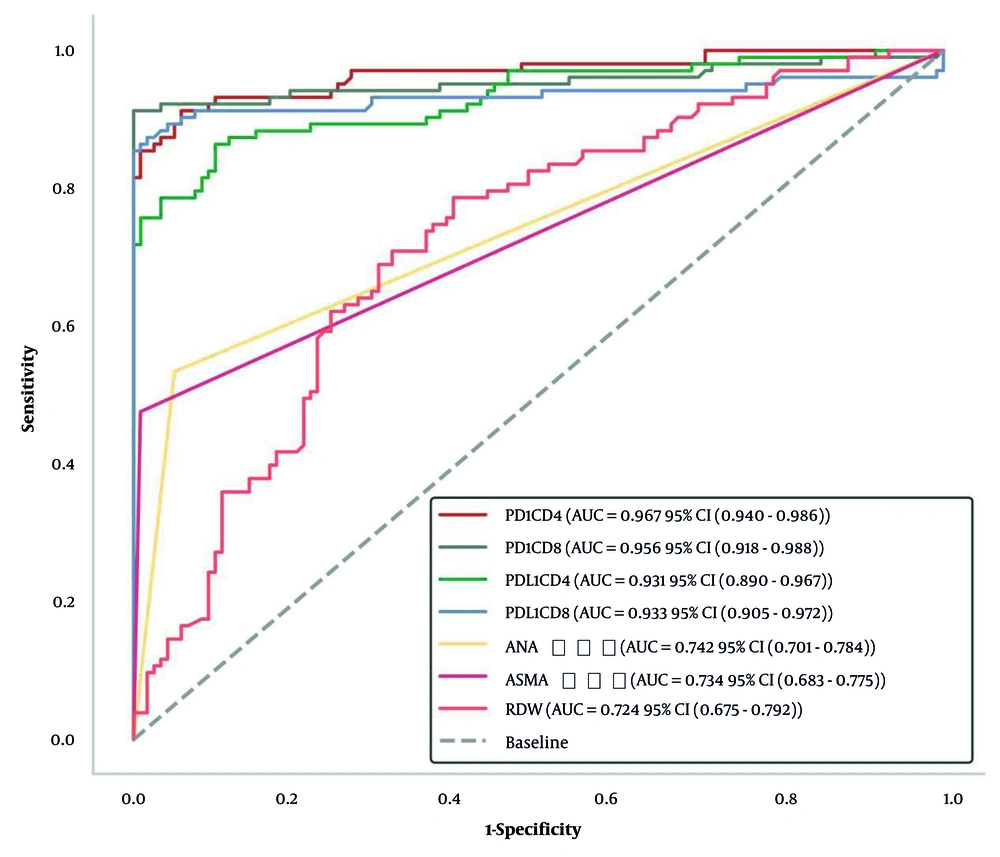
Figure 2.
Receiver operating characteristic (ROC) curves for predicting autoimmune hepatitis (AIH)
5. Discussion
This study comprehensively evaluated the clinical significance of T-lymphocyte PD-1/PD-L1 expression, serum autoimmune antibodies, and RDW in patients with AIH, demonstrating their potential as biomarkers for disease diagnosis and characterization. Our findings revealed distinct expression patterns of these markers in AIH patients compared to healthy controls and identified them as independent risk factors for the disease.
A key finding of our study was the significantly elevated expression of PD-1 and PD-L1 on both CD4+ and CD8+ T lymphocytes in AIH patients. This observation may seem paradoxical, as PD-1 is an inhibitory co-receptor that, upon binding to PD-L1, suppresses T-cell activation and proliferation, thereby limiting immune responses (23). Typically, one might expect decreased expression of these inhibitory molecules in autoimmune conditions characterized by excessive immune activation. However, our results are consistent with several recent studies examining PD-1/PD-L1 expression in other autoimmune diseases, including rheumatoid arthritis and systemic lupus erythematosus (24, 25).
Several mechanisms may explain this apparent paradox. First, the increased expression of PD-1 and PD-L1 might represent a compensatory response to ongoing inflammation, as the immune system attempts to downregulate excessive T-cell activation through negative feedback mechanisms (26). Bian et al. reported similar findings in AIH patients, demonstrating that PD-1/PD-L1 expression correlated with markers of liver injury, suggesting a relationship with disease activity (27). Second, despite increased expression, the PD-1/PD-L1 pathway may be functionally impaired in AIH, with defective signaling reducing its immunosuppressive efficacy (28). Third, the overwhelming pro-inflammatory stimuli in AIH might exceed the inhibitory capacity of the PD-1/PD-L1 pathway, leading to continued immune dysregulation despite increased expression (29). These findings suggest that the PD-1/PD-L1 pathway may represent a potential therapeutic target in AIH, with strategies aimed at enhancing its inhibitory function possibly offering benefit.
Our analysis of serum autoantibodies confirmed the diagnostic utility of ANA and ASMA in AIH, with significantly higher positivity rates in AIH patients compared to controls. These antibodies had the highest OR among all markers examined, highlighting their importance in AIH diagnosis. The extremely high OR for ASMA (107.074) underscores its specificity for AIH, consistent with its established role in diagnostic criteria (30). Recent studies have suggested that specific autoantibody patterns may correlate with disease severity and treatment response (31). Domerecka et al. demonstrated that autoantibody profiles, when combined with inflammatory markers, could enhance diagnostic accuracy in AIH (30, 32). Our findings support the continued use of these autoantibodies in diagnostic algorithms, particularly when interpreted alongside other clinical and laboratory parameters.
The elevation of RDW in AIH patients represents another interesting finding of our study. The RDW, traditionally used to evaluate anemia, has recently emerged as a marker of systemic inflammation and oxidative stress (33). Elevated RDW has been associated with various inflammatory and autoimmune conditions, including inflammatory bowel disease, rheumatoid arthritis, and systemic lupus erythematosus (34). In liver diseases, RDW elevation may reflect not only underlying inflammation but also alterations in erythrocyte production and metabolism due to impaired hepatic function (35). Gigi et al. reported similar RDW elevations in autoimmune liver diseases, suggesting its potential as a simple, inexpensive biomarker for monitoring disease activity (36). Our finding that RDW independently associates with AIH, with an AUC of 0.724, suggests it could serve as a useful adjunctive marker in clinical practice, particularly in resource-limited settings.
The ROC curve analysis demonstrated excellent diagnostic performance for T-lymphocyte PD-1/PD-L1 expression (AUC > 0.93) and good performance for ANA, ASMA, and RDW (AUC > 0.72). These findings suggest that these markers, either individually or in combination, could enhance the accuracy of AIH diagnosis. The particularly high AUC values for PD-1/CD4+ and PD-1/CD8+ (0.967 and 0.956, respectively) indicate their potential as novel biomarkers for AIH detection. A combined panel incorporating these immune markers with traditional diagnostics could potentially improve early diagnosis and monitoring of AIH, though validation in larger cohorts is necessary before clinical implementation.
The correlation between these markers and liver function parameters further supports their relevance to AIH pathophysiology. The positive correlations between PD-1/CD4+ expression and liver enzymes (ALT, AST) suggest that T-cell dysregulation parallels hepatocellular injury in AIH. Similarly, the correlation between RDW and liver function markers aligns with the concept that RDW reflects both systemic inflammation and organ-specific dysfunction. These relationships provide additional evidence for the biological plausibility of using these markers in AIH assessment.
5.1. Conclusions
In conclusion, this study demonstrates that T-lymphocyte PD-1/PD-L1 expression, serum autoimmune antibodies, and RDW show distinctive patterns in AIH patients and serve as independent risk factors for disease occurrence. These markers demonstrate significant diagnostic potential, with T-lymphocyte PD-1/PD-L1 expression showing particularly high discriminative ability.
5.2. Limitations
Several limitations of our study warrant consideration. First, as a single-center, retrospective study with a relatively small sample size, our findings may have limited generalizability and could be influenced by selection bias. Second, the cross-sectional design precludes assessment of how these markers change over time, particularly in response to treatment. Third, we focused specifically on type 1 AIH, so our results may not apply to other AIH subtypes. Fourth, while we excluded various conditions known to affect our markers of interest, we cannot rule out the influence of unmeasured confounding factors. Fifth, the ROC curve analysis, while useful, provides only a preliminary assessment of diagnostic utility and requires validation in independent cohorts. Future prospective, multicenter studies with larger sample sizes, longitudinal follow-up, and comprehensive clinical characterization are needed to confirm and extend our findings.
5.3. Implications
Our findings have several clinical implications. First, they suggest that assessment of these markers could enhance the accuracy of AIH diagnosis, potentially facilitating earlier detection and treatment. Second, the correlation between these markers and liver function parameters indicates their potential utility in monitoring disease activity. Third, the abnormalities in the PD-1/PD-L1 pathway highlight a potential therapeutic target for novel immunomodulatory approaches in AIH.
5.4. Future Research
Future research should focus on validating these findings in larger, prospective cohorts, assessing marker changes during disease progression and treatment, and evaluating their predictive value for clinical outcomes. Additionally, exploring the integration of these markers into existing diagnostic algorithms and investigating their utility in distinguishing AIH from other liver diseases would be valuable. Such efforts could ultimately lead to improved diagnostic approaches and personalized treatment strategies for patients with AIH.