
1. Background
Autoimmune liver diseases (AILDs) include autoimmune hepatitis (AIH), primary biliary cholangitis (PBC), primary sclerosing cholangitis (PSC), and overlap syndromes such as AIH-PBC overlap and AIH-PSC overlap. Celiac disease (CD) is a chronic autoimmune disorder characterized by mucosal inflammation, crypt hyperplasia, and villous atrophy in the small intestine in genetically predisposed individuals after gluten ingestion (1). Celiac disease is commonly associated with other autoimmune diseases, such as type 1 diabetes mellitus and autoimmune thyroid disorders (1).
The global prevalence of CD in the general population ranges from 0.5% to 2%, while in Turkey, it has been reported to be between 0.5% and 0.8% (2-4).
Several studies have demonstrated that the prevalence of CD is higher in patients with AILDs than in the general population (5-14). The 2019 AASLD AIH guideline and the 2017 UK-PBC guideline recommend initial screening for CD in patients diagnosed with AIH and PBC (15, 16). The prevalence of CD has been reported to range between 2% and 8% in AIH patients and between 1.7% and 12% in PBC patients (6, 8, 9, 12, 14, 17, 18).
2. Objectives
This study aimed to investigate the prevalence of CD in patients with AIH, PBC, and AIH-PBC overlap and to assess its potential impact on clinical course and treatment response.
3. Methods
We retrospectively reviewed the records of patients diagnosed with autoimmune liver diseases (AIH, PBC, and AIH-PBC overlap) and followed at the Department of Gastroenterology, Cerrahpasa Faculty of Medicine, between 2000 and 2022.
Of 94 patients with AILDs identified in the institutional database between 2000 and 2022, 89 were included in the analysis. Five patients were excluded because anti-tissue transglutaminase IgA (anti-tTG IgA) results were unavailable. No formal eligibility criteria beyond AILD diagnosis and available serology were applied. The final cohort comprised 40 patients with AIH, 37 with PBC, and 12 with AIH-PBC overlap.
Celiac disease testing was not performed as part of a predefined study protocol. Instead, this study retrospectively evaluated patients who had already undergone anti-tTG IgA testing during routine clinical practice or based on clinical suspicion at the discretion of the treating physician. Anti-tTG IgA measurements were performed in the institutional laboratory. Because of the retrospective design and long study period, detailed assay metadata, including manufacturer, platform, and cutoff history, could not be retrieved for all time points.
Among patients with positive or borderline anti-tTG IgA results, upper gastrointestinal endoscopy and duodenal biopsy had been performed in some patients as part of routine clinical care. Celiac disease was defined as positive anti-tTG IgA together with histological confirmation of Marsh type 3 lesions on duodenal biopsy. Patients without confirmatory biopsy and those with selective IgA deficiency were not classified as having CD.
Autoimmune hepatitis was diagnosed according to the 2008 simplified AIH criteria (19). Primary biliary cholangitis diagnosis required meeting at least two of the following three criteria: presence of antimitochondrial antibodies, elevated serum alkaline phosphatase (ALP) levels with normal biliary radiological findings, and histological findings compatible with PBC (20). Autoimmune hepatitis-primary biliary cholangitis overlap was diagnosed according to the Paris criteria (21). The response to PBC treatment was assessed using the Toronto criteria, where an ALP level less than 1.67 times the upper limit of normal was considered an adequate response (22, 23). Autoimmune hepatitis remission was defined as normalization of transaminase and IgG levels (16).
Due to the retrospective design, some variables had missing data. Analyses were performed using available-case analysis, and denominators are reported where applicable. This study was conducted in compliance with the Declaration of Helsinki. Approval was obtained from the ethics committee of Istanbul University-Cerrahpasa, Cerrahpasa Faculty of Medicine (approval number: E-83045809-604; date: 3.11.2023). Informed consent was not required due to the retrospective nature of the study.
3.1. Statistical Analysis
All statistical analyses were performed using IBM SPSS Statistics for macOS, version 29.0 (IBM Corp., Armonk, NY, USA). Categorical variables were analyzed using the chi-square test. The independent t-test was used to compare mean biochemical parameters and hemoglobin levels between patients with AILD alone and those with concomitant AILD and CD. Prevalence estimates were reported with 95% confidence intervals calculated using exact binomial methods. Statistical significance was set at P < 0.05. The normal distribution of continuous variables was assessed using skewness and kurtosis values (±1.5). Categorical variables were summarized as frequencies and percentages.
4. Results
Among the 89 patients included in the study, 40 (44.9%) were diagnosed with AIH, 37 (41.5%) with PBC, and 12 (13.4%) with AIH-PBC overlap. In all three groups, most patients were female, comprising 86.5% of the total cohort. The mean age was 41.98 ± 16.20 years in the AIH group, 56.73 ± 10.87 years in the PBC group, and 47.50 ± 11.95 years in the AIH-PBC overlap group. There was no significant difference in follow-up duration among the groups (Table 1).
Table 1.
| Characteristics | AIH | PBC | AIH-PBC overlap | P-Value |
|---|---|---|---|---|
| Female | 33 (82.5) | 34 (91.9) | 10 (83.3) | 0.455 |
| Mean age (SD) | 41.98 (16.2) | 56.73 (10.8) | 47.50 (11.9) | <0.001 |
| Follow-up duration (months) | 90.9 | 107.2 | 101.5 | 0.524 |
Abbreviations: AIH, autoimmune hepatitis; PBC, primary biliary cholangitis; AIH-PBC overlap, autoimmune hepatitis-primary biliary cholangitis overlap syndrome.
a Values are presented as No. (%) unless otherwise indicated.
b Chi-square test.
c ANOVA Tamhane test.
d Kruskal-Wallis test.
Among patients with abnormal serology, 6 had positive and 4 had borderline anti-tTG IgA results. Upper gastrointestinal endoscopy and duodenal biopsy were performed in all but one patient, who had borderline positivity and declined the procedure. Five patients had biopsy-confirmed Marsh type 3 lesions, all of whom had positive anti-tTG IgA. One patient with selective IgA deficiency underwent endoscopic evaluation due to anti-tTG IgG positivity, but no histological findings consistent with CD were detected (Marsh 0). In addition, one patient with markedly elevated anti-tTG IgG levels underwent endoscopic evaluation, which similarly revealed Marsh 0 histology (Table 2).
Table 2.
| No. | AILD | anti-tTG IgA | anti-tTG IgG | Duodenal biopsy | CD diagnosis | IDA | GI symptoms |
|---|---|---|---|---|---|---|---|
| 1 | AIH | Positive | Positive | Marsh 3 | Diagnosed | Present | Weight loss |
| 2 | AIH | Positive | Positive | Marsh 3 | Diagnosed | Present | Bloating |
| 3 | AIH | Positive | Positive | Marsh 3 | Diagnosed | Present | None |
| 4 | PBC | Positive | Positive | Marsh 3 | Diagnosed | Present | Bloating |
| 5 | AIH-PBC overlap | Positive | N/A | Marsh 3 | Diagnosed | Present | Diarrhea |
| 6 | AIH | Positive | Negative | Marsh 0 | No | Absent | Bloating |
| 7 | AIH | Negative | Positive | Marsh 0 | No | Present | None |
| 8 | PBC | Negative | Severe positive | Marsh 0 | No | Absent | None |
| 9 | AIH | Borderline | Negative | N/A | No | Present | None |
| 10 | AIH | Borderline | Negative | Marsh 0 | No | Absent | Bloating |
| 11 | PBC | Borderline | Negative | Marsh 0 | No | Present | None |
| 12 | AIH | Borderline | Positive | Marsh 0 | No | Present | None |
Abbreviations: AILD, autoimmune liver disease; AIH, autoimmune hepatitis; PBC, primary biliary cholangitis; AIH-PBC overlap, autoimmune hepatitis-primary biliary cholangitis overlap syndrome; CD, celiac disease; N/A, not available; IDA, iron deficiency anemia.
a Patient 7 had selective IgA deficiency; anti-tTG IgG positivity prompted endoscopic evaluation, which showed Marsh 0 histology.
b Patient 8 had markedly elevated anti-tTG IgG levels; duodenal biopsy revealed Marsh 0 histology.
c Patient 9 declined to undergo upper gastrointestinal endoscopy.
The prevalence of biopsy-confirmed CD was 7.5% (3/40; 95% CI, 1.6 - 20.4) in the AIH group, 2.7% (1/37; 95% CI, 0.1 - 14.2) in the PBC group, and 8.3% (1/12; 95% CI, 0.2 - 38.5) in the AIH-PBC overlap group (Table 3).
Table 3.
Anti-tTG IgA Positivity Frequency in Autoimmune Liver Disease Subgroups a
| Anti-tTG IgA | AIH (n = 40) | PBC (n = 37) | AIH-PBC overlap (n = 12) |
|---|---|---|---|
| Positive | 5 (12.5) | 1 (2.7) | 1 (8.3) |
| Borderline | 3 (7.5) | 1 (2.7) | 0 |
| Negative | 32 (80) | 35 (94.6) | 11 (91.7) |
Abbreviations: AILD, autoimmune liver disease; AIH, autoimmune hepatitis; PBC, primary biliary cholangitis; AIH-PBC overlap, autoimmune hepatitis-primary biliary cholangitis overlap syndrome.
a Values are presented as No. (%).
At the time of anti-tTG IgA testing, 82.5% of patients in the AIH group and 66.7% of patients in the AIH-PBC overlap group were receiving immunosuppressive therapy (Table 4).
Table 4.
Immunosuppressive Treatments in Autoimmune Hepatitis and Autoimmune Hepatitis-Primary Biliary Cholangitis Overlap Groups at the Time of Anti-tTG IgA Testing a
| Medications | AIH (n = 40) | AIH-PBC overlap (n = 12) |
|---|---|---|
| Corticosteroids | 11 (27.5) | 1 (8.3) |
| Corticosteroids + AZA | 12 (30) | 3 (25) |
| AZA | 8 (20) | 2 (16.7) |
| MMF | 1 (2.5) | 0 |
| Corticosteroids + MMF | 1 (2.5) | 0 |
| Corticosteroids + tacrolimus | 0 | 1 (8.3) |
| MMF + tacrolimus | 0 | 1 (8.3) |
| No treatment | 7 (17.5) | 4 (33.3) |
Abbreviations: AZA, azathioprine; MMF, mycophenolate mofetil; AIH, autoimmune hepatitis; AIH-PBC overlap, autoimmune hepatitis-primary biliary cholangitis overlap syndrome.
a Values are presented as No. (%).
Specifically, Patient 1 (AIH) was tested and biopsied before any immunosuppressive therapy; Patient 2 (AIH) was receiving corticosteroid monotherapy at both serology and biopsy; Patient 3 (AIH) was receiving combined corticosteroid and azathioprine therapy at both time points; Patient 4 (PBC) was tested and biopsied before any treatment; and Patient 5 (AIH-PBC overlap) similarly had no prior immunosuppressive exposure at the time of testing and biopsy (Table 5).
Table 5.
Serology and Biopsy Testing Timing in Patients with Celiac Disease
| Patient | AILD type | Serology timing | Biopsy timing | Treatment at time of testing |
|---|---|---|---|---|
| 1 | AIH | Pre-treatment | Pre-treatment | None |
| 2 | AIH | On treatment | On treatment | Corticosteroid monotherapy |
| 3 | AIH | On treatment | On treatment | Corticosteroid + azathioprine |
| 4 | PBC | Pre-treatment | Pre-treatment | None |
| 5 | AIH-PBC overlap | Pre-treatment | Pre-treatment | None |
Abbreviations: AILD, autoimmune liver disease; AIH, autoimmune hepatitis; PBC, primary biliary cholangitis; AIH-PBC overlap, autoimmune hepatitis-primary biliary cholangitis overlap syndrome.
No significant differences were found in biochemical parameters or hemoglobin levels at the last visit (Table 6).
| Biochemical parameters | AILD with CD | AILD without CD | P-Value |
|---|---|---|---|
| AST (U/L) | 32.6 ± 8.7 | 27.9 ± 21.5 | 0.87 |
| ALT (U/L) | 41.0 ± 24.9 | 29.0 ± 25.7 | 0.52 |
| ALP (U/L) | 157.0 ± 119.3 | 120.6 ± 67.4 | 0.34 |
| GGT (U/L) | 131.6 ± 135.6 | 53.5 ± 54.3 | 0.60 |
| Albumin (g/dL) | 4.2 ± 0.3 | 4.3 ± 0.58 | 0.35 |
| Total bilirubin (mg/dL) | 0.8 ± 0.4 | 0.6 ± 0.64 | 0.51 |
| Hemoglobin (g/dL) | 12.7 ± 0.5 | 12.7 ± 1.6 | 0.99 |
Abbreviations: AILD, autoimmune liver disease; CD, celiac disease; AST, aspartate aminotransferase; ALT, alanine aminotransferase; ALP, alkaline phosphatase; GGT, gamma-glutamyl transferase.
a Values are expressed as mean ± SD.
b Calculated using the independent t-test. Denominators for each parameter: AST (n = 5 vs n = 84), ALT (n = 5 vs n = 84), ALP (n = 5 vs n = 84), GGT (n = 5 vs n = 84), albumin (n = 5 vs n = 82), total bilirubin (n = 5 vs n = 82), hemoglobin (n = 5 vs n = 83).
Two of the three AIH patients with concurrent CD were in remission. The PBC patient with CD responded to ursodeoxycholic acid therapy, and the patient with AIH-PBC overlap was also in remission.
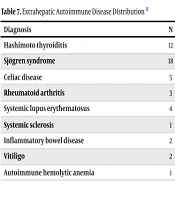
Sjögren syndrome was the most frequently observed extrahepatic autoimmune disease (EHAD) in both the AIH and PBC groups. One patient with CD-PBC had concurrent Sjögren syndrome, Hashimoto disease, and systemic lupus erythematosus, while one patient with CD-AIH had vitiligo as a coexisting EHAD (Table 7).
Table 7.
Extrahepatic Autoimmune Disease Distribution a
| Diagnosis | N | AIH, n = 40 | PBC, n = 37 | AIH-PBC overlap, n = 12 |
|---|---|---|---|---|
| Hashimoto thyroiditis | 12 | 2 (5) | 8 (21.6) | 2 (16.7) |
| Sjögren syndrome | 18 | 5 (12.5) | 11 (29.7) | 2 (16.7) |
| Celiac disease | 5 | 3 (7.5) | 1 (2.7) | 1 (8.3) |
| Rheumatoid arthritis | 3 | 1 (2.5) | 2 (5.4) | 0 |
| Systemic lupus erythematosus | 4 | 1 (2.5) | 1 (2.7) | 2 (16.7) |
| Systemic sclerosis | 1 | 0 | 1 (2.7) | 0 |
| Inflammatory bowel disease | 2 | 1 (2.5) | 1 (2.7) | 0 |
| Vitiligo | 2 | 1 (2.5) | 1 (2.7) | 0 |
| Autoimmune hemolytic anemia | 1 | 0 | 1 (2.7) | 0 |
Abbreviations: AIH, autoimmune hepatitis; PBC, primary biliary cholangitis; AIH-PBC overlap, autoimmune hepatitis-primary biliary cholangitis overlap syndrome.
a Values are presented as No. (%) unless otherwise indicated.
5. Discussion
In this study, the frequency of CD was 7.5% (3/40) in the AIH group, 2.7% (1/37) in the PBC group, and 8.3% (1/12) in the AIH-PBC overlap group.
In a 2015 study by Muratori et al. (8), the frequency of CD was 5% (14/281) in PBC and 3.5% (12/327) in AIH. In the 2021 study by Karakaya et al. (18), the frequency of CD was 3.4% (3/88) in AIH, 2.2% (3/134) in PBC, and 5.3% (1/19) in overlap syndrome. Based on these studies, our series found a higher frequency of CD in the AIH group and a lower frequency in the PBC group compared with the study by Karakaya et al.
In the study by Gencdal et al. (17), CD frequency was 6.4% (3/47) in PBC, 8.7% (2/23) in AIH, and 3% (1/29) in the AIH-PBC overlap group. In contrast, we used stricter diagnostic criteria, requiring both anti-tTG IgA positivity and Marsh type 3 histology, which may contribute to differences in reported frequencies.
Because of their low specificity, antigliadin antibody-based screening methods are no longer recommended (1). Furthermore, studies have found that Marsh I histology occurs in 3.4% - 5.4% of the general population without CD, making Marsh I histology nonspecific for CD in current guidelines (1, 25-27). Therefore, our study focused on tissue transglutaminase IgA positivity and Marsh type 3 histological findings for diagnosis.
The literature demonstrates variability in CD screening and diagnostic criteria. Based on previous studies, CD frequency ranges between approximately 2% and 8% in AIH and 1.7% to 12% in PBC. In our cohort, the observed frequencies fall within these reported ranges. However, interpretation of subgroup differences is limited by the small number of biopsy-confirmed CD cases.
The relationship between EHADs and AIH outcomes has been inconsistently reported. While some studies suggest no significant impact on remission or disease progression (5, 8, 11, 18, 28), others have reported prolonged remission with a gluten-free diet in patients with concomitant CD (28). In our study, statistical comparisons could not be performed because of the low number of CD cases.
In the literature, detailed data regarding the impact of corticosteroid and immunosuppressive therapies on CD antibody screening are limited. In our cohort, a substantial proportion of patients were receiving immunosuppressive therapy at the time of CD testing. Given that corticosteroids and other immunosuppressive agents may suppress both serological responses and histological findings, the true prevalence of CD may be underestimated.
Because CD testing was performed as part of routine clinical practice rather than a standardized screening protocol, our findings reflect the prevalence among previously tested patients rather than the true prevalence in the entire AILD population.
This study has several limitations. First, its retrospective design introduces the possibility of selection bias, as CD testing was not performed systematically but rather according to clinical practice. Second, the relatively small sample size and low number of CD cases limit the statistical power of subgroup analyses. Additionally, missing data inherent to retrospective studies may have influenced some analyses. Furthermore, the long study period raises the possibility of variability in serological assay methods over time. However, the use of clear and well-established diagnostic criteria for CD is a strength.
5.1. Conclusions
In this retrospective study with a limited number of patients, the prevalence of CD was 7.5% among patients with AIH and 2.7% among those with PBC. The prevalence of CD appears higher than that reported in the general population, particularly in the AIH group. However, these findings should be interpreted with caution given the retrospective design and potential selection bias. Our results support the inclusion of CD screening in the initial evaluation of autoimmune liver diseases. Given the high prevalence observed, particularly in AIH, and the potential for immunosuppressive therapy to mask serological and histological indicators, early screening may enhance diagnostic accuracy and guide appropriate management.