


1. Background
2. Objectives
3. Methods
3.1. Cell Culturing and Reagent Preparation
3.2. Isolation and Characterization of Wharton’s Jelly-Derived Mesenchymal Stem Cells
3.3. Exosome Isolation and Analysis
3.4. Real-time PCR for Gene Expression Analysis
| Genes | Forward Primer | Reverse Primer |
|---|---|---|
| Bax | CATGGGCTGGACATTGGACT | CGTGGGCGTCCCAAAGTA |
| Bcl-2 | GCCGTGTTACTTGTAGTGTGT | TTCCACAAAGGCATCCCAGC |
| GAPDH | CCATGGGGAAGGTGAAGGTC | GCAGGAGGCATTGCTGATGA |
3.5. Western Blot Analysis
3.6. Flow Cytometry
3.7. Caspase Activity Measurement
4. Results
4.1. Wharton’s Jelly-Derived Mesenchymal Stem Cells Characterization
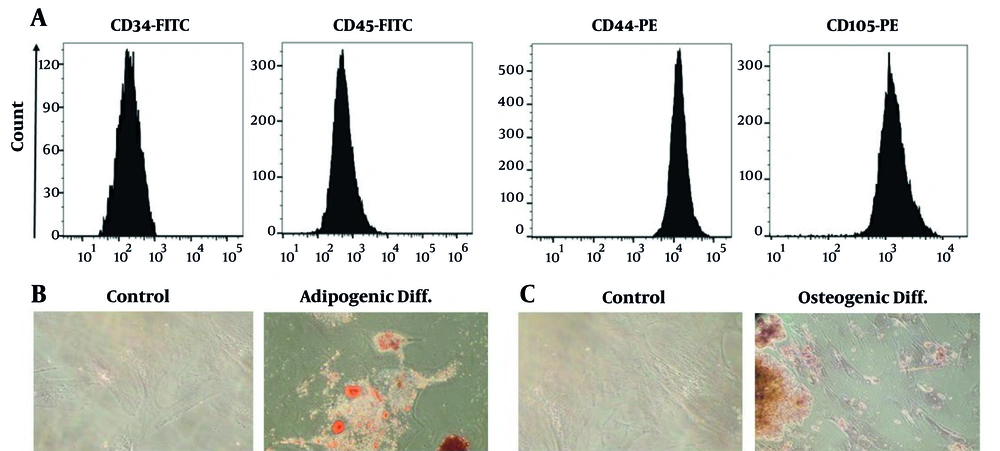
A, Flow cytometric analysis showed that the isolated Wharton’s jelly-derived mesenchymal stem cells (WJ-MSCs) were strongly positive for CD44 and CD105, while lacking CD34 and CD45, confirming their mesenchymal identity; B, after 21 days of adipogenic induction, Oil Red O staining revealed numerous lipid droplets within the cells, indicating successful adipocyte differentiation; C, osteogenic differentiation was confirmed by Alizarin Red staining, which highlighted substantial calcium deposition in the induced cells after 21 days.
4.2. Exosome Characterization
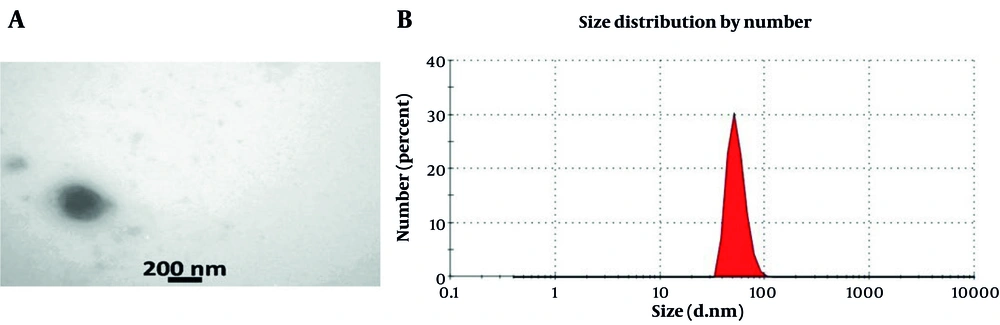
A, Transmission electron microscopy (TEM) images showed that the isolated exosomes had a rounded and vesicular structure, typical of extracellular vesicles; B, size profiling with the Zeta Sizer demonstrated that nearly 85% of the exosomes had an average diameter close to 73 nm, indicating a narrow and consistent size distribution.
4.3. Synergistic Effect of Exosomes and Etoposide on HepG2 Cell Proliferation
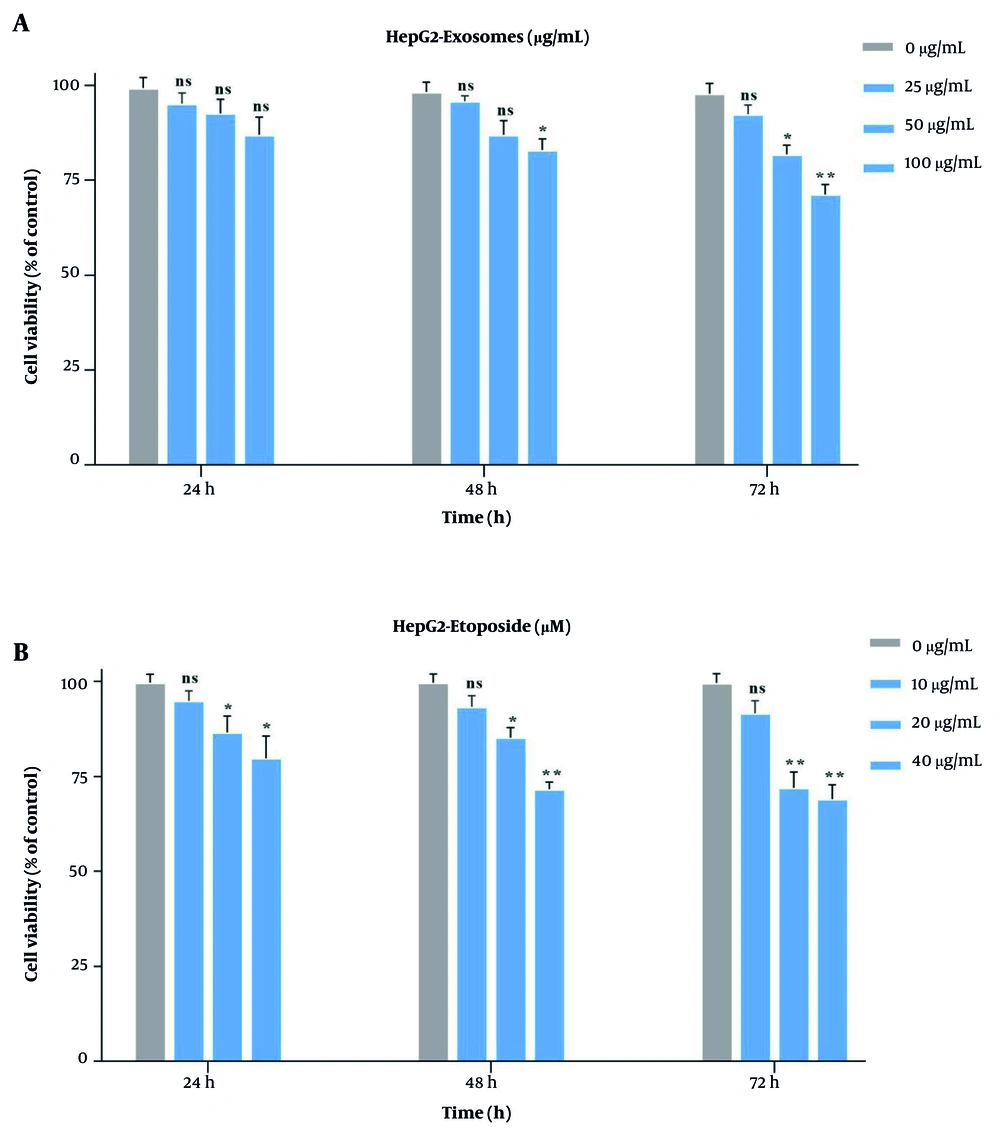
A, The cytotoxic effects of stem cell-derived exosomes on HepG2 cells were assessed using MTT assay at 24-, 48-, and 72-hours post-treatment with increasing concentrations; B, similarly, etoposide (ETO) was applied at ascending concentrations for the same time intervals to evaluate its inhibitory impact on cell viability. (* P < 0.05, ** P < 0.01; ns, not significant).
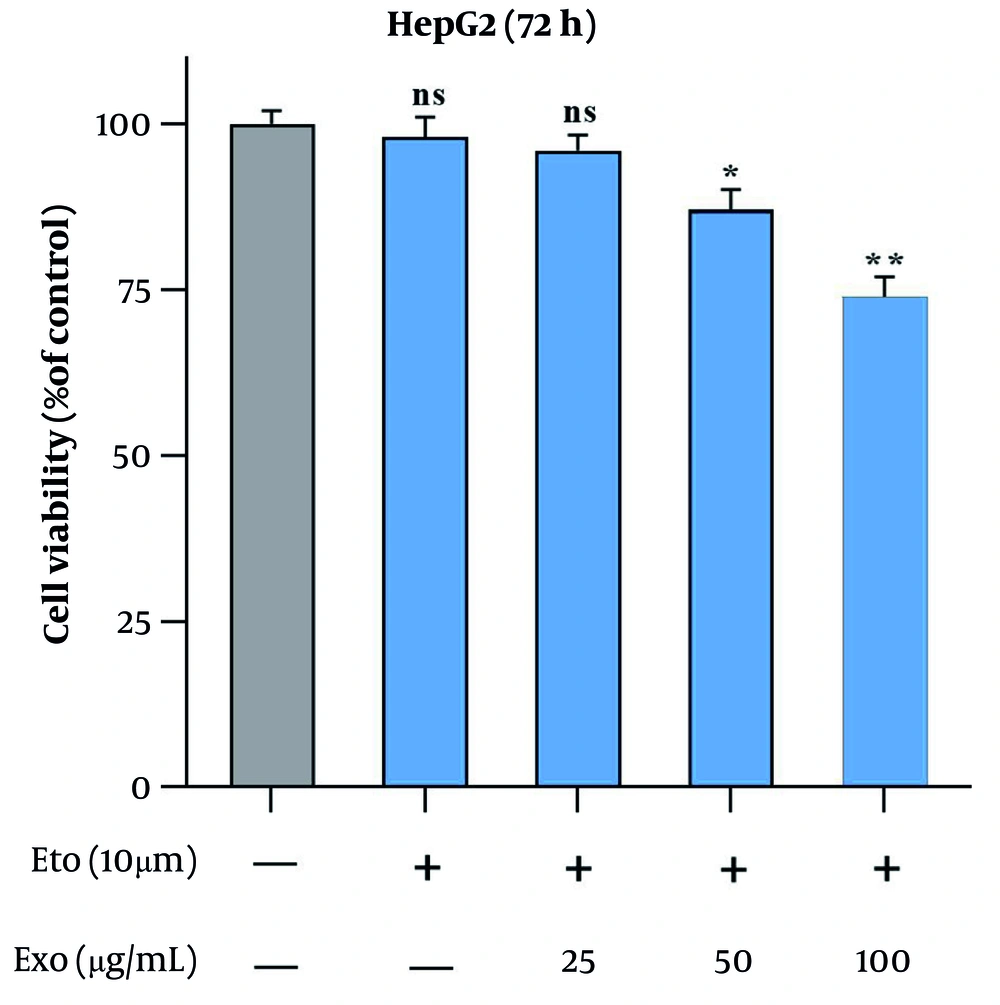
The effects of stem cell-derived exosomes combined with etoposide (ETO) on HepG2 cell proliferation were evaluated using the MTT assay. Cells were treated with 10 µM ETO alongside 25, 50, and 100 µg/mL of exosomes for 72 hours. (* P < 0.05, ** P < 0.01; ns, not significant compared to control).
| Variable | Exo | ||
|---|---|---|---|
| 25 µg/mL | 50 µg/mL | 100 µg/mL | |
| ETO (10 μm) | 0.96 | 0.72 | 0.36 |
Abbreviation: ETO, etoposide.
a Hep-G2 cells incubated with 10μM of etoposide and various concentrations of exosomes. CI was calculated by CompuSyn software. CI < 1.0 represents synergism, CI = 1.0 represents an additive, and CI > 1.0 represents antagonism.
4.4. Exosomes Enhance Etoposide-Induced Apoptosis in HepG2 Cells
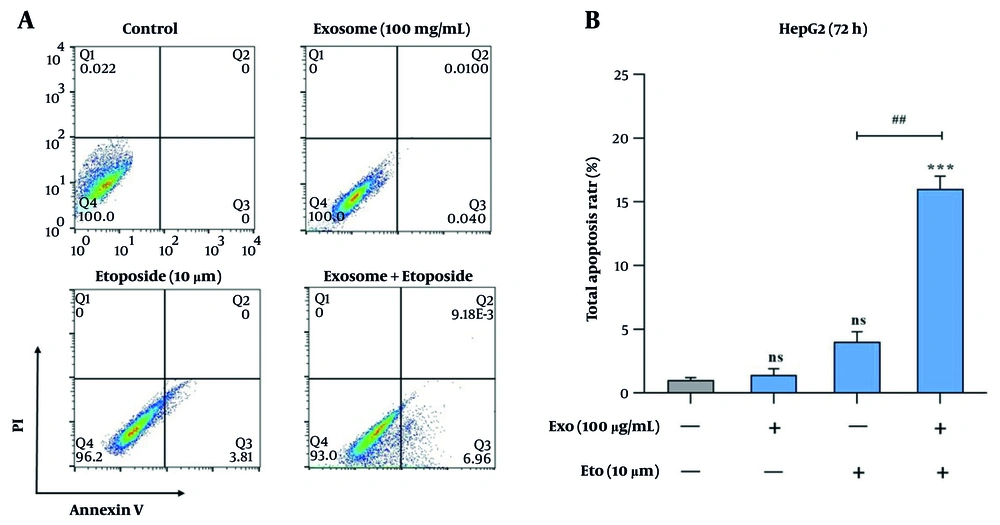
Evaluation of apoptosis induction in HepG2 cells following treatment with exosomes and etoposide (ETO). A, Representative flow cytometry dot plots showing apoptotic cell populations after treatment with exosomes, ETO, or their combination; B, quantitative analysis of apoptotic cells presented as bar graphs. (*** P < 0.001 vs. control; ## P < 0.01 vs. ETO alone).
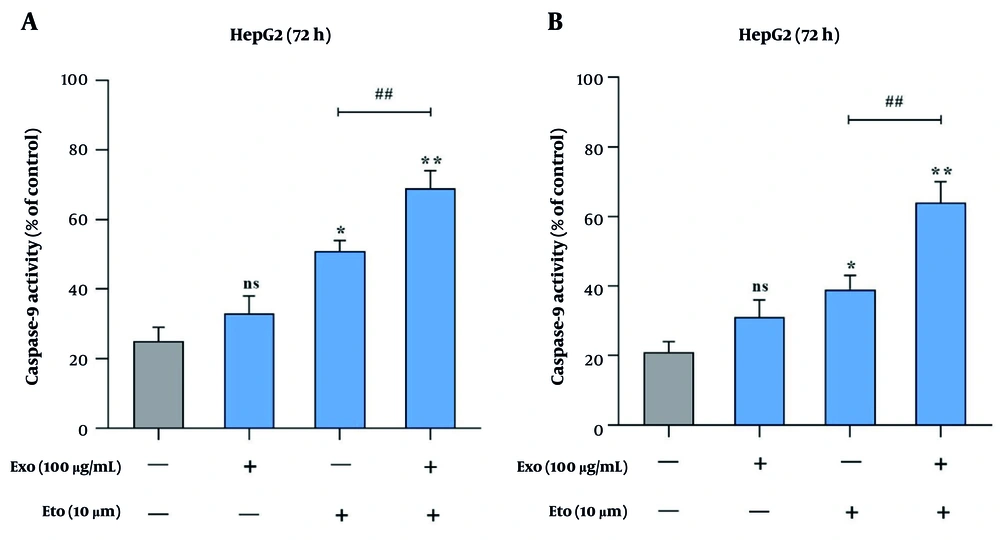
Caspase activity analysis in HepG2 cells following treatment with exosomes and etoposide (ETO). A, Caspase-9 activity levels in response to individual and combined treatments; B, caspase-3 activity levels under the same conditions. (* P < 0.05, ** P < 0.01 vs. control; ## P < 0.01, vs. ETO alone).
4.5. Exosomes and Etoposide Alter Bax/Bcl-2 Expression
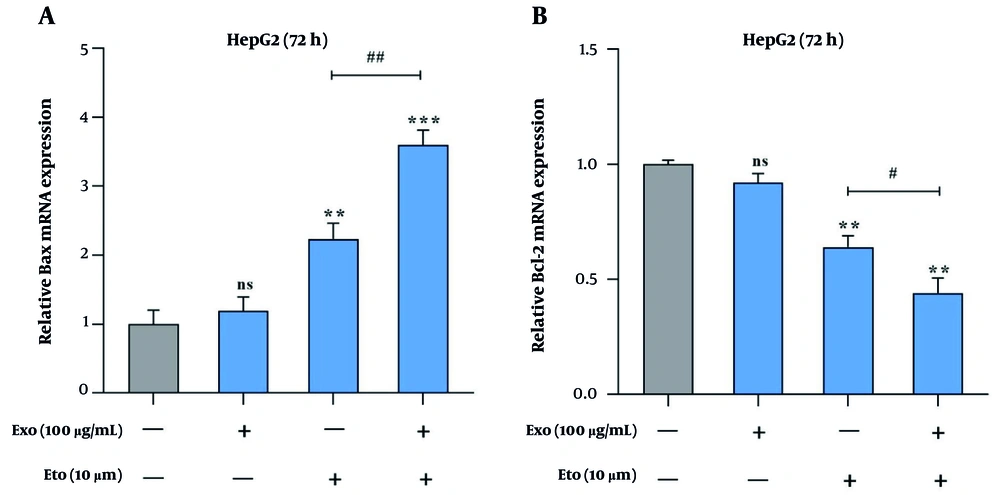
Effects of exosomes and etoposide (ETO) on the expression of apoptosis-associated genes in HepG2 cells. A, Relative expression of Bax in cells treated with exosomes, ETO, or their combination; B, relative expression of Bcl-2 under the same treatment conditions. (** P < 0.01, *** P < 0.001 vs. control; # P < 0.05, ## P < 0.01 vs. ETO alone).
4.6. Exosomes and Etoposide Synergistically Enhance p53 Expression
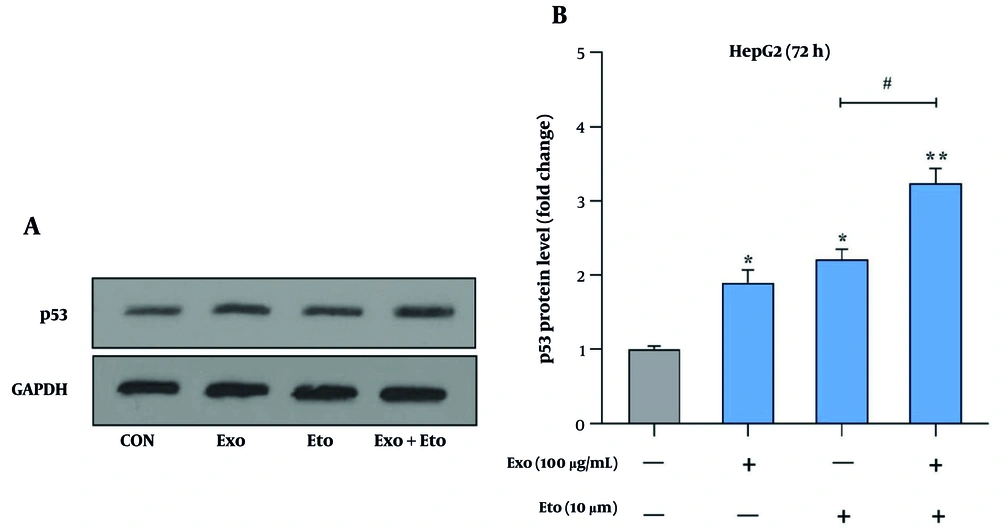
Analysis of p53 protein expression in HepG2 cells following treatment with exosomes and etoposide (ETO). A, Western blot image showing the levels of p53 protein in response to treatments with exosomes, ETO, or their combination. GAPDH was used as a loading control (~36 kDa); B, quantitative analysis of p53 band intensity normalized to GAPDH. (* P < 0.05, ** P < 0.01 vs. control; # P < 0.05 vs. ETO alone).
5. Discussion
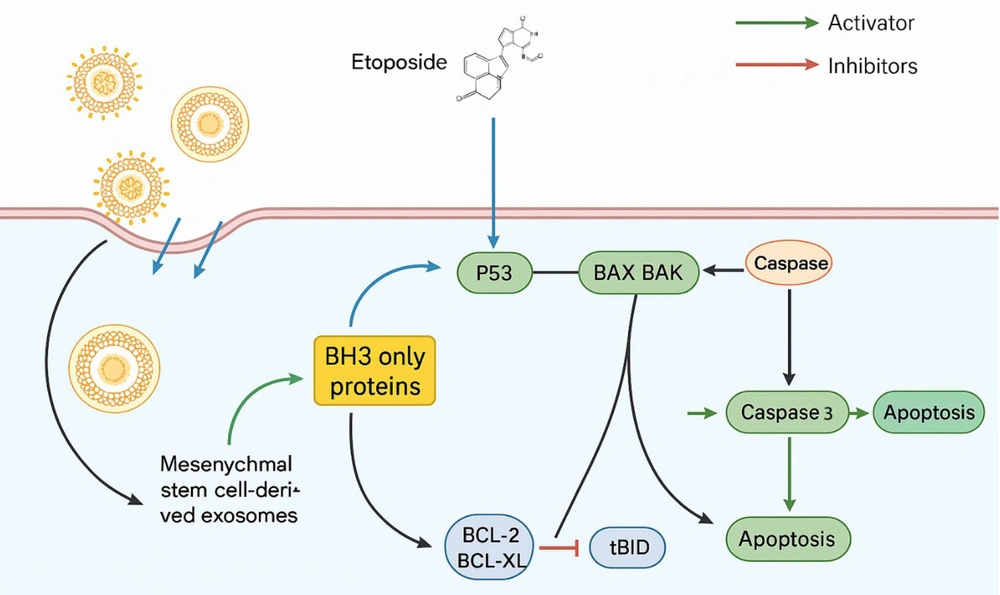
Schematic representation of apoptosis induction in HepG2 cells treated with exosomes and etoposide (ETO). The combined treatment elevates p53 protein levels and upregulates pro-apoptotic Bax expression while downregulating anti-apoptotic Bcl-2. These molecular changes activate caspase pathways, particularly caspase-9 and caspase-3, leading to enhanced apoptosis in liver cancer cells.


