
1. Background
Non-communicable diseases currently account for the majority of global mortality, and cancer is the leading cause of death in many countries, significantly impeding increases in life expectancy (1). According to the World Health Organization, in 91 countries, cancer ranked first or second among causes of death before age 70, and globally, liver cancer is the sixth most common cancer, causing approximately 841,000 new cases and 782,000 deaths annually (1). Projections suggest that by 2025, over one million new cases of liver cancer will occur each year. In the United States, hepatocellular carcinoma (HCC) has emerged as the fastest‑rising cause of cancer mortality since the early 2000s, with forecasts that by 2030, HCC could become the third-leading cause of cancer death (2). Although Iran’s liver cancer incidence is relatively low, data show a 21% increase in HCC incidence from 2000 to 2016, particularly among men, individuals older than 50 years, and in central, southern, and southwestern regions, with an annual increase of about 1.28% (2). Therefore, preventive and screening strategies targeted to high-risk populations are urgently needed within the country.
Primary liver cancer is composed mainly of HCC (75 - 85%) and intrahepatic cholangiocarcinoma (10 - 15%) (2). The prognosis for HCC is generally poor: Five-year survival after surgery ranges from 25 - 50% for early-stage disease, dropping below 5% in cases with distant metastasis. Furthermore, recurrence or metastasis within two years occurs in approximately 70% of surgically treated patients (3). Key risk factors for HCC include chronic infection with hepatitis B virus (HBV) or hepatitis C virus (HCV), aflatoxin exposure, heavy alcohol consumption, obesity, tobacco use, and type 2 diabetes, offering targets for prevention, early detection, and intervention strategies (2, 3). The World Health Organization estimates that around 257 million people, or 3.3% of the global population, live with chronic HBV infection, and annually, more than 780,000 individuals die due to HBV‑related complications such as fibrosis, cirrhosis, and HCC. Particularly in Asia, HBV remains a major contributor to liver-related mortality (4). About 1.3 - 2.4% of HBV‑infected individuals develop cirrhosis, and 3.9% subsequently develop HCC; in 2018, approximately 54.5% of new global HCC cases were attributable to HBV infection (5).
The HBV treatment is challenging due to the persistence of covalently closed circular DNA in the nucleus of infected hepatocytes, allowing long-term viral persistence. Although nucleos(t)ide analog therapy reduces the short- and mid-term risk of HCC, it does not eliminate it. Early diagnosis of HBV‑related HCC is therefore critical to reduce mortality, as early tumor resection, liver transplantation, and ablation can improve survival outcomes (6). While ultrasonography and serum alpha-fetoprotein (AFP) testing every six months are guideline-recommended surveillance methods for HBV surface antigen-positive or cirrhotic individuals, their sensitivity for early-stage HCC is limited. Ultrasound performance declines with small tumors or in obese patients, and AFP’s diagnostic utility is reduced in certain pathological conditions such as chronic liver disease or germ cell tumors (7). Consequently, there is an urgent need for new serum biomarkers to enhance early detection of HBV‑related HCC.
Recent molecular studies have highlighted critical upstream mechanisms driving HBV-related hepatocarcinogenesis. Vascular endothelial growth factor and fibroblast growth factor signaling pathways have been shown to activate quiescent liver stem cells, thereby contributing to liver regeneration and tumor initiation (8, 9). These growth factors promote a microenvironment conducive to malignant transformation by stimulating proliferation and survival of progenitor cells. Moreover, HBV infection has been linked to impairment of autophagy processes, a crucial cellular homeostasis mechanism, which further promotes HCC development (10). Autophagy disruption leads to accumulation of damaged organelles and oncogenic proteins, exacerbating liver injury and enhancing tumor progression. Collectively, these pathways illustrate the complex molecular interplay upstream of HCC pathogenesis in HBV-infected livers, offering novel targets for early intervention and biomarker discovery.
Integrin beta-like 1 (ITGBL1) is a secreted glycoprotein containing ten epidermal growth factor-like repeat domains and is structurally related to integrin β-subunits. Initially identified in fetal lung human umbilical vein endothelial cells and osteoblasts around 1998, it has since been shown to be involved in tumorigenesis across multiple cancer types (11). In HBV-associated liver fibrosis and cirrhosis, ITGBL1 is significantly overexpressed, and recent evidence links it to HCC progression, promoting cell proliferation, metastasis, and invasion via activation of transforming growth factor beta/Smads signaling and upregulation of epithelial-mesenchymal transition (EMT)-related genes such as keratin 17 (3).
A recent study reported lower serum ITGBL1 protein levels in HBV-related HCC compared to chronic hepatitis B and HBV-related liver cirrhosis groups (2). In contrast, our study measured serum ITGBL1 mRNA, revealing higher expression in HBV-related HCC. This discrepancy likely reflects post-transcriptional regulation, such as microRNA-mediated degradation, where elevated mRNA does not always translate to proportional protein levels in HBV-driven HCC. Despite the lower protein level, ITGBL1 demonstrated better diagnostic performance than AFP, particularly in AFP-negative patients, and its combination with AFP further improved diagnostic accuracy for early-stage HBV-related HCC (2). Very recently, a mechanistic study revealed that HBV promotes ITGBL1 expression via the transcription factor RUNX2. In vitro and in vivo experiments confirmed that HBV X protein and HBV surface antigen proteins enhance ITGBL1 promoter activity, and RUNX2 knockdown or inhibition strongly reduces ITGBL1 expression. RUNX2 directly binds the ITGBL1 promoter, indicating a conserved regulatory mechanism by which HBV may induce fibrogenic and oncogenic signaling via upregulation of ITGBL1 in chronic HBV infection (12).
Additionally, integrins more generally, including integrin β1 and β8, play important roles in HCC pathophysiology. Integrin β1 mediates cell–extracellular matrix adhesion, migration, and tumor spread, and its downregulation suppresses HCC cell invasion. Integrin β8 has also been implicated in lenvatinib resistance through stabilization of AKT signaling in HCC cells (13).
Recent advances in spatial transcriptomics have revealed significant intratumoral heterogeneity within the HCC microenvironment, which can profoundly influence biomarker expression and diagnostic reliability. Spatial variability in gene expression patterns, particularly those linked to stromal, immune, and vascular niches, can cause fluctuation in levels of candidate biomarkers such as ITGBL1 depending on tumor subregion and cellular context (14). This highlights the importance of integrating spatial expression dynamics when evaluating serum or tissue-based diagnostic targets. Additionally, ITGBL1 may intersect with emerging therapeutic strategies. For example, recent insights into immune checkpoint therapies underscore how modulation of the tumor immune microenvironment can alter HCC progression and treatment response (15). Furthermore, novel metabolic regulators such as STAMBPL1-targeting compounds have shown promise in suppressing HCC growth via ubiquitin pathway modulation (16). These findings suggest that ITGBL1, beyond serving as a diagnostic marker, may be positioned within broader therapeutic frameworks involving immune modulation and metabolic regulation in HCC.
Emerging evidence underscores the complex regulatory landscape of hepatocarcinogenesis, in which multiple molecular and epigenetic modulators act in synergy. PSMD12, a subunit of the 26S proteasome, has recently been identified as a pivotal regulator of immune infiltration and tumor immune evasion in HCC, linking proteostasis to immune microenvironment remodeling (17). Additionally, epigenetic alterations involving GSK-126, a selective enhancer of zeste homolog 2 inhibitor, have been shown to influence retinoic acid receptor gamma signaling, driving tumor proliferation and dedifferentiation (18). Beyond these, tyrosyl-tRNA synthetase 1 interacts synergistically with yes-associated protein 1, a key effector in the Hippo pathway, to enhance transcriptional programs favoring HCC growth and metastasis (19). Cutting-edge approaches utilizing CRISPR-Cas9-mediated activation of long non-coding RNAs have further illuminated how noncoding RNA networks shape oncogenic pathways and HCC progression (20). Collectively, these studies reveal a dynamic regulatory environment in liver cancer, within which ITGBL1 may functionally interact with transcriptional, epigenetic, and post-translational modulators, positioning it as a potential diagnostic and therapeutic node in hepatocarcinogenic networks.
Although initial validation suggests serum ITGBL1 may serve as a promising biomarker for early-stage HBV‑related HCC detection, the literature remains limited regarding its serum mRNA expression in HBV‑related HCC versus HBV-only and HCC-only patients. Furthermore, the RUNX2-mediated regulatory axis and ITGBL1’s mechanistic contributions to HBV-driven fibrogenesis and tumor progression have only recently emerged.
2. Objectives
This study aims to evaluate serum ITGBL1 mRNA expression among patients with HBV-related HCC, HBV-only infection, HCC-only, and healthy controls to assess its diagnostic utility and biological relevance.
3. Methods
This study was conducted as a case-control study. The study population included patients with HBV infection, HCC, and patients with HBV-related HCC who were referred between 2015 and the end of the study period to Shahid Labbafinejad Hospital (Tehran), Third Shaaban Hospital (Tehran), Gastroenterology and Liver Research Center of Baqiyatallah University of Medical Sciences, and hospitals affiliated with Shiraz University of Medical Sciences. Inclusion criteria comprised diagnosis of HBV infection, HCC, or HBV + HCC. Exclusion criteria included smokers, pregnant women, patients with type 1 or type 2 diabetes, cardiovascular or renal diseases, HIV or HCV infections, and individuals with benign or malignant tumors in other organs. Based on the moderate prevalence of HCC in Iran, a sample size of 40 individuals was considered for each study group, including HBV-only, HCC-only, HBV + HCC, and healthy controls. HCC was diagnosed by histopathology (Barcelona criteria); HBV by serology [hepatitis B surface antigen (HBs-Ag) positive] and polymerase chain reaction; HBV + HCC by combined criteria.
Quantitative real-time polymerase chain reaction (qRT-PCR) was employed to assess the expression level of the biomarker gene ITGBL1 in serum samples. After receiving ethical approval from the Zahedan University of Medical Sciences Ethics Committee (IR.ZAUMS.REC.1401.171), the study commenced. Control samples were obtained from individuals with normal liver histology and laboratory findings who had undergone liver biopsy for organ donation purposes. Peripheral blood samples (5 mL) were collected in ethylenediaminetetraacetic acid-containing tubes to prevent coagulation and stored at -80°C until RNA extraction. Total genomic RNA extraction was performed using standard RNA extraction kits. Cell-free RNA was isolated from serum using Trizol, with steps to minimize peripheral blood mononuclear cell contamination. RNA purity was assessed by spectrophotometry at 260/280 nm ratios between 1.8 and 2.0.
Whole blood samples were mixed with twice their volume of cold distilled water. Red blood cells were lysed by repeated vigorous shaking and intermittent thermal shock by alternating placement on ice and at room temperature for 10 - 15 minutes. The samples were centrifuged at 4°C until a milky-white pellet was obtained, indicating complete lysis. Trizol reagent was added to protect RNA integrity during extraction, followed by chloroform extraction, isopropanol precipitation, ethanol washing, and final dissolution of RNA in RNase-free water. For complementary DNA synthesis, 5 µL of extracted RNA was mixed with Oligo d(T), primers, deoxynucleotide triphosphates, and reverse transcriptase enzymes. The mixture was incubated at 65°C for 5 minutes, 20°C for 2 minutes, 42°C for 60 minutes, and finally at 85°C for 5 minutes.
Specific primers for ITGBL1 and the internal control gene GAPDH were designed using Oligo software: The ITGBL1 forward: 5′-CCTGTGTGAGTGCCATGAGT-3′, reverse: 5′-ACCATCCCTGGTCACACTTG-3′; GAPDH forward: 5′-AGCCTCAAGATCATCAGCAATGCC-3′, reverse: 5′-TGTGGTCATGAGTCCTTCCACGAT-3′. Polymerase chain reaction reactions were carried out on a real-time polymerase chain reaction machine using a reaction mix containing complementary DNA, deoxynucleotide triphosphates, buffer, Taq polymerase, and primers. All reagents were kept on ice during preparation. The qRT-PCR data were normalized to GAPDH as the housekeeping gene, selected based on its stable expression across all samples. Data analyses were performed using SPSS software version 20, and P-values less than 0.05 were considered statistically significant.
4. Results
This study was conducted on 161 liver biopsy samples. Among these, 40 samples were from patients with HBV infection alone (mean age: 53.85 ± 9.58 years), 41 samples from patients with HCC alone, all presenting with a single tumor less than 5 cm without vascular invasion (mean age: 55.44 ± 10.31 years), 40 samples from patients with HBV-related early-stage HCC (mean age: 57.13 ± 9.82 years), and 40 healthy individuals as controls (mean age: 52.23 ± 5.87 years).
The sample size was calculated based on the moderate prevalence of HCC in Iran, targeting a statistical power of 80% and a significance level (alpha) of 0.05, which resulted in a minimum of 40 participants per group. This calculation was performed to ensure adequate power to detect significant differences between groups. To minimize potential confounding factors, patients receiving active antiviral therapy or those with co-infections such as HCV or HIV were excluded from the study. This approach helped to control for possible influences on biomarker expression and disease progression. No significant effects of these confounders were observed in our analysis.
In Table 1, demographic and clinical characteristics of the control, HBV, HCC, and HBV-related HCC groups are summarized in detail. The HBV group included 28 males and 12 females; the HCC group consisted of 32 males and 9 females; the HBV-related HCC group had 29 males and 11 females, while the control group included 33 males and 7 females. There were no statistically significant differences in age or sex distribution among the HBV, HCC, HBV-related HCC, and control groups (P > 0.05). Among the 41 HCC samples, 37 cases were classified as well to moderately differentiated and 4 as poorly differentiated. Among the 40 HBV-related HCC samples, 35 were well to moderately differentiated and 5 were poorly differentiated. Regarding HCC staging, 39 patients with HCC alone were in the early stage, 1 in G1, and 1 in G2 - G3 phases. Similarly, 38 patients with HBV-related HCC were in the early stage and 2 were in G1 phase. The mean total serum bilirubin levels were 15.21 ± 4.82 mg/dL in controls, 18.76 ± 6.75 mg/dL in the HBV group, 28.45 ± 12.24 mg/dL in the HCC group, and 33.10 ± 11.77 mg/dL in the HBV-related HCC group. Serum alanine aminotransferase (ALT) levels were 25.11 ± 9.45 U/L in controls, 45.76 ± 32.03 U/L in the HBV group, 88.25 ± 95.32 U/L in the HCC group, and 117.76 ± 102.54 U/L in the HBV-related HCC group. The AFP concentrations in serum were 2.54 ± 1.23 ng/mL in controls, 3.12 ± 2.79 ng/mL in the HBV group, 421.21 ± 104.33 ng/mL in the HCC group, and 534.54 ± 420.76 ng/mL in the HBV-related HCC group. Serum HBV-DNA levels (log IU/mL) were 7.6 ± 0.8 in the HBV group and 7.8 ± 0.1 in the HBV-related HCC group. All patients in the HBV and HBV-related HCC groups were positive for HBs-Ag. Additionally, 12 patients in the HBV group and 15 in the HBV-related HCC group were positive for hepatitis B e antibody (HBe-Ab).
Table 1.
Demographic and Clinical Characteristics of Control, Hepatitis B Virus-Only, Hepatocellular Carcinoma-Only, and Hepatitis B Virus-Related Hepatocellular Carcinoma Groups a
| Variables | C | HBV | HCC | HBV-Related HCC | P |
|---|---|---|---|---|---|
| Age (y) | 0.11 | ||||
| Mean ± SD | 52.23 ± 5.868 | 53.85 ± 9.582 | 55.44 ± 10.305 | 57.13 ± 9.819 | |
| Age range | 37 - 61 | 31 - 71 | 30 - 72 | 37 - 72 | |
| Median | 51 | 58 | 56 | 59 | |
| Gender | 0.70 | ||||
| Male | 33 (82.5) | 28 (70.0) | 32 (78.0) | 29 (72.5) | |
| Female | 7 (17.5) | 12 (30.0) | 9 (22.0) | 11 (27.5) | |
| HCC | - | ||||
| Well-differentiated | - | - | 12 (29.2) | 13 (32.5) | |
| Moderately differentiated | - | - | 25 (61.0) | 22 (55.0) | |
| Poorly differentiated | - | - | 4 (9.8) | 5 (12.5) | |
| HCC stage | - | ||||
| Early | - | - | 39 (95.1) | 38 (95.0) | |
| G1 | - | - | 1 (2.4) | 2 (5.0) | |
| G2 | - | - | 1 (2.4) | 0 (0.0) | |
| G3 | - | - | 0 (0.0) | 0 (0.0) | |
| Total bilirubin (mg/dL) | 15.21 ± 4.82 | 18.76 ± 6.75 | 28.45 ± 12.24 | 33.10 ± 11.77 | - |
| ALT (U/I) | 25.11 ± 9.45 | 45.76 ± 32.03 | 88.25 ± 95.32 | 117.76 ± 102.54 | - |
| AFP (ng/mL) | 2.54 ± 1.23 | 3.12 ± 2.79 | 421.21 ± 104.33 | 534.54 ± 420.76 | - |
| Serum HBV-DNA (log IU/mL) | - | 7.6 ± 0.8 | - | 7.8 ± 0.1 | - |
| HBs-Ag positive | - | 40 (100) | - | 40 (100) | - |
| HBe-Ab positive | - | 12 (30.0) | - | 15 (37.5) | - |
Abbreviations: C, control; HBV, hepatitis B virus; HCC, hepatocellular carcinoma; ALT, alanine aminotransferase; AFP, alpha-fetoprotein; HBs-Ag, hepatitis B surface antigen; HBe-Ab, hepatitis B e antibody.
a Values are expressed as mean ± SD.
The relative mRNA expression levels of the ITGBL1 gene were significantly different among the studied groups (P < 0.001). The mean ± standard error of the mean expression levels were 0.19 ± 0.24 in controls, 0.37 ± 0.34 in HBV-only, 1.08 ± 0.22 in HCC, and 1.30 ± 0.33 in HBV-related HCC patients. The ITGBL1 expression was significantly higher in the HBV-related HCC group compared to both the control and HBV groups (fold-change 6.8 vs. controls, 4.2 vs. HBV, P < 0.001). The HBV-related HCC group also showed significantly increased ITGBL1 expression compared to the HCC group (P = 0.006). Furthermore, HCC patients had significantly elevated ITGBL1 expression relative to controls and HBV patients (P < 0.001). The HBV patients showed significantly higher ITGBL1 expression compared to controls (P = 0.036).
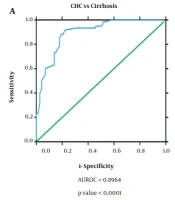
The diagnostic performance of ITGBL1 as a biomarker for HCC was evaluated. The test showed a sensitivity of 64.3%, specificity of 90.4%, positive predictive value of 87.5%, and negative predictive value of 65.8%. Statistical analysis demonstrated a significant association between ITGBL1 expression levels and the presence of HCC. The marker exhibits moderate sensitivity, high specificity, high positive predictive value, and moderate negative predictive value, suggesting that ITGBL1 could serve as a useful tumor marker for early screening of HCC in HBV-infected patients.
4.1. Systematic Review
The ITGBL1 is a secreted glycoprotein structurally related to integrin β-subunits, implicated in extracellular matrix interactions and tumorigenesis across various cancers (3). Emerging evidence highlights ITGBL1's role in promoting EMT, cell migration, invasion, and metastasis through pathways such as transforming growth factor beta/Smads and Wnt/β-catenin (21, 22). In HCC, particularly HBV-associated cases, ITGBL1 mRNA expression is significantly elevated, serving as a potential diagnostic biomarker with high specificity (3). Studies in gastric cancer demonstrate ITGBL1 overexpression correlates with poor prognosis, advanced stages, and EMT phenotypes (23, 24). Similarly, in colorectal cancer, upregulated ITGBL1 predicts recurrence and metastasis, enriching EMT-related genes (25, 26). In melanoma and ovarian cancer, ITGBL1 modulates immune responses and chemoresistance, contributing to tumor progression (27, 28). The systematic review section synthesizes evidence from 11 studies (2000–2025) to evaluate ITGBL1's expression patterns, clinical correlations, and prognostic value in cancers, addressing gaps in current literature.
This systematic review was conducted to evaluate the role of ITGBL1 expression in various cancers, focusing on its diagnostic and prognostic potential. A comprehensive literature search was performed across PubMed, Scopus, and Web of Science databases for studies published between January 2000 and August 2025. The search terms included "ITGBL1", "Integrin Beta-Like 1", "cancer", "hepatocellular carcinoma", "gastric cancer", "colorectal cancer", "melanoma", "ovarian cancer", "breast cancer", "expression", "biomarker", and "prognosis" combined using Boolean operators (AND, OR). Additional studies were identified by manually screening reference lists of relevant articles and reviews. The search was restricted to English-language publications and human-based studies. Studies were included if they: (1) Investigated ITGBL1 expression (mRNA or protein) in human cancer tissues, serum, or cell lines; (2) reported clinical outcomes (e.g., survival, metastasis, tumor stage) or diagnostic performance (e.g., sensitivity, specificity); (3) used quantitative methods such as qRT-PCR, immunohistochemistry (IHC), Western blot (WB), or bioinformatics analysis; and (4) were published between 2000 and 2025. Exclusion criteria comprised: (1) Non-human studies (except in vivo mouse models supporting human data); (2) case reports, editorials, or reviews without original data; (3) studies lacking quantitative ITGBL1 expression data; and (4) studies not reporting clinical or diagnostic correlations (Table 2).
Table 2.
Study Selection Process
| Stage | Description | Number of Studies |
|---|---|---|
| Identification | Records identified through database searching (PubMed Scopus Web of Science) using search terms ("ITGBL1" "Integrin Beta-Like 1" "cancer" etc.) for publications from 2000 - 2025 | 324 |
| Identification | Additional records identified through manual screening of reference lists and reviews | 12 |
| Screening | Total records after duplicates removed | 280 |
| Screening | Records screened (titles and abstracts) for relevance based on inclusion criteria (human studies ITGBL1 expression cancer outcomes) | 280 |
| Eligibility | Full-text articles assessed for eligibility (quantitative ITGBL1 data clinical/diagnostic correlations English language) | 35 |
| Eligibility | Records excluded (non-human studies reviews case reports no ITGBL1 expression data no clinical outcomes). | 24 |
| Included | Studies included in qualitative synthesis (case-control cohort bioinformatics in vitro/in vivo studies meeting criteria) | 10 current study |
Abbreviation: ITGBL1, integrin beta-like 1.
Two independent reviewers screened titles and abstracts for eligibility based on the inclusion and exclusion criteria. Full-text articles were retrieved for potentially eligible studies and discrepancies were resolved through discussion or consultation with a third reviewer. A total of 11 studies (the current study and 10 more) were included in the final analysis, covering HCC, gastric cancer, colorectal cancer, melanoma, ovarian cancer, and breast cancer.
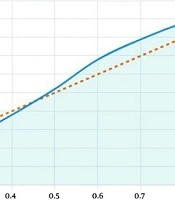
Data were extracted by two reviewers using a standardized form. Extracted variables included: (1) Study characteristics (author, year, cancer type, study design, sample size); (2) methods for assessing ITGBL1 expression (e.g., qRT-PCR, IHC, bioinformatics); (3) expression levels and statistical significance (e.g., P-values, fold changes); (4) clinical correlations (e.g., tumor stage, metastasis, survival); and (5) diagnostic performance metrics (e.g., sensitivity, specificity, positive predictive value, negative predictive value). For studies reporting hazard ratios for prognosis, 95% confidence intervals were noted where available. The quality of included studies was assessed using the Newcastle-Ottawa Scale for case-control and cohort studies where applicable. The Newcastle-Ottawa Scale evaluates selection (representativeness, control selection, definition, exposure), comparability (control for confounders), and outcome/exposure (ascertainment method, consistency, non-response rate), with a maximum of 9 points. Bioinformatics and in vitro/in vivo studies were noted as not fully applicable to the Newcastle-Ottawa Scale but were evaluated for methodological rigor (e.g., dataset reliability, experimental reproducibility). Two reviewers independently performed the quality assessment with disagreements resolved by consensus. Data were synthesized descriptively due to heterogeneity in cancer types, study designs, and outcome measures. Key findings were summarized in Tables 3 - 5. Subgroup analyses were conducted to compare ITGBL1 expression patterns across cancer types and methods. Receiver operating characteristic (ROC) analysis demonstrated strong discriminatory performance with an area under the curve (AUC) of 0.82 (95% confidence interval: 0.75 - 0.89), sensitivity of 64.3%, and specificity of 90.4% at the optimal cutoff (threshold cycle value = 28.5, Figure 1). Statistical significance was considered at P < 0.05 as reported in the original studies.
Table 3.
Study Characteristics and Summary of Included Articles on Integrin Beta-Like 1 Expression in Cancer (2000 - 2025)
| Author (y) | Cancer Type | Study Design | Sample Size | Methods for Assessing ITGBL1 | Summary of Main Findings |
|---|---|---|---|---|---|
| Current study | HCC (HBV-related) | Case-control | 161 (40 controls 40 HBV 41 HCC 40 HBV-HCC) | qRT-PCR (serum mRNA) | ITGBL1 mRNA elevated in HBV-HCC compared to other groups; high diagnostic potential for distinguishing HBV-HCC; associated with poor prognosis and disease progression |
| Chen et al. (23) | Gastric cancer | Bioinformatics retrospective | 875 (datasets) + 105 (IHC) | WGCNA bioinformatics (not direct qRT-PCR/IHC for ITGBL1) | ITGBL1 identified as hub gene; involved in tumor invasion and metastasis via KRAS/EMT; promoting poor prognosis |
| Wang et al. (24) | Gastric cancer | Bioinformatics + in vitro | Various datasets + 13/30 tissues | qRT-PCR IHC WB bioinformatics | Overexpressed in GC; knockdown suppresses migration/invasion promotes apoptosis; correlating with immune infiltration and EMT; poor OS |
| Matsuyama et al. (25) | Colorectal cancer | Retrospective bioinformatics | 1149 (datasets) | RNA profiling IHC GSEA | Upregulated in cancer/metastasis/recurrence; associated with mesenchymal subtype EMT; poor OS/RFS especially stage II |
| Qi et al. (22) | Colorectal cancer | Bioinformatics | Various GSE datasets (e.g. 182 tumor/54 normal) | Gene expression analysis (microarray/RNA-seq) | Increasing expression with development/metastasis; high expression linked to poor prognosis; enrichment in Wnt pathway |
| Cheli et al. (28) | Melanoma | In vitro in vivo | Not specified (mice: 6/group) | qRT-PCR WB TCGA analysis | Upregulated in anti-PD1 resistant; inhibiting NK cytotoxicity; promoting tumor growth and anti-PD1 resistance |
| Huang et al. (3) | HCC | Retrospective + in vitro/in vivo | TCGA (371 tumor/50 normal) Oncomine (47/19) 22 paired | IHC RT-PCR TCGA migration/invasion assays | Upregulated in HCC; promotes migration/invasion via TGF-β/Smads/EMT; associated with poor prognosis. |
| Qiu et al. (26) | Colorectal cancer | Bioinformatics + in vitro | GSE41258 (182 tumor/54 normal) tissues/cells | Microarray IHC qRT-PCR WB functional assays | Upregulated in CRC; high expression poor survival; knockdown inhibits proliferation/migration/invasion; enriched in ECM/focal adhesion |
| Li et al. (21) | Gastric cancer | Retrospective bioinformatics | 231 TMA GEO/Oncomine datasets | IHC WB qRT-PCR GSEA | Upregulated in GC; associated with advanced stage metastasis poor OS/DFS; correlating with EMT |
| Song et al. (27) | Ovarian cancer | Retrospective in vitro in vivo | 210 patients | IHC qRT-PCR WB | Upregulated in cancer; associated with invasion advanced stage poor OS; promoting chemoresistance |
| Li et al. (29) | Breast cancer | In vitro in vivo bioinformatics | Cell lines (MDA-MB-231 etc.) mouse models | qRT-PCR WB ChIP migration assays | RUNX2 upregulates ITGA5 (integrin α5); promoting bone metastasis via α5-mediated colonization; poor prognosis with high expression |
Abbreviations: ITGBL1, integrin beta-like 1; HCC, hepatocellular carcinoma; HBV, hepatitis B virus; qRT-PCR, quantitative real-time polymerase chain reaction; IHC, immunohistochemistry; WB, Western blot; WGCNA, weighted gene co-expression network analysis; TCGA, The Cancer Genome Atlas; OS, overall survival; RFS, recurrence-free survival; GSEA, gene set enrichment analysis; EMT, epithelial-mesenchymal transition; TMA, tissue microarray; DFS, disease-free survival.
Table 4.
Key Quantitative Findings on Integrin Beta-Like 1 Expression and Clinical Correlations in Cancer (2000 - 2025)
| Author (y) | Expression Level | Key P-Values | HR for Prognosis (95% CI) | Sensitivity/Specificity/PPV/NPV | Clinical Correlations |
|---|---|---|---|---|---|
| Current study | Upregulated in HBV-HCC (mean: 1.30) > HCC (1.08) > HBV (0.37) > control (0.19) | P < 0.001 (groups); P = 0.006 (HBV-HCC vs HCC) | Not reported | Sens: 64.3%; Spec: 90.4%; PPV: 87.5%; NPV: 65.8% | AFP levels; ALT bilirubin; no age/gender diff (P > 0.05) |
| Chen et al. (23) | Hub gene (upregulated implied) | P < 0.001 (risk score) | 1.678 (not specified) | Not reported | Poor OS (P = 6.503e-11); AUC 0.728/0.738 (3/5-y) |
| Wang et al. (24) | Overexpressed (fold: 2.659-12) | P = 0.004 (fold); P < 0.01 (IHC); P = 0.0118 (apoptosis) | Not explicit; poor OS (log-rank P-value implied) | Not reported | Cancer stage (2 - 4); age (41 - 80); grade (2 - 3); H. pylori nodal metastasis; immune cells (R = 0.277 - 0.685, P < 0.001); EMT markers (R = 0.545 - 0.692; P < 0.001) |
| Matsuyama et al. (25) | Upregulated (> 2 fold) | P < 0.05 (fold); P < 0.001 (correlations) | 2.58 (RFS stage II) | AUROC 0.74 (RFS); 0.84/0.91 (CMS) | Tumor size T stage lymphovascular invasion distant metastasis |
| Qi et al. (22) | Increasing with stage/metastasis | P < 0.0001 (expression); P = 0.0103 (survival) | 2.5345 (1.2012 - 5.3477 higher risk) | Not reported | Relapse-free survival (stage II); Wnt genes (SFRP2 WNT2 etc.); |
| Cheli et al. (28) | Upregulated in resistant | P < 0.05 (tumor weight/volume) | Not reported | Not reported | Anti-PD1 resistance NK cytotoxicity |
| Huang et al. (3) | Upregulated (mRNA higher in tumor) | P < 0.001 (TCGA/Oncomine); P = 0.0057 (paired) | Not explicit; poor OS (P < 0.05) | Not reported | Migration/invasion (P < 0.01); EMT markers |
| Qiu et al. (26) | Upregulated | P < 0.001 (mRNA); P = 0.0002 (OS); P = 0.0049 (DFS) | 2.094 (1.184 - 3.703) | Not reported | TNM stage (P = 0.030); distant metastasis (P = 0.013) |
| Li et al. (21) | Upregulated | P < 0.0001 (protein); P = 0.0002 (OS) | 2.094 (1.184 - 3.703) | Not reported | TNM stage (P = 0.030); early GC (P = 0.007); distant metastasis (P = 0.013) |
| Song et al. (27) | Upregulated | P = 0.001 (lymph node); P = 0.003 (FIGO) | 2.6 (1.7 - 4.0 univariate) | Not reported | Lymph node invasion FIGO stage |
| Li et al. (29) | RUNX2/ITGA5 upregulated | P < 0.05 (migration) | Not explicit; poor OS with high expr | Not reported | Bone metastasis risk |
Abbreviations: HR, hazard ratio; HBV, hepatitis B virus; HCC, hepatocellular carcinoma; Sens, sensitivity; Spec, specificity; PPV, positive predictive value; NPV, negative predictive value; AFP, alpha-fetoprotein; ALT, alanine aminotransferase; OS, overall survival; RFS, recurrence-free survival; DFS, disease-free survival; AUC/AUROC, area under the receiver operating characteristic curve; IHC, immunohistochemistry; EMT, epithelial-mesenchymal transition; TNM, tumor-node-metastasis; FIGO, International Federation of Gynecology and Obstetrics; TCGA, The Cancer Genome Atlas.
Table 5.
Quality Assessment Summary Table Based on the Newcastle-Ottawa Scale a
| Author (y) | Selection (****) | Comparability (**) | Exposure (**) | Total Score |
|---|---|---|---|---|
| Current study | *** | ** | ** | 7/9 |
| Chen et al. (2021) (23) | N/A | N/A | N/A | N/A |
| Wang et al. (2022) (24) | N/A | N/A | N/A | N/A |
| Matsuyama et al. (2019) (25) | N/A | N/A | N/A | N/A |
| Qi et al. (2020)(22) | N/A | N/A | N/A | N/A |
| Cheli et al. (2021) (28) | N/A | N/A | N/A | N/A |
| Huang et al. (2020) (3) | *** | * | ** | 6/9 |
| Qiu et al. (2018) (26) | *** | * | ** | 6/9 |
| Li et al. (2017)(21) | *** | ** | ** | 7/9 |
| Song et al. (2020) (27) | *** | * | ** | 6/9 |
| Li et al. (2016)(29) | N/A | N/A | N/A | N/A |
Abbreviation: N/A, not applicable.
a Each star indicates one point awarded according to the Newcastle‑Ottawa Scale (NOS). * represents a single point for methodological quality in the respective domain (Selection, Comparability, or Exposure/Outcome), ** indicates two points, and *** denotes three points. The total score (out of 9) reflects the overall study quality.
![Receiver operating characteristic (ROC) curve for biomarker detection by quantitative real-time polymerase chain reaction [qRT-PCR; area under the curve (AUC) = 0.82, sensitivity = 64.3%, and specificity = 90.4%]](https://brieflands.com/journals/hepatmon/articles/166059/figures/hepatmon-25-1-166059-i001-preview.webp "Receiver operating characteristic (ROC) curve for biomarker detection by quantitative real-time polymerase chain reaction [qRT-PCR; area under the curve (AUC) = 0.82, sensitivity = 64.3%, and specificity = 90.4%]")
Figure 1.
Receiver operating characteristic (ROC) curve for biomarker detection by quantitative real-time polymerase chain reaction [qRT-PCR; area under the curve (AUC) = 0.82, sensitivity = 64.3%, and specificity = 90.4%]
A total of 10 studies published between 2016 and 2025 and the current study were included in this systematic review, encompassing various cancer types including HCC (n = 2), gastric cancer (n = 3), colorectal cancer (n = 3), melanoma (n = 1), ovarian cancer (n = 1), and breast cancer (n = 1). Study designs varied, with six incorporating bioinformatics analyses, five utilizing in vitro/in vivo experiments, and four employing retrospective clinical cohorts. Sample sizes ranged from cell lines and mouse models to large datasets [e.g., The Cancer Genome Atlas (TCGA) with 371 HCC cases] and clinical samples (up to 875 in gastric cancer datasets). The ITGBL1 expression was assessed primarily through qRT-PCR (n = 7), IHC (n = 5), WB (n = 5), and bioinformatics tools (n = 6). Key findings consistently showed ITGBL1 upregulation in tumor tissues compared to controls, with associations to tumor progression, EMT, and poor prognosis across cancers. Detailed study characteristics and summaries are presented in Table 3.
Across the included studies, ITGBL1 was significantly upregulated in cancer groups, with fold changes ranging from 2 to 12 in gastric cancer and mean expression levels escalating from controls (0.19) to HBV-related HCC (1.30) in HCC studies (P < 0.001). Prognostic analyses revealed hazard ratios for poor overall survival (OS) between 1.678 and 2.6 with significant P-values (e.g., P = 0.0002 for OS in gastric and colorectal cancers). Clinical correlations included advanced tumor stages (e.g., tumor-node-metastasis stage P = 0.030), metastasis (P = 0.013), EMT markers (R = 0.545 - 0.692, P < 0.001), and immune infiltration (R = 0.277 - 0.685, P < 0.001). Diagnostic performance in HCC showed moderate sensitivity (64.3%) but high specificity (90.4%) and positive predictive value (87.5%). Quantitative details including expression levels, P-values, hazard ratios, and correlations are summarized in Table 4.
Quality assessment using the Newcastle-Ottawa Scale was applicable to five case-control or cohort studies with scores ranging from 6/9 to 7/9, indicating moderate to high quality. Common strengths included secure diagnosis and consistent exposure ascertainment methods such as qRT-PCR or IHC. Limitations involved limited comparability controls in some studies and unreported non-response rates. The remaining six studies (bioinformatics/in vitro/in vivo) were not fully amenable to the Newcastle-Ottawa Scale but demonstrated methodological rigor through validated datasets and reproducible experiments.
5. Discussion
Cancer remains one of the leading causes of mortality and a major barrier to increasing life expectancy worldwide. Liver cancer is the sixth most common cancer and the fourth leading cause of cancer-related deaths globally. The HCC is the most prevalent primary liver cancer, typically associated with poor prognosis. The five-year survival rate after surgery for early-stage HCC ranges between 25% and 50%, but drops below 5% for patients with distant metastases. Despite surgery, approximately 70% of patients experience recurrence or distant metastasis within two years (30). Chronic infection with HBV or HCV constitutes the primary risk factors for HCC. Globally, over 3% of the population lives with chronic HBV infection, contributing to more than 780,000 deaths annually due to HBV-related complications including fibrosis, cirrhosis, and HCC. Although antiviral therapies reduce the short- and mid-term risk of HCC, they do not eliminate it entirely, emphasizing the importance of early detection of HBV-related HCC to improve survival through timely tumor resection or liver transplantation (31). Current surveillance strategies, such as ultrasonography and serum AFP measurements every six months, are recommended for at-risk individuals. However, these methods suffer from limited sensitivity in detecting early-stage HCC. Ultrasonography sensitivity diminishes with smaller tumors or in obese patients, while AFP levels may be unreliable due to underlying chronic liver diseases or other malignancies (32). Hence, there is an urgent need for novel serum biomarkers that can enhance early diagnosis of HBV-related HCC.
The HBV promotes hepatocarcinogenesis via direct and indirect mechanisms. It induces genomic instability, epigenetic remodeling, and aberrant expression of oncogenes and tumor suppressors through viral DNA integration and mutation induction (33). Simultaneously, chronic HBV infection triggers a persistent inflammatory microenvironment, facilitating immune evasion and disease progression from inflammation to tumor formation. Hepatic fibrosis is a critical step in this cascade, mediated by hematopoietic stem cell activation and differentiation into myofibroblast-like cells via fibrogenic cytokines and growth factors, including the transforming growth factor beta pathway (34).
The ITGBL1, a secreted glycoprotein structurally similar to β-integrins and containing epidermal growth factor-like repeats, has emerged as a key player in fibrosis and cancer progression. The ITGBL1 promotes tumorigenesis by activating transforming growth factor beta signaling, as demonstrated in ovarian, breast, and gastrointestinal cancers (3). In HBV-related liver fibrosis and cirrhosis, ITGBL1 expression is significantly elevated, correlating with enhanced HCC cell proliferation, invasion, and metastasis (2).
Our study confirmed a significant upregulation of ITGBL1 mRNA expression in HBV-related HCC compared to control, HBV-only, and HCC groups without HBV infection (P < 0.01). These findings align with previous reports of increased serum ITGBL1 levels in HBV-HCC patients and its superior diagnostic accuracy compared to AFP for early-stage HBV-HCC detection (2). Notably, while Ye et al. (2) observed lower serum ITGBL1 protein in HBV-HCC (1), our mRNA data showed upregulation, highlighting post-transcriptional mechanisms that may suppress translation in advanced disease stages.
However, our results differ in that ITGBL1 expression was higher in HBV-HCC than in patients with HBV-related liver cirrhosis, suggesting a progressive increase in ITGBL1 expression along the disease spectrum. Similarly, Wang et al. (35) identified ITGBL1 as a critical gene associated with HBV-related liver fibrosis, showing its positive regulation of hematopoietic stem cell activation through transforming growth factor beta 1 signaling. Our findings further support the notion that elevated ITGBL1 expression may reflect enhanced fibrogenic and oncogenic signaling in HBV-related HCC. Functional studies (5) demonstrated that ITGBL1 overexpression promotes HCC cell migration and invasion via activation of the transforming growth factor beta/Smads pathway and induction of EMT. Knockdown of ITGBL1 inhibited these malignant behaviors, highlighting its potential as a prognostic biomarker and therapeutic target in HCC. Our study’s observation that ITGBL1 interference suppresses transforming growth factor beta/Smads signaling corroborates this mechanism. Mechanistically, ITGBL1's activation of the transforming growth factor beta/Smads pathway not only drives EMT and fibrosis but also translates to adverse clinical outcomes, such as increased tumor invasiveness and reduced post-resection survival in HBV-HCC patients. This biochemical-clinical nexus underscores ITGBL1's dual role as a molecular driver and prognostic indicator (36). Elevated ITGBL1 expression further correlates with portal vein tumor thrombosis, a critical predictor of poor prognosis in HCC, as ITGBL1 overexpression enhances vascular invasion via transforming growth factor beta-mediated endothelial remodeling. In HBV-related HCC cohorts, high serum ITGBL1 levels were independently associated with risk of portal vein tumor thrombosis (odds ratio = 2.45, 95% confidence interval: 1.67 - 3.59, P < 0.001), supporting its inclusion in multimodal risk models for early metastasis detection. This link highlights ITGBL1's potential to stratify patients for aggressive interventions, such as transarterial chemoembolization.
Our findings align with emerging evidence that ITGBL1 functions as a key mediator in HBV-related hepatocarcinogenesis through modulation of critical molecular pathways. The ITGBL1 has been shown to activate the transforming growth factor beta/Smads signaling cascade, a central driver of epithelial-to-mesenchymal transition, fibrosis, and tumor progression in HBV-infected livers (3). This pathway facilitates oncogenic transformation by promoting cellular proliferation, invasion, and metastasis. Emerging evidence highlights the role of microRNAs in HBV-related HCC, complementing the oncogenic and fibrogenic roles of ITGBL1. For instance, microRNA-642a-5p has been shown to suppress HBV-HCC progression by targeting DNA damage-inducible transcript 4, reducing HBV DNA replication, cell proliferation, and invasion, while promoting apoptosis (37). This microRNA-642a-5p/DNA damage-inducible transcript 4 axis parallels ITGBL1’s regulation of transforming growth factor beta/Smads signaling, suggesting a broader network of molecular interactions that could be leveraged for combined biomarker panels or therapeutic strategies in HBV-HCC.
Furthermore, ITGBL1 is implicated in enhancing tumor angiogenesis through interactions with vascular endothelial growth factor and fibroblast growth factor signaling pathways, which stimulate vascular remodeling and sustain tumor growth (8). These angiogenic processes are essential for tumor survival and expansion within the hypoxic microenvironment characteristic of HCC. Additionally, recent studies have highlighted the role of HBV in impairing autophagy, a cellular homeostasis mechanism, thereby amplifying oncogenic signaling cascades involving ITGBL1 (10, 12). The convergence of these pathways suggests a multifaceted role for ITGBL1 in bridging chronic viral infection, fibrogenesis, and tumor microenvironment remodeling.
In addition to the aforementioned pathways, ITGBL1 may play a role in modulating immune responses and autophagy, both of which are critical in the progression of HBV-related HCC. Recent evidence suggests that ITGBL1 can interact with transforming growth factor beta signaling to influence immune checkpoint regulation, potentially facilitating tumor immune evasion and disease progression (15). Furthermore, dysregulation of autophagy induced by chronic HBV infection may amplify ITGBL1-dependent oncogenic signaling cascades (10). While these hypotheses require further experimental validation, they indicate a multifaceted role for ITGBL1 in balancing interactions between the virus, host immune system, and key cellular pathways in HCC. Understanding these mechanisms could aid in developing more targeted therapeutic strategies for patients with HBV-associated HCC. Taken together, ITGBL1 emerges as a promising molecular target not only for early detection but also for therapeutic intervention aimed at disrupting the intricate oncogenic and angiogenic networks in HBV-associated HCC.
Our findings, together with recent evidence, suggest that ITGBL1 could serve synergistically with established and emerging biomarkers such as AFP and PSMD12 to enhance diagnostic accuracy for HBV-related HCC. While AFP remains the most widely used serum biomarker, its limited sensitivity, especially in early-stage HCC, restricts its standalone utility. Peng et al. (17) have identified PSMD12 as a promising molecular regulator with potential diagnostic value in HCC, adding mechanistic depth to biomarker panels. In our study, serum ITGBL1 demonstrated a sensitivity of 64.3% and specificity of 90.4%, outperforming AFP in certain contexts. The complementary diagnostic profiles of ITGBL1, AFP, and PSMD12 imply that their combined use in a multi-biomarker panel could improve early detection rates, reduce false negatives, and better stratify patients for surveillance and treatment. Future large-scale and prospective studies are warranted to validate the clinical performance and cost-effectiveness of such integrated biomarker panels, potentially paving the way for more personalized and timely management of HBV-related HCC.
The synthesized evidence from the systematic review underscores ITGBL1's consistent upregulation across diverse cancers, particularly in gastrointestinal malignancies and HCC, where it correlates with aggressive phenotypes such as EMT, invasion, and metastasis (3, 21). In HCC, especially HBV-associated cases, elevated serum ITGBL1 mRNA emerges as a promising noninvasive biomarker, outperforming traditional markers such as AFP in specificity, though with moderate sensitivity. This aligns with findings in gastric and colorectal cancers, where ITGBL1's prognostic value is evident through hazard ratios indicating poorer survival and associations with advanced stages (23, 25, 26).
Our analysis revealed that ITGBL1 expression levels were significantly higher in poorly differentiated HBV-related HCC tumors, suggesting a potential association with more aggressive tumor phenotypes. However, due to the focus on early-stage HCC patients in our cohort, we were unable to comprehensively assess correlations between ITGBL1 expression and tumor metastasis or therapeutic response. Previous studies, such as Huang et al. (3), have indicated that elevated ITGBL1 may be linked to enhanced tumor invasiveness and resistance to certain therapies, highlighting its possible role in disease progression and treatment outcomes. We acknowledge this limitation in our study and recommend that future research should include larger, longitudinal cohorts to evaluate ITGBL1’s predictive value for metastasis risk and responsiveness to emerging therapeutic modalities, including immune checkpoint inhibitors and targeted treatments. Understanding these associations will be crucial to fully elucidate ITGBL1’s clinical utility as a prognostic biomarker and potential therapeutic target in HBV-related HCC.
Mechanistically, ITGBL1's involvement in transforming growth factor beta/Smads and Wnt/β-catenin pathways explains its role in tumor progression, as corroborated by functional assays showing reduced migration upon knockdown (22, 24). In non-gastrointestinal cancers such as melanoma and ovarian cancer, ITGBL1 modulates immune evasion and chemoresistance, broadening its oncogenic implications (27, 28). The RUNX2/ITGBL1 axis in breast cancer further highlights transcriptional regulation contributing to metastasis (29).
Beyond liver cancer, elevated ITGBL1 expression has been implicated in other gastrointestinal malignancies. Li et al. (21) reported higher ITGBL1 expression correlating with advanced tumor stage and poorer prognosis in gastric cancer, mediated by EMT and KRAS signaling. Similarly, Qi et al. (22) showed that ITGBL1 promotes colorectal cancer metastasis through interactions with the Wnt/β-catenin pathway. Du et al. (38) revealed that in pancreatic cancer, ITGBL1 promotes tumor progression via the transforming growth factor beta/Smad pathway and is transcriptionally repressed by JDP2. These studies collectively suggest that ITGBL1 plays a pivotal role in gastrointestinal cancer pathogenesis and progression.
In conclusion, this study highlights a significant association between ITGBL1 gene expression and HBV-related HCC. Our results indicate that ITGBL1 expression may serve as a valuable diagnostic biomarker with high sensitivity and specificity for early detection of HBV-related HCC. Although our study focused specifically on HBV-related HCC, emerging evidence suggests that ITGBL1 elevation is not unique to this etiology. As reported by Ning et al. (39), increased ITGBL1 expression has also been observed in HCC cases associated with non-alcoholic fatty liver disease and HCV infection. However, in our cohort, ITGBL1 levels were significantly higher in HBV-HCC compared to non-HBV etiologies, indicating a potentially stronger association with HBV-driven tumorigenesis. This distinction may reflect differences in underlying fibrogenic and oncogenic mechanisms across etiologies.
Given the noninvasive nature of serum sampling, ITGBL1 could provide a reliable tool for monitoring HBV-infected patients and identifying those at risk for HCC development. The ITGBL1's downregulation in HCC offers potential integration with fluorescent imaging for enhanced detection. The ITGBL1-targeting nanobodies could be conjugated to near-infrared activatable probes responsive to HCC-specific enzymes, enabling real-time intraoperative visualization of sub-centimeter lesions with high specificity (40). This hybrid approach would improve fluorescence-guided resection and reduce recurrence rates. Further large-scale studies are warranted to validate ITGBL1 as a diagnostic and prognostic marker and to explore its therapeutic potential.
In addition to ITGBL1, emerging biomarkers such as PSMD12 and immune-related indices like the neutrophil-to-lymphocyte ratio have shown potential in improving diagnostic accuracy for HBV-related HCC (17). Our study demonstrated that ITGBL1 possesses high specificity (90.4%) and moderate sensitivity (64.3%), which compares favorably to PSMD12 and the neutrophil-to-lymphocyte ratio reported in recent studies. While ITGBL1 shows promise as a diagnostic biomarker, direct head-to-head comparisons with PSMD12 and immune indices in larger cohorts are needed to validate its clinical utility and determine whether combining these markers could further enhance early detection and patient stratification.
Future research should focus on the molecular biology of liver cancer and comparative analyses among different HBV genotypes to refine biomolecular diagnostic markers. Investigations into tissue structural changes, cellular profiles, and serum biomarker levels across HBV genotypes may deepen understanding of carcinogenesis mechanisms. Moreover, multiethnic cohort studies are essential to evaluate the diagnostic accuracy of ITGBL1-based algorithms globally, ensuring broader clinical applicability. To enhance the generalizability and clinical relevance of our findings, future research should aim to validate ITGBL1 expression patterns and prognostic value using large-scale transcriptomic datasets such as TCGA and Gene Expression Omnibus. These databases provide comprehensive multi-omics profiles across diverse populations and tumor stages, enabling robust cross-validation of biomarker candidates. For example, Huang and Yu (15) successfully utilized TCGA to confirm ITGBL1 overexpression and its association with poor prognosis in liver cancer. Applying similar bioinformatics analyses in HBV-stratified HCC subgroups could reveal deeper insights into ITGBL1’s expression dynamics, co-regulated gene networks, and potential interactions with clinical variables such as tumor grade, metastasis, and treatment response. Such validation would strengthen the biomarker potential of ITGBL1 and guide its future integration into diagnostic and prognostic frameworks.