
1. Background
Celiac disease (CD) is an immune-mediated enteropathy characterized by mononuclear cell infiltration and villous atrophy in the proximal small intestine, which can lead to malabsorption (1). The estimated prevalence of CD is moderate (1 - 2% of the global population); with prospective cases remaining undiagnosed and untreated, patients endure indefinite risk to their health (2). In Iran, evidence from systematic reviews indicates a pooled prevalence of CD of approximately 0.72% (95% CI: 0.62 - 0.98%), with serologic and histology estimates ranging from 0.79% and 0.83% (3). The etiology of CD is still not completely understood, with varied clinical presentations due to nutrient malabsorption. A range of extra-intestinal symptoms highlights the systemic nature of CD (4, 5). Genetic associations of CD include human leukocyte antigen (HLA) haplotypes DQ2 and DQ8, with tissue transglutaminase playing a role in the disease pathogenesis (6). Gluten is the primary environmental trigger of CD; however, infant feeding practices and microbiota may also contribute (7).
Several studies have documented that CD patients are significantly less likely to attain the protective threshold of anti-HBs antibody (≥ 10 IU/L), with a pooled risk ratio of 0.77 compared to healthy children (8). Given that there are similar genetic associations between CD and lack of vaccine responses to hepatitis B virus (HBV) vaccination, it has been suggested that CD may put individuals at risk for lower or absent immune responses following HBV vaccination (8).
2. Objectives
The purpose of this study was to compare the responses to the HBV vaccine in children with CD and healthy children. In addition, we examined the relationship between the patients’ responses to the hepatitis B vaccine and possible risk factors [adherence to a gluten-free diet, types of CD (typical and atypical), severity of CD (mild, moderate, severe), and presence of at least one background disease].
3. Methods
3.1. Study Design
This is a cross-sectional observational study with matched groups to compare the immune response in children with CD and healthy children receiving the hepatitis B vaccine. The study also aimed to evaluate the associations between the study cohort's responses to the hepatitis B vaccination and risk factors such as clinical vigilance for CD risk factors and compliance with diet. The study was conducted at the Celiac Clinic in Shiraz University of Medical Sciences (SUMS), Shiraz, Iran, from February 2022 to May 2023.
3.2. Participants
A total of 130 children participated in the study, comprising children with CD (n = 65) and healthy children (n = 65). Each participant was 18 years of age or younger and had received all recommended doses of the standard hepatitis B vaccine (which consisted of three doses of a recombinant HBV vaccine) at least 6 months before study engagement. Subjects were excluded if they had a history of hepatitis B infection or other immunocompromising illnesses.
The participants were recruited from the patient population who attended the Celiac Clinic from February 2022 to May 2023. The CD patients were identified from the gastroenterology clinic (cases with a diagnosis of CD were being followed). The healthy children were selected from those attending the same clinic for routine developmental check-ups and/or minor acute problems (and who had no history indicating they had been diagnosed with or followed for a potentially chronic condition).
The CD was diagnosed according to the European Society for Pediatric Gastroenterology, Hepatology, and Nutrition (ESPGHAN), as positive serology [anti-tissue transglutaminase antibodies (tTG-IgA) and/or anti-endomysial antibodies (EMA-IgA) from the same laboratory] followed by a biopsy of the duodenum showing villous atrophy (grade 2 or grade 3 Marsh classification). Healthy children had no CD, confirmed by negative serology (negative tTG-IgA and EMA-IgA).
3.3. Sample Size Calculation
The sample size was calculated using G*Power software version 3.1.9.2. Previous studies have estimated that 46 - 70% of individuals with CD have protective anti-HBs levels, whereas 80 - 90% of healthy individuals have protective anti-HBs levels. Therefore, it was assumed there would be a difference in proportions of at least 20%. With a significance level of 0.05 and power level of 0.80, it was estimated that a total sample size of 130 was required.
3.4. Data Collection
Demographic and clinical data from all participants were collected using a structured questionnaire and review of medical charts. The severity of CD was classified based on the Marsh-Oberhuber histological grading system, where mild corresponds to Marsh 1 - 2 (partial villous atrophy), moderate to Marsh 3a (subtotal villous atrophy), and severe to Marsh 3b - 3c (total villous atrophy) (9).
Blood samples were taken from all participants to measure anti-HBs antibody levels, a measure of the immune response to the hepatitis B vaccine. Anti-HBs antibody levels were measured with a commercial chemiluminescence immunoassay (CLIA) kit (7C18-29, Abbott ARCHITECT). The assay was performed according to the manufacturer's instructions and expressed in milli-international units per milliliter (mIU/mL). According to guidelines, a measure of anti-HBs ≥ 10 mIU/mL indicated protective immunity.
3.5. Ethical Considerations
This study was approved by the Ethics Committee of SUMS (approval number: IR.SUMS.MED.REC.1401.211). The study strictly followed the Declaration of Helsinki. Written informed consent was obtained from the parents or legal guardians of all participants; the purpose, procedure, and potential risks were explained to them. The participants were informed that they could withdraw from the study at any time, without compromising medical care.
3.6. Statistical Analysis
Data were analyzed using SPSS version 20.0 (IBM Corp., Armonk, NY, USA). Descriptive statistics were used to summarize participant characteristics, including means and standard deviations for quantitative variables and counts and percent frequencies for qualitative ones.
The primary outcome was the proportion of participants with protective anti-HBs levels (≥ 10 mIU/mL). Secondary outcomes included the association between anti-HBs levels and possible risk factors in CD patients: Adherence to a gluten-free diet; types of CD (a typical case of CD presents with significant gastrointestinal complaints such as chronic diarrhea, abdominal pain and distension, malabsorption, and often extreme lack of growth and failure to thrive in children. An atypical case of CD has little or no gastrointestinal symptoms, but rather extra-intestinal symptoms, including anemia, osteoporosis, short stature, dermatitis herpetiformis, or hallucinations); severity of CD (mild, moderate, and severe); and the presence of at least one background (comorbid) disease.
An independent proportion comparison (the chi-square method) was used to compare the proportion of participants with protective anti-HBs categories between CD patients and controls. Multivariable conditional logistic regression analysis was used to analyze the association between potential risk factors and anti-HBs antibody levels (titers ≥ 10 mIU/mL were considered protective and < 10 mIU/mL were considered non-protective). For all analyses, a P-value of less than 0.05 was considered statistically significant.
4. Results
4.1. Characteristics of the Participants
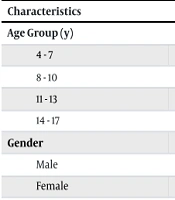
In total, 130 participants were enrolled, consisting of 65 children with diagnosed CD and 65 healthy children. The age distribution of participants was four to seven years [18 (13.8%)]; eight to ten years [32 (24.6%)]; eleven to thirteen years [41 (31.5%)]; and fourteen to seventeen years [39 (39.0%)]. The sex distribution of participants was 53 males (40.8%) and 77 females (59.2%). All participants were vaccinated against hepatitis B and provided a complete vaccination history (Table 1).
Table 1.
Age and Sex Distribution of the Participants a
| Characteristics | CD (N = 65) | Healthy Children (N = 65) | Total (N = 130) | P-Value |
|---|---|---|---|---|
| Age Group (y) | > 0.05 | |||
| 4 - 7 | 9 (13.8) | 9 (13.8) | 18 (13.8) | |
| 8 - 10 | 16 (24.6) | 16 (24.6) | 32 (24.6) | |
| 11 - 13 | 20 (30.8) | 21 (32.3) | 41 (31.5) | |
| 14 - 17 | 20 (30.8) | 19 (29.2) | 39 (30.0) | |
| Gender | > 0.05 | |||
| Male | 27 (41.5) | 26 (40.0) | 53 (40.8) | |
| Female | 38 (58.5) | 39 (60.0) | 77 (59.2) |
Abbreviation: CD, celiac disease.
a Values are expressed as No. (%).
Among the CD cohort, 51 participants (78.5%) were on a gluten-free diet and 14 (21.5%) were not. The CD types included 20 (30.8%) with typical CD and 45 (69.2%) with atypical CD. Severity of the disease was noted as mild in 32 (49.2%), moderate in 20 (30.8%) and severe in 13 participants (20.0%). Finally, 46 celiac patients (70.8%) did not have any background disease, and 19 (29.2%) had at least one background disease.
4.2. Comparison of Anti-HBs Antibody Levels Between the Groups
Vaccination efficacy of hepatitis B was assessed by measuring anti-HBs antibody titers, where ≥ 10 mIU/mL are considered protective (Table 2). In patients with CD, 38 (58.5%) had protective titers, and 27 (41.5%) did not. In healthy children, 30 (46.2%) had protective titers, and 35 (53.8%) did not. Overall, 68 participants (52.3%) had protective titers and 62 participants (47.7%) did not.
Table 2.
Comparison of Protective Effect of Hepatitis B Virus Vaccination Between the Groups a
| Anti-HBSAbTiter | CD (N = 65) | Healthy Children (N = 65) | Total (N = 130) | P-Value |
|---|---|---|---|---|
| ≥ 10 (protective) | 38 (58.5) | 30 (46.2) | 68 (52.3) | 0.160 |
| < 10 (non-protective) | 27 (41.5) | 35 (53.8) | 62 (47.7) |
Abbreviations: HBSAb, hepatitis B surface antibody; CD, celiac disease.
a Values are expressed as No. (%).
To compare the proportions of participants with protective levels of anti-HBs between the CD group and healthy children, a chi-square analysis was performed. There was no statistically significant difference between the CD group and the healthy control group for levels of anti-HBs [χ2(1) = 1.973, P = 0.160]. The odds ratio for having protective levels of anti-HBs in the CD group compared to the healthy children was 1.642 (95% CI: 0.821 - 3.286), which indicates no difference.
4.3. Risk Factors for Vaccine Effectiveness in the Celiac Disease Group
Conditional logistic regression analysis was conducted to investigate the potential associations between various risk factors and the presence of protective anti-HBs levels in the CD group. The variables included in the model were age group, sex, adherence to a gluten-free diet, type of CD, severity of CD, and background disease.
In the first model, only the type of CD had a statistically significant association with protective anti-HBs levels (B = -2.756, P = 0.004, OR = 0.064). This indicated that participants with atypical CD were statistically significantly less likely to have protective anti-HBs levels compared to participants with typical CD.
In the final model (Table 3), the type of CD was still a statistically significant predictor of protective anti-HBs levels (B = -1.547, P = 0.025, OR = 0.213, 95% CI: 0.054 - 0.843), which indicates that having atypical CD is a risk factor for lower vaccine effectiveness. Age group was a variable that was borderline significant, with the 4 - 7 year age group being more likely to have protective levels (B = 1.883, P = 0.063, OR = 6.571, 95% CI: 0.905 - 47.727), although it was not statistically significant at the P minimum of 0.05.
Table 3.
Final Variables in the Regression Model
| Risk Factors | B | P-Value | OR | 95% CI for OR |
|---|---|---|---|---|
| Celiac types (atypical vs. typical) | -1.547 | 0.025 | 0.213 | 0.054 - 0.843 |
| Age group (4 - 7 y) | 1.883 | 0.063 | 6.571 | 0.905 - 47.727 |
Abbreviation: OR, odds ratio.
Other variables, including sex, gluten-free diet compliance, CD severity, and background disease, did not reveal a statistically significant relationship with protective anti-HBs levels in the final model.
5. Discussion
This study evaluated the effectiveness of the hepatitis B vaccine in children with CD versus healthy children in terms of anti-HBs antibody titers. We found that there was no statistically significant difference in vaccine-induced immunity in children with CD (58.5% protective response) compared to healthy children (46.2% protective response). However, atypical disease presentation was significantly associated with a decreased likelihood of having protective antibody levels in the CD group. Clinically, our findings suggest monitoring anti-HBs levels in children with atypical CD, potentially warranting booster vaccinations.
The literature on immune response to hepatitis B vaccination in patients with CD has produced mixed results. Multiple investigations have documented a lower seroconversion rate in untreated or newly diagnosed CD individuals, which may be attributed to impaired immune response secondary to gluten-induced intestinal damage, or HLA-DQ2/DQ8-mediated mechanisms impacting antigen presentation (10, 11). Nemes et al. documented a seroconversion rate of only 51% in untreated CD patients, which was much lower than that reported in healthy children (12). Leonardi et al. also found that 50% of celiac patients screened showed unresponsiveness to vaccination (11). In contrast to the controls, in our study we demonstrated a higher protective response rate in CD patients (58.5%) than in the controls (46.2%). However, the differences between the groups were not statistically significant. This could be due to the high rate of dietary compliance in our CD group (78.5%), which may mitigate the adverse influence of gluten on the immune response in patients with CD. In a similar investigation, Ertem et al. found a 3.6% failure rate when screening celiac patients on a strict gluten-free diet, suggesting that celiac patients can have an improved response when following a strict gluten-free diet (10).
We found a significant association between atypical presentation of CD and vaccine non-responsiveness. This is a new finding that has not been previously reported in the literature and could reflect a different immunological profile in individuals with atypical presentation who may exhibit a suboptimal immune response to vaccination. Mormile and Vittori discuss the possibility that polymorphisms in Th1 cytokine genes are associated with both susceptibility to CD and non-response to HBV vaccine, specifically IL-18 and IFN-γ (13). This permits further immunophenotypic studies to explore this relationship.
Our analysis also found a borderline relationship between younger age (4 - 7 years) and protective antibody levels, but it was not statistically significant. Several previous studies have shown that the time since vaccination and older age are associated with decreased antibody titers (14). Two studies indicated that gluten-free diet adherence and age at vaccination might be relevant contributory factors (10, 11). Therefore, higher protection among younger children may reflect more recent vaccination or a less pronounced failure in immunity.
This research has some limitations. First, there was a relatively small sample size, which could limit the statistical power to detect small differences between the groups. Second, although anti-HBs levels were measured cross-sectionally, there was no information about when the last vaccine dose was given and the exact time since vaccination, both of which could affect antibody levels. Third, we did not objectively measure dietary adherence, relying instead on self-reported adherence, which might be subject to recall or social desirability bias. Finally, we did not test cellular immunity, which could provide protection even with low antibody titers.
5.1. Conclusions
We found no significant difference between the CD group and healthy children in the levels of anti-HBs. However, there was a significant association between atypical CD and reduced vaccine effectiveness. There is potential that clinical phenotype could influence post-vaccine immune outcomes. This could provide a basis for future screening or booster policies for subsets of the celiac population.
Future studies should aim to use longitudinal designs to track antibody levels over time in celiac patients, grouped by disease phenotype, dietary adherence, and genetic characteristics. In addition, it could be beneficial to investigate T-cell responses and boosted doses in non-responders to help optimize vaccination strategies. Non-classical CD may be undertreated, and it becomes a priority to identify potential individuals who may not respond to vaccinations to reduce this vaccine-preventable disease in this vulnerable population.