
1. Background
An ecological dysregulation of the dental biofilm is the cause of periodontal disease, a chronic infectious illness (1), with an overall prevalence of 45 - 48% (2) among US adults. At 11.2% of the world's population, it is the sixth most common human disease in its most severe form (3). Unhealthy lifestyles such as smoking, low-quality diets (high-fat, high-sugar diets), and mental stress (depression, etc.) can significantly increase the risk of periodontitis. Periodontitis is primarily driven by dysbiotic polymicrobial communities, with key pathogens including Porphyromonas gingivalis, Prevotella intermedia, and Prevotella corporis, among others. Risk factors such as smoking, poor diet, and psychological stress significantly contribute to its development (4). Prior research has demonstrated how periodontal disease may exacerbate the onset of systemic disorders (5), including metabolic disorder such as non-alcoholic fatty liver disease [NAFLD; now also referred to as metabolic associated fatty liver disease (MAFLD) or metabolic dysfunction-associated steatotic liver disease (MASLD)] (6).
Due to the global obesity epidemic, smoking, high-fat and high-sugar diets, and mental stress, NAFLD is currently among the most prevalent liver conditions in adults and children worldwide (7). The NAFLD can progress along a pathological spectrum. It often begins with simple steatosis, which can then evolve into non-alcoholic steatohepatitis (NASH), leading to liver fibrosis and ultimately cirrhosis (8, 9), which is often irreversible and can necessitate liver transplantation (10, 11).
Recently, epidemiological studies have suggested that periodontitis increases the prevalence of NAFLD and fibrosis (12). The pathogenesis may involve systemic inflammation and oxidative damage (13). Another plausible mechanism that links dental health to liver function is the concept of the "oral-intestinal-liver axis" (5).
2. Objectives
The relationship between periodontal disease and NAFLD has been discussed from in vitro, in vivo, and epidemiological perspectives. This study investigated the possible cause-and-effect link between liver disorders and periodontitis using data from both Mendelian randomization (MR) and the National Health and Nutrition Examination Survey (NHANES) database.
3. Methods
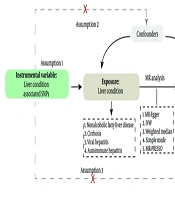
The study was divided into two phases, as illustrated in Figure 1. In the first stage, we conducted multivariable logistic regression analyses using data from the NHANES database to examine the connection between liver disorders and periodontitis. In the second stage, we conducted four MR analyses using data from the Gene-Lifestyle Interactions in Dental Endpoints (GLIDE) consortium and FinnGen database to examine the mutual relationship that exists between liver disorders and periodontitis.
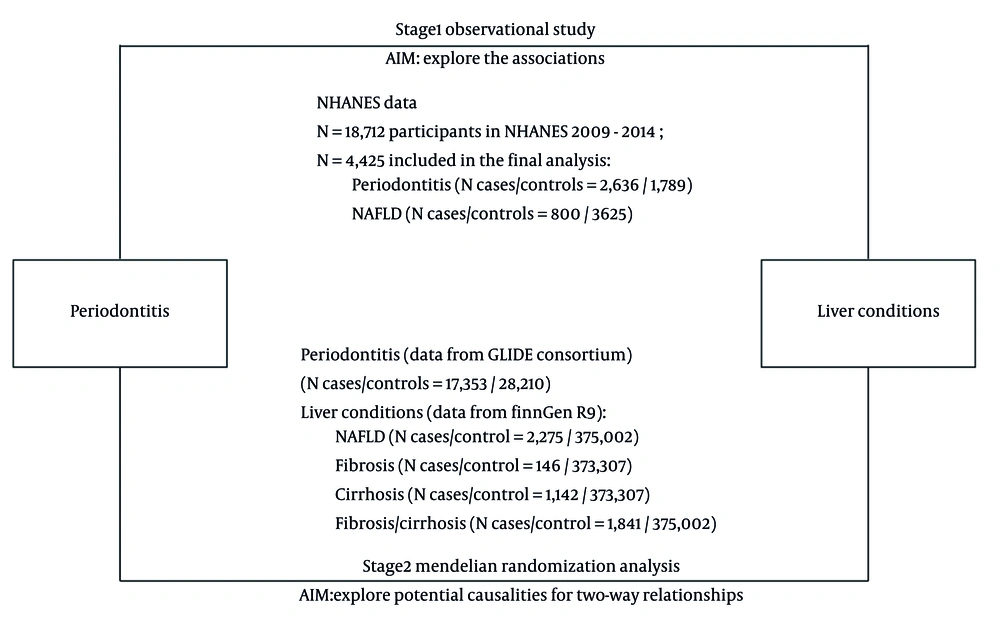
Figure 1.
Overall study design
3.1. National Health and Nutrition Examination Survey
3.1.1. Data Sources and Study Population
The NHANES is a collection of a sequence of cross-sectional surveys aimed at the non-institutionalized population in the United States. It selects a nationally representative sample using a multi-stage probability sampling technique and assesses the nutritional and health condition of the participants. The survey includes interviews conducted at participants' households, physical evaluations, and laboratory examinations. The NHANES is administered by the National Center for Health Statistics, a division of the Centers for Disease Control and Prevention (CDC). The National Center for Health Statistics Ethics Review Board has given the study ethical approval, and all participants have provided written informed consent.
The participant selection process is detailed in Figure 2. Initially, 30,468 participants from NHANES 2009 - 2014 were considered. After excluding individuals without periodontal data, 18,712 participants remained. Subsequent exclusions were applied for missing laboratory examination data, key covariates (e.g., lifestyle factors, baseline characteristics), as well as pregnant individuals and Body Mass Index (BMI) outliers. Finally, 4,425 participants were included in the cross-sectional analysis.
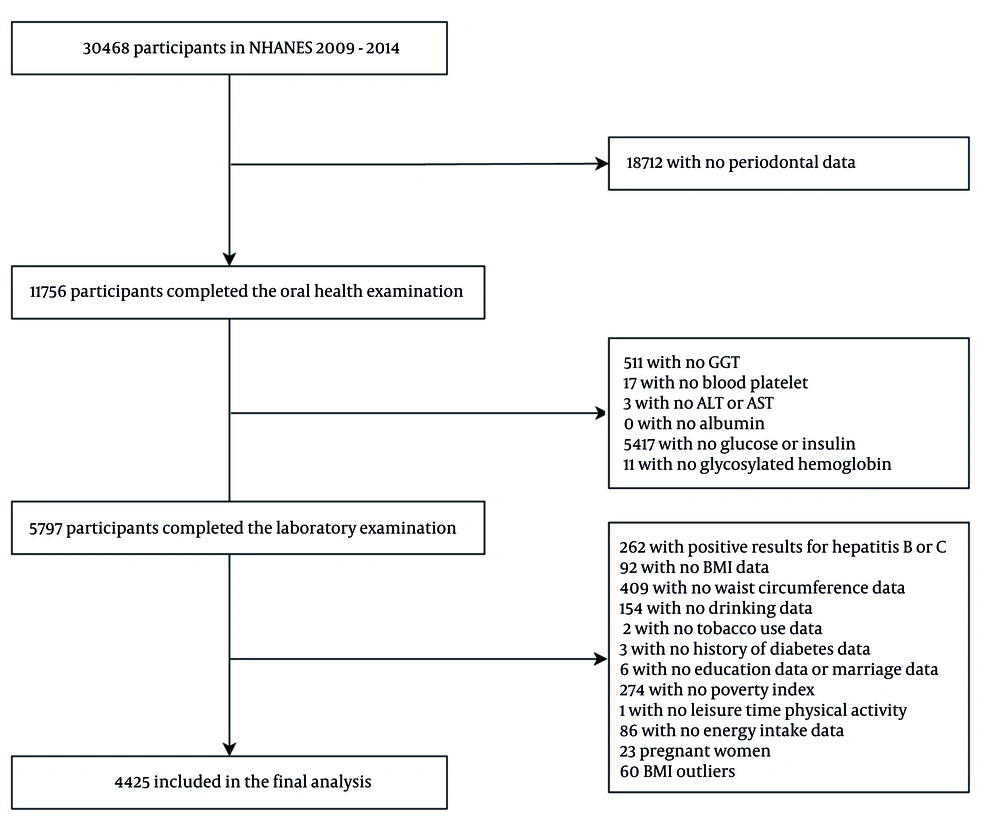
Figure 2.
Participant inclusion algorithm of National Health and Nutrition Examination Survey (NHANES)
3.1.2. Assessment of Periodontitis and Liver Diseases
The oral health statistics from NHANES (2009 - 2014) show that qualified examiners evaluated the clinical attachment loss (CAL) and periodontal probing depth (PD) at six specific locations for every tooth (excluding wisdom teeth), for a total of 28 teeth. The 2018 global classification criteria were used to determine the diagnosis of periodontitis: When interdental CAL is evident in ≥ 2 non-adjacent teeth, or when buccal or oral CAL ≥ 3 mm is observed in ≥ 2 teeth with a pocket depth exceeding 3 mm, it is classified as periodontitis (14).
The NAFLD was diagnosed by ultrasonographic Fatty Liver Index (USFLI) ≥ 30, a validated surrogate marker that incorporates demographic and metabolic parameters for the non-invasive assessment of hepatic steatosis. The formula for how USFLI was determined can be referred to in the cited reference (15).
Participants who were at risk of advanced fibrosis (AF) were identified by elevated scores for the non-alcoholic fatty liver disease fibrosis (NFS), Fibrosis-4 Index (FIB-4), or the aspartate aminotransferase (AST)/Platelet Ratio Index (APRI). The NFS is a scoring system used to determine how likely or severe it is that NAFLD may cause fibrosis (the production of scar tissue) in the liver. Without requiring a liver biopsy, medical personnel can assess the degree of fibrosis using the easily accessible and non-invasive FIB-4 instrument. To assess the level of liver fibrosis (scarring) in individuals suffering from liver disease, doctors employ the non-invasive APRI scoring system. The calculations for NFS, FIB-4, and APRI were performed according to the cited reference (16). Those with an APRI exceeding 1, FIB-4 greater than 2.67, or NFS surpassing 0.676 were classified as individuals at high risk of AF, as per the criteria outlined in the reference.
3.1.3. Assessment of Covariates
The thorough evaluation of covariates plays a pivotal role in research, as it serves to control potential confounding factors, thereby ensuring a more precise and dependable assessment of the primary associations. In our study, we carefully selected a set of covariates to enhance our understanding of the link between periodontal disease and liver conditions. We included several key covariates such as age, gender, ethnicity, BMI, drinking, recent tobacco use, history of diabetes, education, marital status, family monthly Poverty Level Index, energy intake, and leisure time physical activity (LTPA), all of which were gathered through standardized questionnaires. Additionally, the weight and height of each participant were measured during physical examinations, with BMI calculated as weight (kg)/height (m2).
3.1.4. Statistical Analyses
We combined data from the years 2009 to 2014 and created 6-year sampling weights in accordance with NHANES' sampling methodology, which were incorporated into all analyses. To assess variances in continuous and categorical variables across various analysis groups, we used the t-test for continuous data and the Rao Scott chi-square test for categorical variables. The impact of liver disorders on the risk of periodontitis was investigated using a multivariable logistic regression analysis. We computed odds ratios (ORs) and the associated 95% confidence intervals. In the multivariable analysis, we made the following adjustments: In model 1, no covariate adjustments were performed; in Model 2, age, gender, and race adjustments were applied; in model 3, BMI, education level, household income poverty ratio, smoking status, physical activity, and history of diabetes were adjusted. All analyses were performed using SAS 9.4. The significance threshold was set at 0.05, and two-sided levels of significance were computed.
3.2. Mendelian Randomization Analysis
3.2.1. Basic Concept of Mendelian Randomization Analysis
When compared to traditional observational approaches, MR analysis is less susceptible to errors resulting from reverse causation and confounding since genetic differences are assigned randomly during gamete development and are not connected to environmental variables. As a result, we used MR analysis in this work to identify single nucleotide polymorphisms (SNPs) associated with liver disorders and periodontitis. Following this, we integrated these identified SNPs to ascertain the connection between periodontitis and liver diseases.
3.2.2. Study Design Description
The investigation of the relationship between liver disorders and periodontitis used a two-sample MR analysis. We conducted the MR analyses utilizing summary statistics from open-access databases to examine the association between periodontitis as the exposure and liver conditions including NAFLD, fibrosis, cirrhosis, and fibrosis/cirrhosis as the outcomes. The study does not require ethical approval because it is based on publicly available summary statistics.
3.2.3. Data Sources and Selection of Instrumental Variables
The summary statistics derived from two European datasets served as the foundation for the two-sample MR analysis: Data for periodontitis (17,353 cases; 28,210 controls) from a genome-wide association study (GWAS) of the European studies of the GLIDE consortium (17); and liver conditions including NAFLD (2,275 cases; 375,002 controls), fibrosis (146 cases; 373,307 controls), cirrhosis (1,142 cases; 373,307 controls), and fibrosis/cirrhosis (1,841 cases; 375,002 controls) from FinnGen (18), which was based on over 370,000 Finland residents with reliable diagnoses in a wide range of diseases (Appendix 1, in the Supplementary File).
The SNPs were chosen for instrumental variable selection at a genome-wide significance criterion (P < 5 × 10⁻⁶). SNPs that were deemed eligible for clumping were selected using a 10,000 kb window size and linkage disequilibrium as determined by r2 > 0.001. Palindromic SNPs were excluded from exposure and outcome data when harmonizing them. Finally, we verified that all instrumental variables did not impact the outcomes through other pathways by applying PhenoScanner for possible related traits. In order to ensure the trustworthiness of results and reduce the interference of confounders related to SNPs with P-value < 1 × 10⁻⁵, the PhenoScanner database was utilized (19).
3.2.4. Statistical Analysis
The random-effects inverse variance weighting (IVW) approach is the main statistical methodology used in this study to investigate the possibility of bidirectional causation between liver illness and periodontitis. To further enhance our results, we also used the weighted mode, weighted median, and MR Egger techniques. The IVW method operates on the premise that all fundamental assumptions of MR are satisfied. Nevertheless, given that the inclusion of pleiotropic instrumental variables can introduce bias into IVW estimates, we conducted sensitivity analyses to account for any pleiotropic effects. R (version 4.3.2) was utilized to conduct the MR analysis. Three packages, "TwoSampleMR" (20), "MRPRESSO" (21), and "forestploter", were specifically used for the data processing and visualization. The study was reported using the STROBE-MR criteria (22).
3.2.5. Pleiotropy and Sensitivity Analysis
The MR-Egger regression was used to determine if horizontal pleiotropy existed. The average pleiotropic impact of the instrumental variables is reflected in the intercept term of the MR-Egger regression. In addition, we looked for the existence of pleiotropy using the Mendelian randomization Pleiotropy REsidual Sum and Outlier (MR-PRESSO) test. The MR-PRESSO serves multiple purposes, including the detection of horizontal pleiotropy, the correction of horizontal pleiotropy by identifying and removing outliers, and the evaluation of significant differences in causal effects both before and after the elimination of outliers. We used MR-Egger regression and the IVW technique to measure heterogeneity, and we calculated the degree of heterogeneity using Cochran's Q statistic. We also performed a leave-one-out analysis to assess the consistency and robustness of our results.
4. Results
4.1. Baseline Characteristics of Periodontitis, Non-alcoholic Fatty Liver Disease, Fibrosis and Cirrhosis in National Health and Nutrition Examination Survey
The baseline characteristics of NAFLD and periodontitis in the research subjects are listed in Table 1. A total of 4,425 participants were enrolled in our study, of which 2,636 were diagnosed with periodontitis. With a mean age of 54.5 years, the periodontitis patient group’s age was comparatively higher. Gender distribution showed that 56.2% of the population was male, somewhat more than the 43.8% female. Compared to the healthy control group, those with periodontitis were more likely to be male, older, smokers, diabetics, had lower levels of education, and had a lower family income.
Table 1.
Baseline Characteristics of Study Population in National Health and Nutrition Examination Survey 2009 - 2014 and Prevalence of Periodontitis and Non-alcoholic Fatty Liver Disease by Characteristics a
| Characteristics | Total (N = 4425) | Periodontitis | NAFLD | ||||
|---|---|---|---|---|---|---|---|
| No (N = 1789) | Yes (N = 2636) | P-Value | No (N = 3625) | Yes (N = 800) | P-Value | ||
| Age (y) | 53.1 ± 0.2 | 51.1 ± 0.4 | 54.5 ± 0.3 | < 0.01 | (51.9 ± 0.2) | (58.9 ± 0.5) | < 0.01 |
| Gender | < 0.01 | < 0.01 | |||||
| Male | 2226 (50.3) | 745 (41.6) | 1481 (56.2) | 1761 (48.6) | 465 (58.1) | ||
| Female | 2199 (49.7) | 1044 (58.4) | 1155 (43.8) | 1864 (51.4) | 335 (41.9) | ||
| USFLI | 27.6 ± 0.3 | 25.4 ± 0.5 | 29.1 ± 0.4 | < 0.01 | 22.0 ± 0.3 | 53.0 ± 0.6 | < 0.01 |
| NFS | -1.5 ± 0.02 | -1.6 ± 0.03 | -1.4 ± 0.03 | < 0.01 | -1.7 ± 0.02 | -0.7 ± 0.05 | < 0.01 |
| FIB-4 | 1.3 ± 0.01 | 1.3 ± 0.02 | 1.3 ± 0.02 | < 0.01 | 1.3 ± 0.01 | 1.4 ± 0.03 | < 0.01 |
| APRI | 0.4 ± 0.01 | 0.4 ± 0.01 | 0.4 ± 0.01 | 0.90 | 0.4 ± 0.01 | 0.4 ± 0.01 | 0.37 |
| BMI (kg/m2) | 29.0 ± 0.09 | 28.9 ± 0.1 | 29.1 ± 0.1 | 0.27 | 28.1 ± 0.1 | 33.0 ± 0.2 | < 0.01 |
| Ethnicity | < 0.01 | < 0.01 | |||||
| Mexican American | 614 (13.9) | 179 (10.0) | 435 (16.5) | 455 (12.6) | 159 (19.9) | ||
| Other hispanic | 424 (9.6) | 150 (8.9) | 274 (10.4) | 338 (9.3) | 86 (10.8) | ||
| Non-hispanic white | 2106 (47.6) | 1026 (57.4) | 1080 (41.0) | 1721 (47.5) | 385 (48.1) | ||
| Non-hispanic black | 814 (18.4) | 267 (14.9) | 547 (20.8) | 718 (19.8) | 96 (12.0) | ||
| Other races - including multi-racial | 467 (10.6) | 167 (9.3) | 300 (11.4) | 393 (10.8) | 74 (9.3) | ||
| Education levels | < 0.01 | < 0.01 | |||||
| Less than high school | 1081 (24.4) | 357 (20.0) | 724 (27.5) | 789 (21.8) | 292 (36.5) | ||
| High school or above | 3344 (75.6) | 1432 (80.0) | 1912 (72.5) | 2836 (78.2) | 508 (63.5) | ||
| Marriage status | 0.56 | 0.12 | |||||
| Have a partner or be married | 2899 (65.5) | 1181 (66.0) | 1718 (65.2) | 2356 (65.0) | 543 (67.9) | ||
| Single or widowed | 1526 (34.5) | 608 (34.0) | 918 (34.8) | 1269 (35.0) | 257 (32.1) | ||
| Poverty status | < 0.01 | < 0.01 | |||||
| ≤ 1.30 | 1506 (34.0) | 532 (29.7) | 974 (36.9) | 1185 (32.7) | 321 (40.1) | ||
| 1.30 - 3.50 | 626 (14.1) | 243 (13.6) | 383 (14.5) | 489 (13.5) | 137 (17.1) | ||
| > 3.50 | 2293 (51.8) | 1014 (56.7) | 1279 (48.5) | 1951 (53.8) | 342 (42.8) | ||
| Energy intake levels | 0.54 | < 0.01 | |||||
| Inadequate | 1871 (42.3) | 740 (41.4) | 1131 (42.9) | 1464 (40.4) | 407 (50.9) | ||
| Adequate | 1855 (41.9) | 767 (42.9) | 1088 (41.3) | 1573 (43.4) | 282 (35.3) | ||
| Excessive | 699 (15.8) | 282 (16.8) | 417 (15.8) | 588 (16.2) | 111 (13.9) | ||
| Smoking status | < 0.01 | < 0.01 | |||||
| Never | 2422 (54.7) | 1050 (58.7) | 1372 (52.0) | 1980 (54.6) | 442 (55.3) | ||
| Ever | 1175 (26.6) | 459 (25.7) | 716 (27.2) | 916 (25.3) | 259 (32.4) | ||
| Current | 828 (18.7) | 280 (15.7) | 548 (20.8) | 729 (20.1) | 99 (12.4) | ||
| LTPA (min) | 0.04 | < 0.01 | |||||
| 0 | 2295 (51.9) | 887 (49.6) | 1408 (53.4) | 1779 (49.1) | 516 (64.5) | ||
| 0 - 150 | 787 (17.8) | 328 (18.3) | 459 (17.4) | 663 (18.3) | 124 (15.5) | ||
| ≥ 150 | 1343 (30.4) | 574 (32.1) | 769 (29.2) | 1183 (32.6) | 160 (20.0) | ||
| Diabetes | < 0.01 | < 0.01 | |||||
| Yes | 826 (18.7) | 281 (15.7) | 545 (20.7) | 509 (14.0) | 317 (39.6) | ||
| No | 3599 (18.7) | 1508 (84.3) | 2091 (79.3) | 3116 (86.0) | 483 (60.4) | ||
Abbreviations: NAFLD, non-alcoholic fatty liver disease; USFLI, ultrasonographic Fatty Liver Index; NFS, non-alcoholic fatty liver disease fibrosis; FIB-4, Fibrosis-4 Index; APRI, Aspartate Platelet Ratio Index; BMI, Body Mass Index; LTPA, leisure time physical activity.
a Values are expressed as mean ± SD or No. (%).
Eight hundred NAFLD patients had a mean age of 58.9 years, with a somewhat higher percentage of males (58.1%) than females (41.9%). Individuals with NAFLD were more likely to be male, older, obese, current smokers, and diabetics as compared to healthy controls. Their LTPA, household income, and education levels were also lower.
4.2. Relationship of Periodontitis on Liver Conditions in Multivariate Logistic Regression Analysis
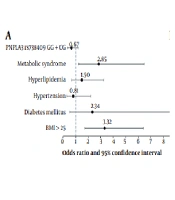
Multivariate logistic regression analysis was employed to investigate the correlation between liver illnesses and periodontal disease. Periodontitis was only statistically significant in Model 1 in AF (OR: 1.48, 95% CI: 1.08 - 2.07), and it was not substantially linked with NAFLD or liver fibrosis in the overall group (P > 0.05; Figure 3 and Appendix 5, in the Supplementary File). Appendix 6, in the Supplementary File, demonstrates a positive trend of correlation between USFLI and the incidence of periodontitis.
The relationship between AF and periodontitis was significant in Model 1 (OR: 1.79, 95% CI: 1.32 - 2.43) when stratified by sex, but not in the other models (P > 0.05, Figure 3).
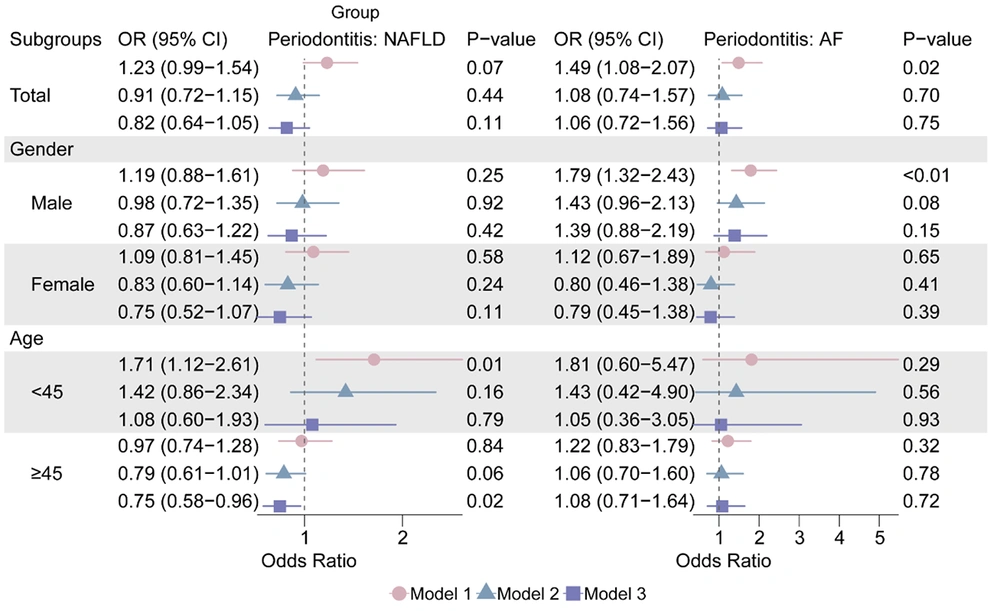
Figure 3.
The effect of periodontitis on liver diseases in National Health and Nutrition Examination Survey (NHANES), (abbreviations: OR, odds ratio; CI, confidence interval)
4.3. Causal Relationship of Periodontitis on Liver Conditions in Mendelian Randomization
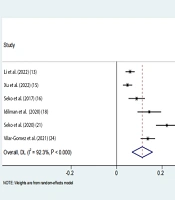
In the MR analysis where periodontitis acted as exposure, 6 SNPs were selected as instrumental variables (detailed information described in Appendix 2, in the Supplementary File). The results indicated an overall non-significant association between genetically predicted periodontitis and an increased risk of NAFLD in the IVW method (OR: 1.12, 95% CI: 0.98 - 1.27). The weighted mean (OR: 1.06, 95% CI: 0.91 - 1.23) and weighted median (OR: 1.07, 95% CI: 0.91 - 1.25) approaches further supported this conclusion. Notably, IVW validation revealed no indication of considerable SNP heterogeneity, and no pleiotropy was observed.
Similarly, in the context of cirrhosis, genetically predicted periodontitis demonstrated an insignificant elevated risk in the IVW analysis (OR: 0.99, 95% CI: 0.82 - 1.19), which was consistent with the findings from the weighted median (OR: 1.02, 95% CI: 0.81 - 1.28) and the weighted mode (OR: 1.02, 95% CI: 0.83 - 1.26) methods. As in the previous analyses, there was no significant SNP heterogeneity based on IVW validation, and no pleiotropic effects were detected (Figure 4).
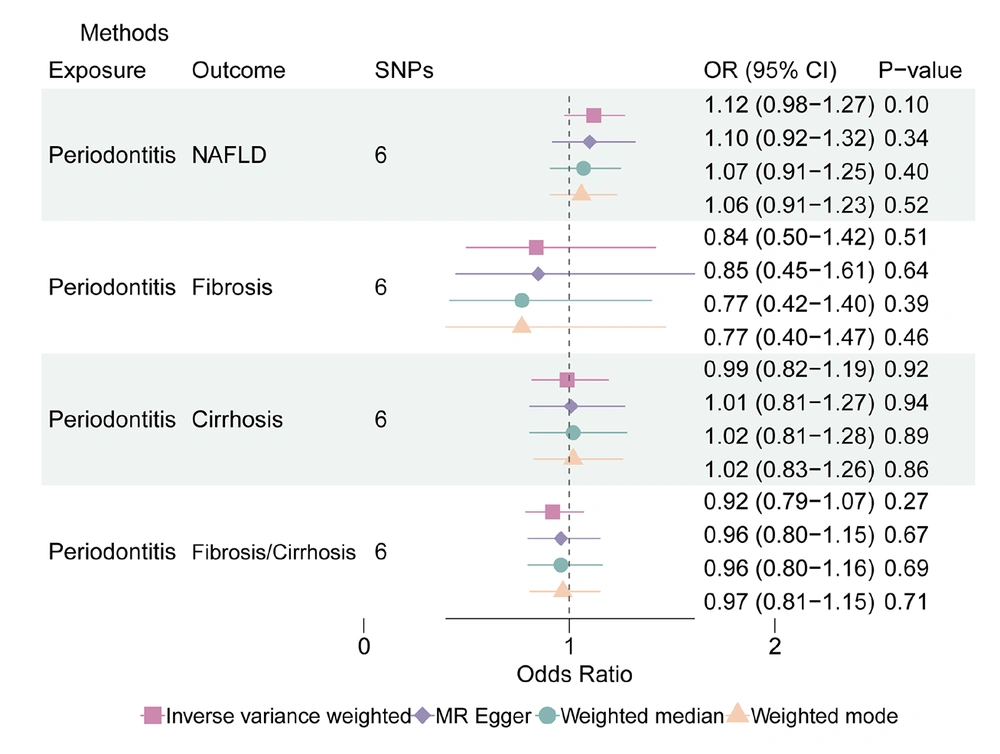
Figure 4.
The effect of periodontitis on liver diseases in Mendelian randomization (MR) analysis
In summary, our MR analyses provide insights into the relationships between periodontitis and various liver diseases, highlighting generally non-significant associations and the absence of significant SNP heterogeneity or pleiotropy in our results. The regional associational plot indicating the lead SNP and nearby genes associated with periodontitis is depicted in Appendix 8, in the Supplementary File.
After conducting a heterogeneity analysis, it was determined that there was no significant potential heterogeneity in the way that periodontitis affected the liver conditions (fibrosis: MR Egger P: 0.88, IVW P: 0.95; cirrhosis: MR Egger P: 0.58, IVW P: 0.71; fibrosis/cirrhosis: MR Egger P: 0.63, IVW P: 0.67). According to Appendices 3 and 4, in the Supplementary File, the Egger intercept (Egger intercept P: NAFLD: 0.85; fibrosis: 0.95; cirrhosis: 0.79; fibrosis/cirrhosis: 0.48) did not demonstrate any horizontal pleiotropy between the impact of periodontitis on liver diseases. Appendix 7, in the Supplementary File displays the findings of the MR sensitivity study as scatter plots, leave-one-out analyses, and funnel plots.
In the reverse MR analysis, no significant causal effects were observed from NAFLD or fibrosis and cirrhosis on periodontitis (IVW OR: 1.014 and 1.007, P: 0.77 and 0.69), indicating that liver diseases do not cause periodontitis.
5. Discussion
This is the first study, to our knowledge, that combines genetic MR in European countries with cross-sectional US samples to investigate bidirectional connections between periodontitis and NAFLD-associated illnesses. The analysis indicates that there is no significant correlation between periodontal disease and NAFLD or liver fibrosis, and the MR analysis does not support a causal relationship between them. The sensitivity analysis further confirms our conclusions.
These findings, however, must be interpreted in the context of conflicting existing literature. While previous research has hinted at a certain link between periodontitis and NAFLD, the exact cause-and-effect relationship remains unclear (23). According to research by Saito et al. (as cited by Kuraji et al.), individuals with periodontitis had considerably higher levels of AST than those without the condition, indicating a clear correlation between periodontitis and liver damage (24). Nutritional status, such as vitamins, has been consistently linked to NAFLD (25). According to a cross-sectional study in a representative sample of Koreans, the existence of periodontal pockets may be substantially correlated with NAFLD markers (26). Recent experimental evidence suggests that interventions targeting oral and gut dysbiosis, such as the use of Nisin lantibiotic, may mitigate NAFLD progression following periodontal disease, highlighting the complexity of the oral-gut-liver axis (27). Nevertheless, Xu and Tang's meta-analysis revealed that the available data do not support a causal relationship between periodontitis and NAFLD (28). In light of the meta-analysis's conclusions, we applied the latest MR periodontitis genetic data to similarly obtain consistent conclusions. The recent MR study suggested that NAFLD moderately increases the chances of periodontitis by Tan et al. However, we believe that both the exposure and outcome samples were derived from the FinnGen database, which goes against the premise of a two-sample MR study and makes the conclusions unreliable (29, 30).
Most of the pathologic associations between periodontitis and human NAFLD have been provided by observational epidemiologic studies, and causality has not been established. Smoking and poor diet, among others, are all common etiologic factors for periodontitis and NAFLD (31, 32), and when participants had these risk factors, periodontitis and NAFLD often co-occurred and therefore showed statistically significant associations, which no longer existed in our model after adjusting for these important confounders. The disappearance of the association after multivariate adjustment is likely due to confounding by shared risk factors. Obesity, exercise, and diet play an important role in driving NAFLD, which have been robustly observed in former studies (33, 34). After controlling for these confounders, the link was attenuated, suggesting the initial observational association was not causal — a conclusion supported by our null MR findings.
Notwithstanding the lack of a causal link in our study, several plausible biological mechanisms have been proposed to explain the observed epidemiological associations. Currently, some studies have suggested that oral diffusion of certain pathogenic factors such as bacteria and inflammatory factors in patients with periodontitis affects the liver through the oral-intestinal-hepatic axis or blood-borne pathways (35-37). Additionally, periodontitis is closely associated with insulin resistance or metabolic syndrome, which may also promote the development of NAFLD. It is undeniable that periodontitis affects the development of systemic diseases, and MR studies have only inferred causality, ignoring the biological mechanisms between them. Therefore, future studies on the mechanisms of periodontitis diagnosis and treatment on NAFLD-related diseases need to be further explored.
This study possesses several strengths: (1) This represents the first-ever combination of bidirectional MR analysis with NHANES data to investigate the possible causative relationship between chronic liver illnesses and periodontitis. Meanwhile, our NHANES data results were consistent with MR results. (2) The data we utilized originated from NHANES 2009 - 2014, representing a substantial dataset. Furthermore, we leveraged data from the Finnish database for MR analysis, which offers comprehensive insights into periodontitis, NAFLD, liver fibrosis, and cirrhosis. (3) Our study stands out by introducing three distinct indicators for assessing liver fibrosis, enhancing the reliability and persuasiveness of our findings in comparison to prior research.
Despite these strengths, our study has some limitations: (1) We refrained from further subclassifying periodontitis, even though previous research has linked moderate to severe periodontitis with chronic liver diseases. This lack of granularity might have obscured potential associations specific to severe forms of periodontitis. (2) Our approach employed three indicators to gauge liver fibrosis, which may exhibit limitations regarding specificity and sensitivity compared to the gold standard of liver biopsy. (3) The NHANES data represent the circumstances of Americans, while the MR data were obtained from the European population. This disparity between observational and genetic data could introduce bias into the results, as population-specific factors (e.g., genetic background, lifestyle, environmental exposures) might influence the associations differently, necessitating further enhancements and refinements.
5.1. Conclusions
To sum up, observational study of NHANES data suggests that there is no significant correlation between periodontal disease and the risk of NAFLD and liver diseases. Furthermore, there is no discernible causal relationship between the incidence of NAFLD or liver fibrosis/cirrhosis and periodontal disease, according to the MR study. Therefore, this study shows no causal relationship between periodontal disease and NAFLD. More research must be conducted to explore potential associations, but general health measures, including maintaining good oral hygiene, are recommended nonetheless. Consequently, further standardized cohort studies in a more diverse population are warranted to gain a deeper insight into the interrelationship between oral health and liver function, as well as the mechanisms underlying it.