1. Background
Despite its high prevalence and mortality, the development of therapeutic strategies for hepatocellular carcinoma (HCC) remains a major challenge in cancer research (1, 2). Globally, HCC ranks sixth in incidence and third in cancer-related mortality (3). The prognosis of patients with HCC remains unsatisfactory because of recurrence and metastasis, despite advances in multimodal treatment (4). In advanced or unresectable HCC, conventional chemotherapeutic agents have major limitations, including marked drug resistance, poor specificity, and substantial systemic toxicity (5). Therefore, screening natural products for highly effective and minimally toxic anticancer compounds and elucidating their molecular mechanisms have become critical directions for the development of novel anti-HCC therapeutics.
Bioactive constituents derived from traditional Chinese medicine have received extensive attention because of their multi-target and low-toxicity properties (6). Licorice (Glycyrrhiza glabra L.) contains diverse bioactive compounds, including triterpenoid saponins and flavonoids, and its antitumor effects and underlying mechanisms have become an active focus of research (7). As a chalcone flavonoid from licorice root, Licochalcone A (LCA) has multiple pharmacological effects, including anti-inflammatory, antioxidant, and anticancer activities (8). In diverse cancer cell lines, including lung, liver, and colon cancer cells, LCA exhibits potent cytotoxic and antimetastatic effects by inhibiting proliferation, inducing apoptosis, arresting the cell cycle, and suppressing invasion and metastasis (9). In HCC studies, LCA exerts antitumor effects by promoting reactive oxygen species (ROS) accumulation and lipid peroxidation, leading to ferroptosis (10). Physiological ROS levels serve as essential signaling molecules that regulate cellular proliferation and differentiation (11); however, excessive ROS accumulation induces oxidative stress, causes macromolecular damage, and subsequently triggers programmed cell death, including apoptosis (12). Numerous natural antitumor compounds selectively eliminate cancer cells by disrupting intrinsic redox homeostasis and inducing excessive ROS generation (13). Therefore, an in-depth investigation of the mechanisms underlying LCA-induced, ROS-regulated HCC cell death is important for elucidating the molecular basis of its antitumor activity.
Studies have shown that p38 mitogen-activated protein kinase (p38 MAPK) and c-Jun N-terminal kinase (JNK), both of which belong to the stress-activated MAPK subfamily, are regulated by ROS (14). Chien et al. demonstrated that LCA regulates endoplasmic reticulum stress-induced apoptosis in uterine leiomyoma cells through the ROS-regulated JNK/GRP78/NRF2 signaling pathway, thereby exerting anti-leiomyoma effects (15). Licochalcone B, another structurally similar chalcone-type flavonoid from licorice, inhibits colorectal cancer cell viability and proliferation, promotes apoptosis, and induces mitochondrial membrane potential (MMP) dysfunction through the ROS-regulated JNK/p38 MAPK signaling pathway, demonstrating potential anti-colorectal cancer activity (16). Mitochondria serve not only as the cellular powerhouse but also as a central hub for the integration and execution of apoptotic signals (17). Notably, both ROS and p38/JNK activation can positively regulate this pathway: ROS can directly damage mitochondrial membranes (18), whereas activated p38/JNK can promote mitochondrial membrane permeabilization through phosphorylation of Bcl-2 family members (19).
2. Objectives
This study aimed to investigate the effects of LCA on apoptosis in human HCC cells and to elucidate its molecular mechanisms, with a focus on the dependence of LCA-induced apoptosis on the mitochondrial pathway, its effects on MMP, and the regulatory role of the upstream ROS/p38/JNK pathway. The findings may provide experimental evidence and potential targets to support developing LCA as an oxidative damage-based anti-HCC drug candidate or adjuvant therapeutic agent.
3. Methods
3.1. Cell Culture
Human HCC cell lines HepG2 (TCHu 72) and HuH-7 (SCSP-526) and the normal human liver cell line THLE-2 (SCSP-5068) were obtained from the Cell Bank of the Type Culture Collection of the Chinese Academy of Sciences (Shanghai, China). Human HCC cell lines SNU475 (CRL-2236) and SNU449 (CRL-2234) were purchased from ATCC (Manassas, VA, USA). HepG2, HuH-7, SNU475, and SNU449 cells were maintained in DMEM (11965092, Gibco) supplemented with 10% fetal bovine serum (FBS; A5256701, Gibco, Grand Island, NY, USA) and 1% penicillin-streptomycin (15140148, Gibco). THLE-2 cells were cultured in specialized THLE-2 complete medium (SCSP-M5068). All cells were subcultured in a humidified incubator at 37°C with 5% CO2. Licochalcone A (purity ≥ 96%, 68783) was purchased from Sigma (St. Louis, MO, USA) and dissolved in DMSO (abs9187, Absin, Shanghai, China) to prepare stock solutions. The final DMSO concentration in all experiments did not exceed 0.1%.
3.2. Cell Viability Assay
Log-phase cells were seeded in 96-well plates at 5 × 10³ cells/well and cultured overnight. After treatment with fresh medium containing serial concentrations of LCA (0, 5, 10, 20, 40, and 80 μM) for 24 or 48 hours, CCK-8 reagent (CK04, Dojindo, Kumamoto, Japan) was added to each well. After incubation for 2 hours at 37°C, absorbance was measured at 450 nm.
3.3. Experimental Design
Based on the CCK-8 assay results, two LCA-sensitive HCC cell lines, HepG2 and HuH-7, were selected for subsequent investigations, and the optimal drug concentration and incubation time were determined. In parallel, it was confirmed that this concentration exerted no significant cytotoxicity toward normal liver cells. The experimental design comprised the following groups to systematically elucidate the antitumor efficacy and mechanistic basis of LCA.
First, a control group and LCA treatment groups at different concentrations (10, 20, and 40 μM) were established to evaluate the ability of LCA to inhibit malignant progression in HCC cells. Second, inhibitor validation groups were established, including the SP600125 group (SP, a JNK inhibitor; purity > 99%, HY-12041, MCE, Monmouth Junction, NJ, USA) and the SB203580 group (SB, a p38 inhibitor; purity > 99%, HY-10256, MCE). Cells were pretreated with 4 μM SP or 8 μM SB for 3 hours, after which protein phosphorylation was analyzed by Western blotting to verify inhibitor potency.
To determine the regulatory link between the p38/JNK pathway and LCA-induced apoptosis, a control group, a 40 μM LCA treatment group, and a combined inhibitor pretreatment group (LCA + SP + SB) were established. For combined treatment, cells were pretreated with inhibitors (4 μM SP + 8 μM SB) for 1 hour and then co-cultured with 40 μM LCA for 48 hours. Pathway involvement was assessed by comparing MMP and apoptosis-related protein expression across groups.
Additionally, to clarify the upstream mechanism of LCA action, ROS-dependence validation experiments were designed. A control group, a 40 μM LCA treatment group, and an N-acetylcysteine (NAC; HY-B0215, MCE) pretreatment group were established. To validate the role of ROS in the antitumor effects of LCA, cells were first treated with 4 mM NAC for 3 hours to scavenge ROS and then co-incubated with 40 μM LCA for 48 hours to assess the effects on the activation of downstream apoptotic signaling pathways.
3.4. Cytotoxicity Assessment and Viability Testing
Cells were seeded in 24-well plates and treated as described in Section 3.3. Cell supernatants were collected, and lactate dehydrogenase (LDH) cytotoxicity assays were performed using the LDH Cytotoxicity Detection Kit (MA0649, Meilunbio, Dalian, China) according to the manufacturer's instructions. Absorbance was measured at 490 nm using a microplate reader to calculate LDH release rates and assess the extent of cell membrane damage.
Cell viability was assessed using the Calcein-AM/PI Dual-Coloration Kit (MA0361, Meilunbio). After treatment, the medium was removed, and cells were washed twice with PBS. A staining working solution containing 2 μM Calcein-AM and 4 μM PI was added, followed by incubation at 37°C in the dark for 15 minutes. Cells were observed and photographed using a fluorescence microscope (IX73, Olympus, Tokyo, Japan). Calcein-AM stained viable cells with green fluorescence, whereas PI stained dead cells with red fluorescence.
3.5. Colony Formation Assay
Cells were seeded at 500 cells/well in 6-well plates and cultured overnight. The following day, after 48 hours of treatment with different concentrations of LCA (0, 10, 20, and 40 μM), the medium was replaced with fresh LCA-free medium. Cultures were then maintained for 10 - 14 days until visible colonies formed in the control group. The medium was discarded, and cells were washed with PBS, fixed with methanol (67 - 56 - 1, Aladdin, Shanghai, China) for 15 minutes, and stained with 0.1% crystal violet solution (V5265, Sigma) for 30 minutes. Colonies were observed under a microscope and counted.
3.6. Transwell Assay
Transwell chambers (8.0 μm pore size; Corning, NY, USA) were placed in 24-well plates. Cells treated with LCA for 48 hours were seeded at a density of 5 × 10⁴ cells/well in the upper chamber in serum-free medium. Medium containing 10% FBS was added to the lower compartment as the chemoattractant. After incubation for 24 hours, the chamber was removed, and nonmigrated cells on the upper surface were wiped away with a cotton swab. Cells were fixed with methanol for 15 minutes and stained with 0.1% crystal violet (C0121, Beyotime, Shanghai, China) for 30 minutes. Five fields of view were randomly selected under a microscope for imaging and counting. The invasion assay was performed similarly, except that the upper membrane was precoated with Matrigel (C0372, Beyotime) and incubated for 30 minutes to allow solidification.
3.7. Cell Apoptosis
Apoptosis was evaluated using Annexin V-APC/PI dual staining (BL107A, Biosharp, Hefei, China). Briefly, cells treated as described in Section 3.3 were washed and resuspended in binding buffer according to the manufacturer's protocol, stained with Annexin V-APC and PI, incubated for 15 minutes at room temperature in the dark, and analyzed by flow cytometry (FACSCalibur, BD Biosciences, San Jose, CA, USA). Data were processed using FlowJo software.
3.8. ROS Detection
After treatment as described in Section 3.3, the culture medium was discarded, and cells were incubated in serum-free medium containing DCFH-DA (10 μM, 37°C, 30 minutes; D6883, Sigma). After incubation, cells were washed three times with PBS to remove extracellular probes. Fluorescence images were captured using a fluorescence microscope. Cells were then trypsinized and collected for flow cytometric analysis to quantify intracellular ROS levels by measuring mean fluorescence intensity.
3.9. Biochemical Assays
After cells were processed in groups as described in Section 3.3, they were washed with PBS and lysed on ice using an appropriate lysis buffer. The supernatant obtained after centrifugation was collected as the cell lysate for subsequent biochemical assays. Levels of superoxide dismutase (SOD; BC5165), glutathione (GSH; BC1175), malondialdehyde (MDA; BC6415), and adenosine triphosphate (ATP; BC0300) were determined based on absorbance measured at 450, 412, 532, and 340 nm, respectively, according to the manufacturer's instructions. All assay kits were purchased from Solarbio (Beijing, China).
3.10. Janus Green Staining for Mitochondrial Activity
After treatment as described in Section 3.3, cells seeded on coverslips were washed with PBS, incubated with Janus Green B solution (37°C, 20 minutes; abs47002003, Absin), washed again with PBS, and observed under a microscope. Active mitochondria in living cells exhibited blue-green staining, whereas reduced mitochondrial activity was indicated by diminished or absent staining.
3.11. MMP Detection
After treatment as described in Section 3.3, the medium was removed, and cells were incubated with the JC-1 fluorescent probe (5 μg/mL; T3168, Invitrogen, Carlsbad, CA, USA) for 20 minutes. Cells were then washed twice with incubation buffer and analyzed by fluorescence microscopy or flow cytometry. Changes in MMP were evaluated according to the ratio of green to red fluorescence intensity.
3.12. Calcium Ion (Ca2+) Concentration Detection
After treatment, cells were incubated with the Fluo-3 AM fluorescent probe (3 μM; S1056, Beyotime) supplemented with 0.05% Pluronic F-127 (ST501, Beyotime) for 45 minutes. Green fluorescence intensity was detected using fluorescence microscopy, and fluorescence intensity was positively correlated with intracellular free Ca2+ concentration.
3.13. Western Blotting
To determine total protein expression, HCC cells were harvested and lysed on ice for 30 minutes using RIPA lysis buffer supplemented with protease and phosphatase inhibitor cocktails (G2002, Servicebio, Wuhan, China). To detect cytochrome c release, cytosolic and mitochondrial fractions were isolated using a digitonin-based fractionation method, as previously described. Briefly, cells were permeabilized with 0.1% digitonin (HY-N4000, MCE) for 5 minutes, and the cytosolic fraction was separated from the organelle-containing pellet by differential centrifugation (13,000 rpm, 4°C). Protein concentration was determined using a BCA protein quantification kit (G2026, Servicebio). Equal amounts of protein (20 - 40 μg) were separated by SDS-PAGE and transferred onto PVDF membranes. Membranes were blocked with 5% BSA (GC305010, Servicebio) for 1 hour and incubated with primary antibodies at a 1:1000 dilution at 4°C overnight. Primary antibodies included cytochrome c (#4272), COX IV (#4844), p-p38 (#9211), p38 (#9212), p-JNK (#4668), JNK (#9252), Bax (#2772), Bcl-2 (#3498), Bcl-XL (#2764), cleaved caspase-3 (#9661), caspase-3 (#9662), and GAPDH (#2118), all purchased from CST (Danvers, MA, USA). The next day, membranes were washed three times with TBST and incubated with an HRP-conjugated secondary antibody (1:2000, #7074, CST) for 1 hour. Protein bands were visualized using an ECL chemiluminescence kit (#6883, CST). All Western blot experiments were independently replicated six times. ImageJ software (version 1.53c, NIH, Bethesda, MD, USA) was used to quantitatively analyze band gray values. Relative protein expression in each sample was calculated as the ratio of the target protein gray value to that of the reference protein GAPDH. The relative expression level of the control group was normalized to 1.
3.14. Statistical Analysis
Experimental data were expressed as the mean ± standard deviation. Statistical analyses were performed using GraphPad Prism 9.0 software. Comparisons between two groups were conducted using Student's t-test, whereas comparisons among multiple groups were performed using analysis of variance followed by Bonferroni post hoc multiple comparison tests. P < 0.05 was considered statistically significant.
4. Results
4.1. Licochalcone A Induces Cytotoxicity in HCC Cells
This study first systematically evaluated the effects of various concentrations of LCA on cell viability. The results showed that LCA treatment for 24 and 48 hours inhibited the viability of HCC cells, including HepG2, HuH-7, SNU475, and SNU449 cells (Figure 1A-D). However, LCA at concentrations of 10, 20, and 40 μM for 48 hours had no effect on THLE-2 cells (Figure 1E). In addition, treatment with 40 μM LCA for 48 hours reduced cell viability to approximately 50%. Based on these findings, subsequent experiments used HepG2 and HuH-7 cells, with LCA concentrations of 10, 20, and 40 μM and a treatment duration of 48 hours.
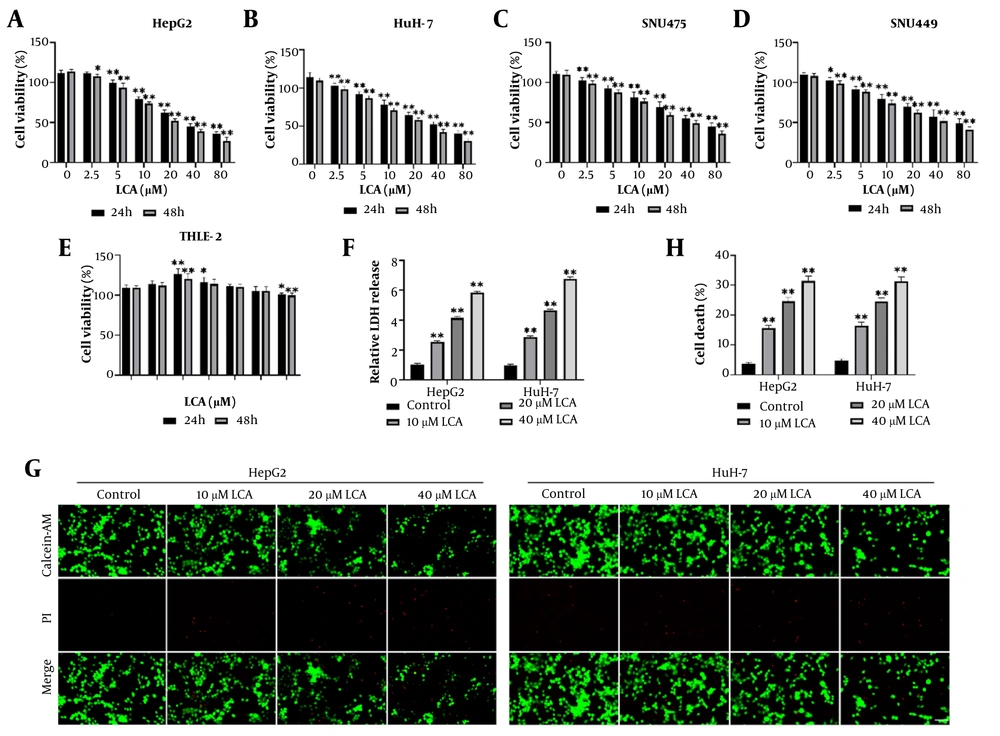
Figure 1.
Licochalcone A (LCA) induces viability impairment in HCC cells. A-E, CCK-8 assay detection of the effects of various concentrations of LCA (0, 2.5, 5, 10, 20, 40, and 80 μM) on the viability of four HCC cell lines (HepG2, HuH-7, SNU475, and SNU449) and the normal human hepatocyte line THLE-2 after 24 and 48 hours of treatment. Based on these results, subsequent experiments selected HepG2 and HuH-7 cells as the study subjects. F, LDH release assay detecting the effect of 48-hour LCA treatment (10, 20, and 40 μM) on membrane damage in HCC cells. G-H, Viability assessment of HCC cells after 48-hour exposure to different concentrations of LCA (10, 20, and 40 μM) using Calcein-AM/PI dual staining. Live and dead cells are indicated by green and red fluorescence, respectively. n = 6. * P < 0.05, ** P < 0.01 vs control.
To comprehensively evaluate LCA-induced damage in HCC cells, LDH release was measured in HCC cells treated with different concentrations of LCA. The results showed that LDH release was significantly increased in the LCA-treated groups compared with that in the control group (Figure 1F), indicating increased cell membrane damage. Morphological observation using Calcein-AM/PI dual staining revealed an inverse correlation between live cell number and LCA concentration, with a corresponding increase in dead cells (Figure 1G-H), visually confirming the death-inducing effect of LCA on HCC cells.
4.2. Licochalcone A Inhibits Proliferation, Migration, and Invasion While Promoting Apoptosis in HCC Cells
To further investigate the effects of LCA on the malignant phenotype of HCC cells, this study first assessed the effect of LCA on long-term proliferative capacity using colony formation assays. The results showed that the number of colonies in the LCA-treated groups decreased significantly with increasing concentration (Figure 2A-B). Transwell assays were used to examine the effects of LCA on cell migration and invasion. In migration assays, the number of cells traversing the Transwell chamber decreased markedly with increasing LCA concentration (Figure 2C-D). Similarly, invasion assays showed that LCA inhibited invasive capacity (Figure 2E-F). Flow cytometric analysis of apoptosis revealed that apoptotic rates in HCC cells increased significantly after LCA treatment (Figure 2G-H). Overall, LCA dose-dependently inhibited malignant phenotypes and promoted apoptosis in HCC cells.
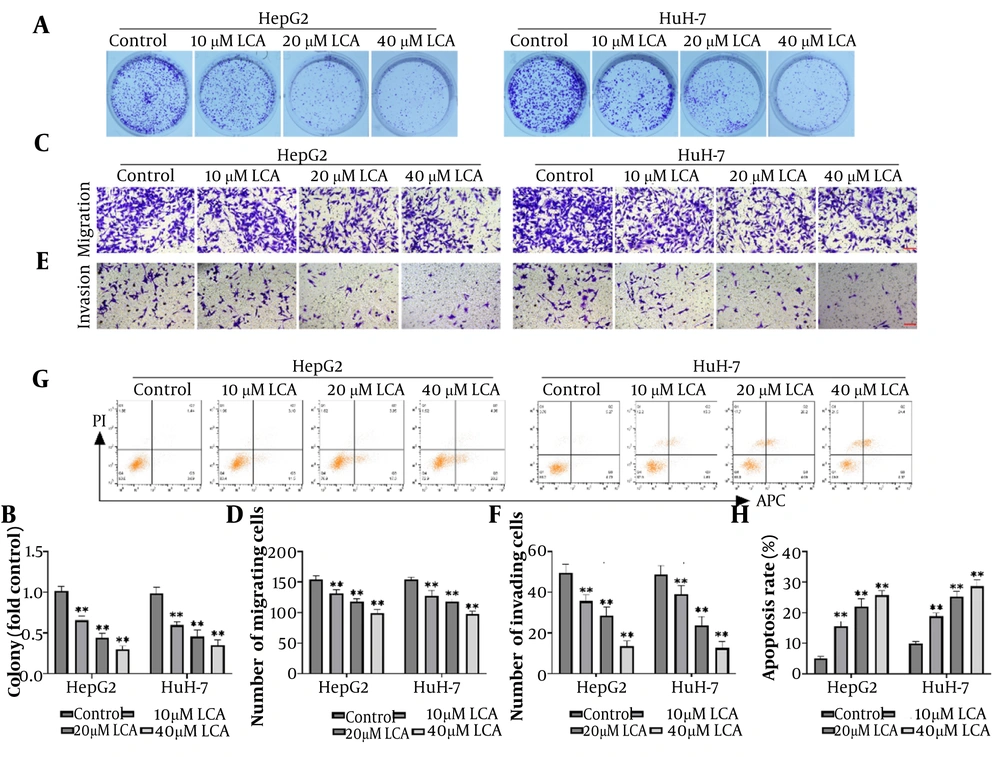
Figure 2.
Licochalcone A (LCA) inhibits the growth, migration, and invasion of HCC cells while promoting apoptosis. A-B, Clonogenic assays were performed to determine the effect of LCA on the proliferative capacity of HCC cells. C-D, Transwell migration assays were conducted to evaluate the effect of LCA on the migratory ability of HCC cells. Scale bar: 100 μm. E-F, Transwell invasion assays assessed the effects of LCA treatment on HCC cell invasion capacity. Scale bar: 100 μm. G-H, Flow cytometry measured apoptosis rates in HCC cells 48 hours after LCA treatment. n = 6. ** P < 0.01 vs control.
4.3. Licochalcone A Induces Aberrant ROS Accumulation and Mitochondrial Damage in HCC Cells
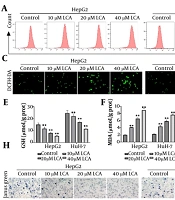
Given the observed anti-HCC effects, we next explored the effects of LCA on cellular redox balance and mitochondrial integrity. Flow cytometry combined with DCFH-DA fluorescent probe detection revealed significantly enhanced ROS fluorescence intensity in LCA-treated HCC cells, indicating that LCA induced substantial intracellular ROS accumulation (Figure 3A-D). Subsequently, oxidative stress-related parameters were assessed. Consistent with elevated ROS levels, LCA treatment significantly reduced intracellular GSH content and SOD activity while increasing MDA levels (Figure 3E-G).
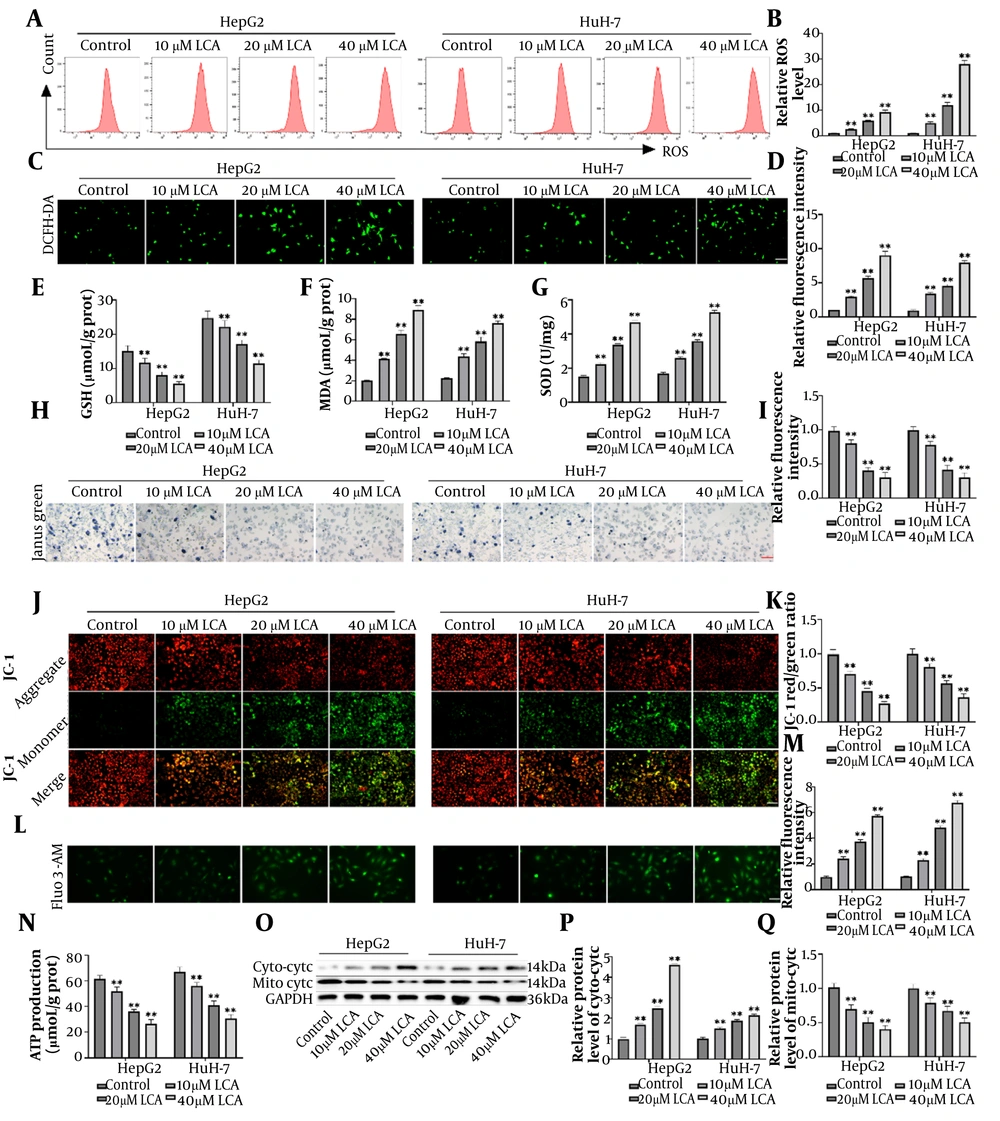
Figure 3.
Licochalcone A (LCA) induces abnormal ROS levels and mitochondrial damage in HCC cells. A-B, Flow cytometric analysis of LCA-induced ROS levels in HCC cells. C-D, DCFH-DA fluorescence probe staining showing intracellular ROS distribution after LCA treatment. Scale bar: 50 μm. E-G, Assessment of oxidative stress levels using assay kits to measure intracellular GSH content, MDA content, and SOD activity after LCA treatment. H-I, Changes in mitochondrial number and activity after LCA treatment detected by Janus Green B staining. Scale bar: 100 μm. J-K, JC-1 fluorescence staining for detecting MMP changes after LCA treatment; a decreased red/green fluorescence ratio indicates reduced membrane potential. Scale bar: 100 μm. L-M, Fluo-3 AM fluorescence staining for detecting changes in intracellular Ca2+ concentration after LCA treatment. Scale bar: 50 μm. N, Kit-based assay for intracellular ATP production after LCA treatment, reflecting cellular energy metabolism. O-Q, Western blot analysis of cytochrome c distribution in the cytosolic cytochrome c and mitochondrial cytochrome c compartments after LCA treatment; increased mitochondrial membrane permeability elevates cytosolic cytochrome c levels. n = 6. ** P < 0.01 vs control.
Mitochondria are the primary site of ROS production and are a critical target of oxidative stress-induced damage (20). Janus Green B staining revealed that LCA treatment reduced mitochondrial number and staining intensity (Figure 3H-I). JC-1 staining further demonstrated that LCA decreased MMP (Figure 3J-K). Mitochondrial dysfunction is often accompanied by disruption of intracellular calcium homeostasis (21). Fluo-3 AM staining showed that LCA treatment significantly elevated intracellular calcium ion concentrations in HCC cells (Figure 3L-M). Licochalcone A treatment also suppressed intracellular ATP production (Figure 3N). Increased mitochondrial membrane permeability can trigger cytochrome c release into the cytoplasm (22). Western blot analysis confirmed that, after LCA treatment, mitochondrial cytochrome c protein levels decreased, whereas cytoplasmic cytochrome c protein levels increased correspondingly (Figure 3O-Q). These findings suggest that LCA induces oxidative stress and mitochondrial damage in HCC cells.
4.4. Licochalcone A Promotes Activation of the p38/JNK/MAPK Signaling Pathway in HCC Cells
Based on the previous experimental results, 40 μM LCA markedly induced HCC cell injury. Therefore, 40 μM LCA was selected for mechanistic experiments to further investigate the molecular mechanisms of LCA in HCC cells. Western blot analysis revealed that LCA treatment significantly increased p-p38 and p-JNK protein levels in both HepG2 and HuH-7 cells, whereas total p38 and JNK protein expression remained unchanged (Figure 4A-C). These results indicate that LCA activates the p38 and JNK signaling pathways.
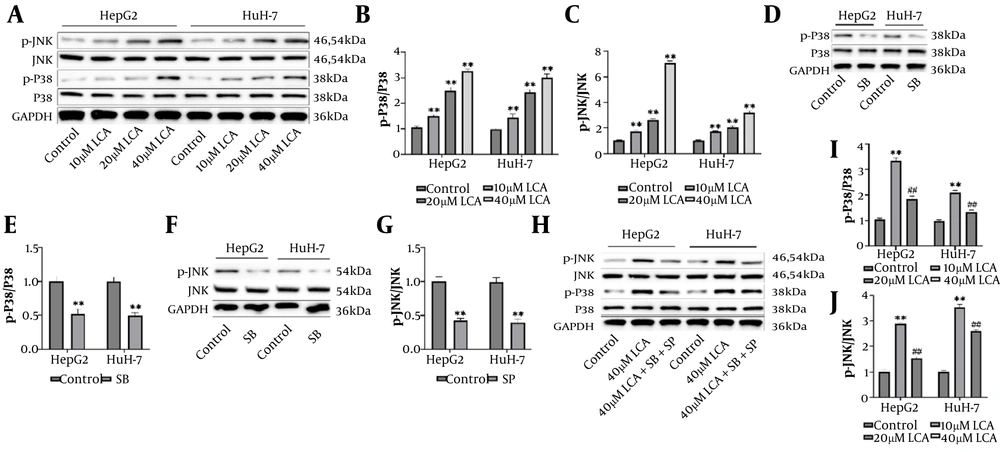
Figure 4.
Licochalcone A (LCA) promotes activation of the p38/JNK/MAPK signaling pathway in HCC cells. A-C, Western blot analysis of key proteins in the p38/JNK/MAPK pathway after LCA treatment (10, 20, and 40 μM; 48 hours). D-E, Western blot validation of the inhibitory effect of the p38-specific inhibitor SB (8 μM; 3 hours). F-G, Western blot validation of the inhibitory effect of the JNK-specific inhibitor SP (4 μM; 3 hours). H-J, Western blot analysis of the effects of LCA treatment on p-p38, p38, p-JNK, and JNK protein expression under the combined action of the p38 inhibitor SB and the JNK inhibitor SP. The combined treatment group was first preincubated with inhibitors (4 μM SP + 8 μM SB) for 1 hour, followed by the addition of 40 μM LCA for a total incubation period of 48 hours. n = 6. ** P < 0.01 vs control; ## P < 0.01 vs 40 μM LCA.
Subsequently, to verify the necessity of these pathways in LCA-induced cell injury, inhibitor pretreatment experiments were conducted. Treatment with the p38-specific inhibitor SB significantly downregulated p38 phosphorylation levels (Figure 4D-E). Similarly, the JNK-specific inhibitor SP significantly suppressed the elevation of JNK phosphorylation levels (Figure 4F-G). Compared with 40 μM LCA treatment alone, combined treatment with LCA + SB + SP reduced p-p38 and p-JNK protein levels (Figure 4H-J). These results suggest that LCA may induce HCC cell injury through activation of the p38 and JNK pathways.
4.5. Licochalcone A Activates the p38/JNK/MAPK Signaling Pathway by Promoting ROS Generation
To verify whether ROS serves as an upstream signal for LCA-mediated activation of the p38/JNK/MAPK pathway, cells were pretreated with the ROS scavenger NAC. Flow cytometry combined with DCFH-DA fluorescent probe detection showed that 40 μM LCA treatment significantly elevated intracellular ROS levels in HCC cells (Figure 5A-D). However, co-treatment with NAC markedly and partially attenuated LCA-induced ROS elevation, indicating that NAC effectively inhibits LCA-induced ROS generation. Based on these findings, the effects of ROS scavenging on downstream activation of the p38/JNK/MAPK signaling pathway were further examined. Western blot results showed that, compared with 40 μM LCA treatment alone, the LCA + NAC co-treatment group exhibited significantly decreased p-p38 and p-JNK protein levels (Figure 5E-G). These results indicate that ROS scavenging inhibits LCA-mediated activation of the p38 and JNK pathways, suggesting that excessive ROS induced by LCA may trigger activation of the p38 and JNK signaling pathways.
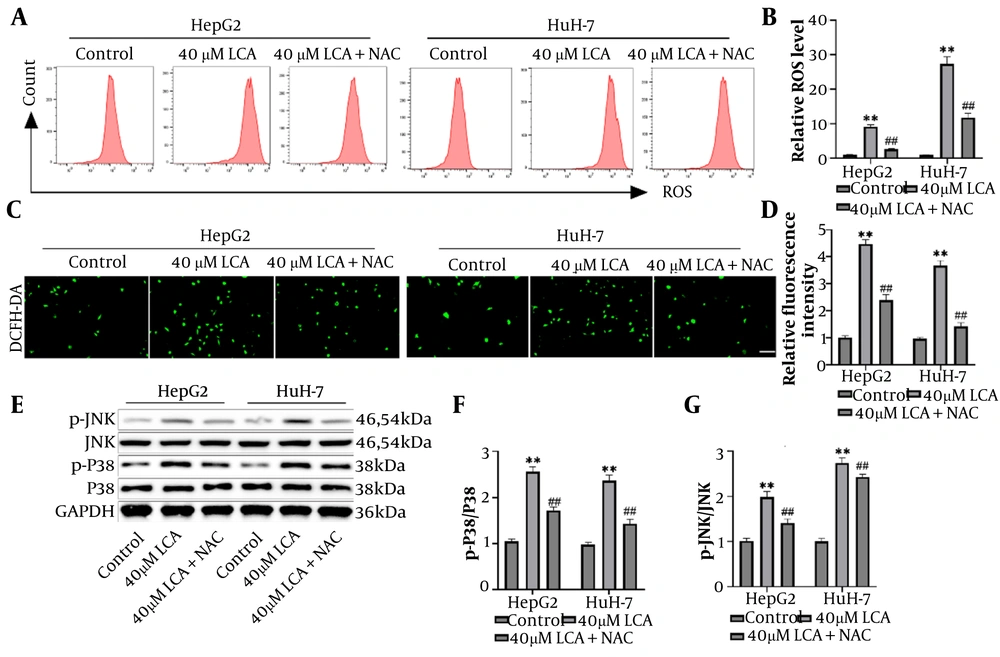
Figure 5.
Licochalcone A (LCA) activates the p38/JNK/MAPK signaling pathway by promoting ROS generation. A-B, Flow cytometric analysis of intracellular ROS levels in each group. The groups comprised control, 40 μM LCA-treated, and LCA co-treated with the ROS inhibitor NAC. C-D, DCFH-DA fluorescent probe staining for intracellular ROS distribution. Scale bar: 50 μm. E-G, Western blot analysis of p-p38, p38, p-JNK, and JNK expression levels to validate ROS involvement in LCA-mediated p38/JNK/MAPK pathway activation. n = 6. ** P < 0.01 vs control; ## P < 0.01 vs 40 μM LCA.
4.6. Licochalcone A-Induced Mitochondria-Dependent Apoptosis in HCC Cells Is Associated with p38/JNK/MAPK Signaling Pathway Activation
To validate the involvement of the mitochondrial pathway in LCA-induced apoptosis, the expression of key apoptotic regulatory proteins was examined. The results showed that LCA promoted Bax expression and inhibited Bcl-2 and Bcl-XL expression (Figure 6A-C), corroborating its role in inducing apoptosis through the mitochondrial pathway. Concomitant with the altered Bcl-2 family protein ratio, LCA treatment significantly elevated cleaved caspase-3 levels, whereas procaspase-3 protein expression showed no significant change (Figure 6D-E). These findings indicate that LCA activates the mitochondria-mediated intrinsic apoptotic pathway.
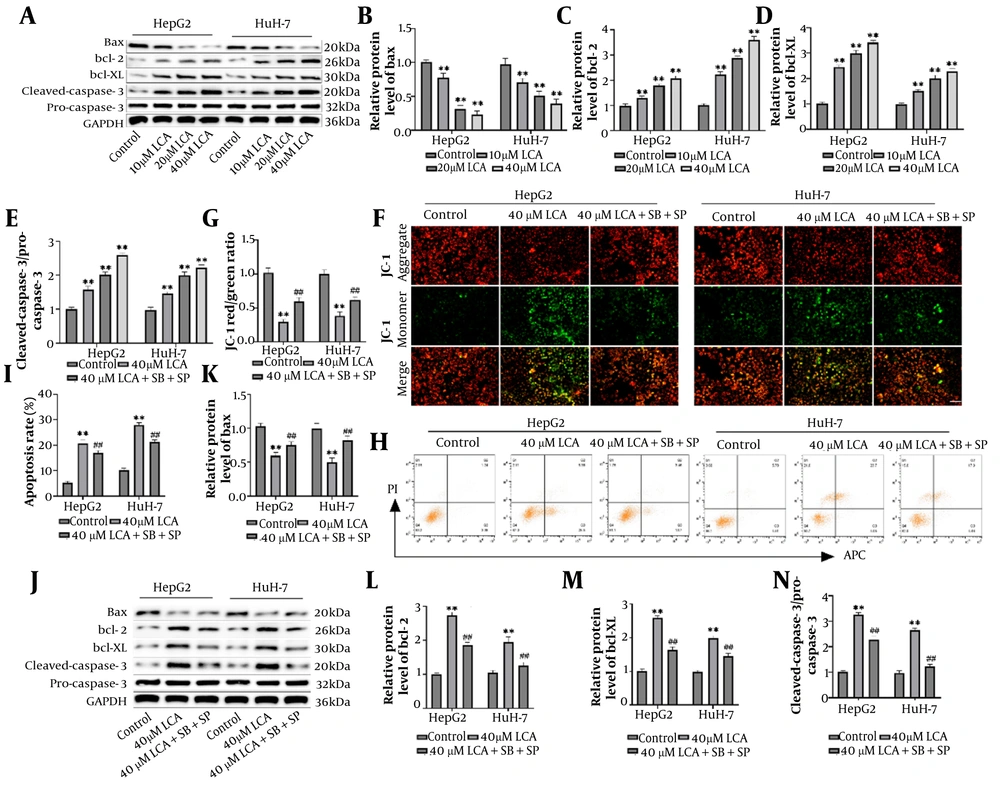
Figure 6.
Licochalcone A (LCA)-induced mitochondria-dependent apoptosis in HCC cells correlates with p38/JNK/MAPK signaling pathway activation. A-E, Western blot analysis of apoptosis-related protein expression levels in HCC cells after LCA treatment (10, 20, and 40 μM; 48 hours). F-G, JC-1 fluorescence staining assessed the effect of 40 μM LCA treatment (48 hours) on MMP in HCC cells in the presence of the p38 inhibitor SB and JNK inhibitor SP. Scale bar: 100 μm. H-I, Flow cytometric analysis of changes in apoptosis rates induced by 40 μM LCA treatment (48 hours) under combined SB and SP inhibitor action. J-N, Western blot analysis of the effects of 40 μM LCA treatment (48 hours) on apoptosis-related protein expression under combined SB and SP inhibition. n = 6. ** P < 0.01 vs control; ## P < 0.01 vs 40 μM LCA.
To clarify the critical role of the p38/JNK pathway in this process, intervention experiments were performed using SB and SP. JC-1 staining revealed that combined inhibitor treatment significantly and partially attenuated the LCA-induced decline in MMP compared with 40 μM LCA treatment alone (Figure 6F-G). Correspondingly, flow cytometric analysis demonstrated that inhibition of the p38/JNK pathway markedly reduced LCA-induced apoptosis rates (Figure 6H-I). At the molecular level, Western blot results further confirmed that co-treatment with p38/JNK inhibitors effectively antagonized the regulatory effects of LCA on apoptosis-related proteins: Bax upregulation was suppressed, Bcl-2 and Bcl-XL downregulation was partially restored, and cleaved caspase-3 generation was significantly reduced (Figure 6J-N). These findings suggest that LCA activates the p38/JNK/MAPK signaling pathway to modulate the balance of Bcl-2 family proteins, induce MMP dissipation, activate caspase-3, and ultimately drive mitochondria-dependent apoptosis in HCC cells.
5. Discussion
LCA, the main prenylated chalcone in licorice, has attracted considerable interest because of its antitumor activity. Consistent with this, our findings indicate that LCA significantly inhibits HCC cell proliferation, migration, and invasion in a dose-dependent manner and induces apoptosis. Notably, LCA exhibits relatively low cytotoxicity toward normal hepatocytes (THLE-2), providing important safety evidence for its potential as an anti-HCC drug candidate. This study showed that LCA treatment induced typical mitochondrial dysfunction in HCC cells, manifested by significant MMP dissipation, reduced ATP production, and cytochrome c release from mitochondria into the cytoplasm. Initiation of the mitochondrial pathway critically depends on the dysregulated balance of Bcl-2 family proteins (23). Licochalcone A treatment induced the upregulation of the proapoptotic protein Bax and the downregulation of the antiapoptotic proteins Bcl-2 and Bcl-XL. This change in the Bax/Bcl-2 ratio forms the molecular basis for initiating mitochondrial outer membrane permeabilization (24). Mitochondrial outer membrane permeabilization facilitates cytochrome c release, which subsequently activates the downstream caspase cascade and ultimately leads to the cleavage and activation of effector caspase-3 (25, 26). This mechanism of activating the mitochondrial apoptotic pathway through modulation of Bcl-2 family proteins has been extensively validated in studies of other cancer cells, including breast and lung cancer cells (27, 28).
This study identified ROS as a critical signal mediating LCA-induced cellular damage. The experimental results showed that LCA treatment caused a marked elevation of intracellular ROS levels in HCC cells, accompanied by depletion of the antioxidant system, including GSH and SOD. Pretreatment with the ROS scavenger NAC partially attenuated LCA-induced ROS elevation and downstream signal activation. Licochalcone A induces mitochondrial dysfunction and promotes mitochondria-derived ROS generation, thereby triggering oxidative stress in cells. These findings are consistent with previous studies (29, 30), confirming that the antitumor activity of LCA depends on ROS-mediated oxidative stress mechanisms. However, in experiments using DCFH-DA to detect ROS, its varying sensitivity to different ROS species and potential interactions with other cellular components can lead to nonspecific signals. Therefore, future studies should consider additional ROS detection methods, such as more specific fluorescent probes or electron spin resonance technology, to detect specific ROS species.
Driven by ROS signaling, activation of the p38 and JNK subfamilies within the MAPK pathway serves as a critical hub linking oxidative stress to apoptosis (31, 32). The present study demonstrated that LCA significantly enhanced the phosphorylation levels of p38 and JNK, whereas intervention with specific inhibitors, SB203580 and SP600125, markedly attenuated LCA-induced MMP decline and apoptosis. At the molecular level, ROS activates apoptosis through oxidative modification of thioredoxin, an inhibitory protein of apoptosis signal-regulating kinase 1 (ASK1), leading to ASK1 dissociation and activation (33). ASK1, functioning as a MAP3K, subsequently phosphorylates p38 and JNK through MKK3/6 and MKK4/7, respectively (34). Activation of the ASK1-MAPK axis represents a critical pathway for cellular responses to oxidative stress and endoplasmic reticulum stress (35). Activated p38 and JNK kinases then directly participate in regulating mitochondrial apoptosis through phosphorylation of Bcl-2 family members (36). In this study, inhibition of the p38/JNK signaling pathway significantly antagonized LCA-induced Bax upregulation and Bcl-2 downregulation. This finding further indicates that the p38/JNK pathway regulates the expression balance of Bcl-2 family proteins, thereby regulating ROS-driven, mitochondria-dependent apoptosis. Based on these findings, we hypothesize that LCA induces mitochondrial dysfunction and promotes mitochondrial ROS production, which further activates the p38/JNK signaling pathway. This pathway disrupts mitochondrial homeostasis and triggers apoptosis by regulating Bcl-2 family proteins.
Beyond its proapoptotic effects, LCA-mediated inhibition of HCC cell migration and invasion has equally important clinical implications. Transwell data from this study verified that LCA effectively inhibited the metastatic potential of HCC cells. This antimetastatic activity may be attributed to its regulatory effects on p38/JNK/MAPK signaling (37, 38). The p38 and JNK pathways can regulate the expression of matrix metalloproteinases through activation of AP-1 transcription factors, thereby affecting the ability of tumor cells to degrade the extracellular matrix (39). Studies have found that activation of p38/JNK may inhibit the expression of metastasis-associated proteins such as MMP-2 and MMP-9, consequently suppressing cancer cell invasion (40). In addition, the anticancer efficacy of LCA is reflected in its inhibitory effects on other survival pathways. Multiple studies have demonstrated that LCA exerts anticancer effects by inhibiting several pathways, including PI3K/Akt/mTOR and NF-κB (41, 42). This multi-target and multi-pathway characteristic enables LCA to exhibit more comprehensive antitumor potential and may help overcome the limitations of drug resistance associated with single-target agents.
Although this study reveals important molecular mechanisms underlying the anti-HCC activity of LCA, several limitations should be noted. First, this research was conducted solely in vitro using cellular models and did not address the more complex in vivo environment; therefore, validation in tumor-bearing animal models is lacking. In the complex tumor microenvironment, factors such as immune cell infiltration, matrix composition, and angiogenesis may influence the efficacy and pharmacokinetic properties of LCA, which are difficult to replicate in vitro. Furthermore, systematic evaluation of the in vivo distribution, metabolism, and excretion of LCA remains incomplete, although these parameters are critical for assessing its clinical application potential. At the mechanistic level, although inhibitor interference experiments confirmed the pivotal role of the ROS-p38/JNK-mitochondrial apoptosis axis, potential direct interactions between LCA and other signaling pathways remain insufficiently studied. Direct experimental evidence, such as molecular docking, gene knockout, or knockdown studies, is still lacking to substantiate these interactions. Future research should incorporate additional molecular biology and biochemical experiments to elucidate the specific intracellular mechanisms and targets of LCA. Therefore, although this study provides valuable preliminary evidence for the anti-HCC activity of LCA, subsequent work should validate its antitumor effects in in vivo models and conduct more in-depth investigations of its pharmacokinetic properties and mechanisms of action.
5.1. Conclusions
In summary, this study elucidated the molecular mechanisms by which LCA induces intracellular ROS accumulation, activates the p38/JNK/MAPK signaling pathway, and subsequently triggers mitochondrial dysfunction and caspase-3-mediated intrinsic apoptotic programs. These findings not only provide scientific evidence supporting LCA as a natural drug candidate for HCC treatment but also strengthen the rationale for combination therapeutic strategies targeting the ROS-MAPK axis. Future studies should further explore and validate the antitumor efficacy of LCA in in vivo models and investigate its cross-regulatory mechanisms with other signaling pathways, with the aim of advancing the translational application of LCA in clinical HCC treatment.