1. Background
Metabolic dysfunction-associated steatotic liver disease (MASLD), the updated clinical definition of non-alcoholic fatty liver disease (NAFLD), is a central component of metabolic syndrome and is strongly associated with obesity, insulin resistance, type 2 diabetes, and dyslipidemia (1, 2). As the global prevalence of obesity and metabolic disorders increases, the incidence of MASLD is also rising, imposing a growing burden on health systems and socioeconomic development worldwide (3). As the most common chronic liver disease, MASLD is characterized by frequent multimorbidity, which substantially influences disease progression and prognosis. Importantly, MASLD not only contributes to liver-related mortality but also increases the risk of death from cardiovascular disease, type 2 diabetes, and other metabolic conditions (4).
Established noninvasive fibrosis markers, such as the Fibrosis-4 Index (FIB-4), AST-to-platelet ratio Index (APRI), and NAFLD fibrosis score (NFS), are routinely used to assess fibrosis stage and predict liver-related outcomes. However, their ability to predict all-cause mortality in MASLD is limited. This limitation primarily arises because the leading causes of death in this population are extrahepatic, particularly cardiovascular disease and certain extrahepatic cancers (5). Furthermore, even for their primary purpose of assessing fibrosis, FIB-4 scores have inherent diagnostic limitations, including low accuracy in younger patients and declining specificity in older adults (6), which can further compromise their reliability as prognostic tools for long-term mortality.
In this context, simple and widely available laboratory biomarkers may provide additional prognostic value. RDW, a routine parameter reflecting heterogeneity of erythrocyte volume, is elevated in states of impaired erythropoiesis and chronic inflammation (7). It has been robustly associated with the severity and prognosis of various cardiovascular conditions, including heart failure, acute coronary syndrome, and atrial fibrillation (8-11). RAR, which integrates RDW with serum albumin, a marker of nutritional status, has emerged as a more comprehensive prognostic indicator. RAR can independently predict all-cause and cause-specific mortality in multiple diseases and has been validated in the general US population (12-15).
2. Objectives
Despite substantial evidence supporting the prognostic significance of RDW and RAR in diverse chronic diseases, the associations between these biomarkers and long-term mortality in patients with NAFLD/MASLD remain insufficiently investigated. Therefore, this study aimed to evaluate the associations of RDW and RAR with long-term all-cause and CVD mortality in a nationally representative sample of US adults with NAFLD/MASLD.
3. Methods
3.1. Study Design and Participants
This study was an observational, population-based cohort analysis using NHANES data linked to mortality follow-up. Analyses were conducted separately for NAFLD and MASLD because of differences in diagnostic criteria, rather than including a single population with parallel cohorts. Participants aged 18 years or older from 10 survey cycles (1999 - 2018) were included (Figure 1). The following participants were excluded: 1) participants aged < 18 years (n = 42112); 2) pregnant participants (n = 809); 3) participants with excessive alcohol consumption, defined as ≥ 140 g/week for females and ≥ 210 g/week for males (n = 15557); 4) participants with hepatitis B (n = 257), hepatitis C infection (n = 860), or hepatocarcinoma (n = 36); 5) participants with missing RDW (n = 5103) or albumin (ALB) data (n = 688); 6) participants with missing mortality data (n = 67); and 7) participants without available data to calculate the US fatty liver Index (US-FLI) (n = 19377). According to the diagnostic criteria for NAFLD (16) and MASLD (17), the final study population included 5519 participants with NAFLD and 5387 participants with MASLD. The NHANES survey was approved by the institutional review board of the National Center for Health Statistics, and all participants provided written informed consent. Given the complex, stratified, multistage probability sampling design of NHANES, Mobile Examination Center sampling weights were incorporated into the analyses. Specifically, the 1999 - 2002 cycles (2 cycles) were assigned weights of (2/10) × WTMEC4YR, whereas the remaining 8 cycles (2003 - 2018) were assigned weights of (1/10) × WTMEC2YR to ensure nationally representative estimates (18).
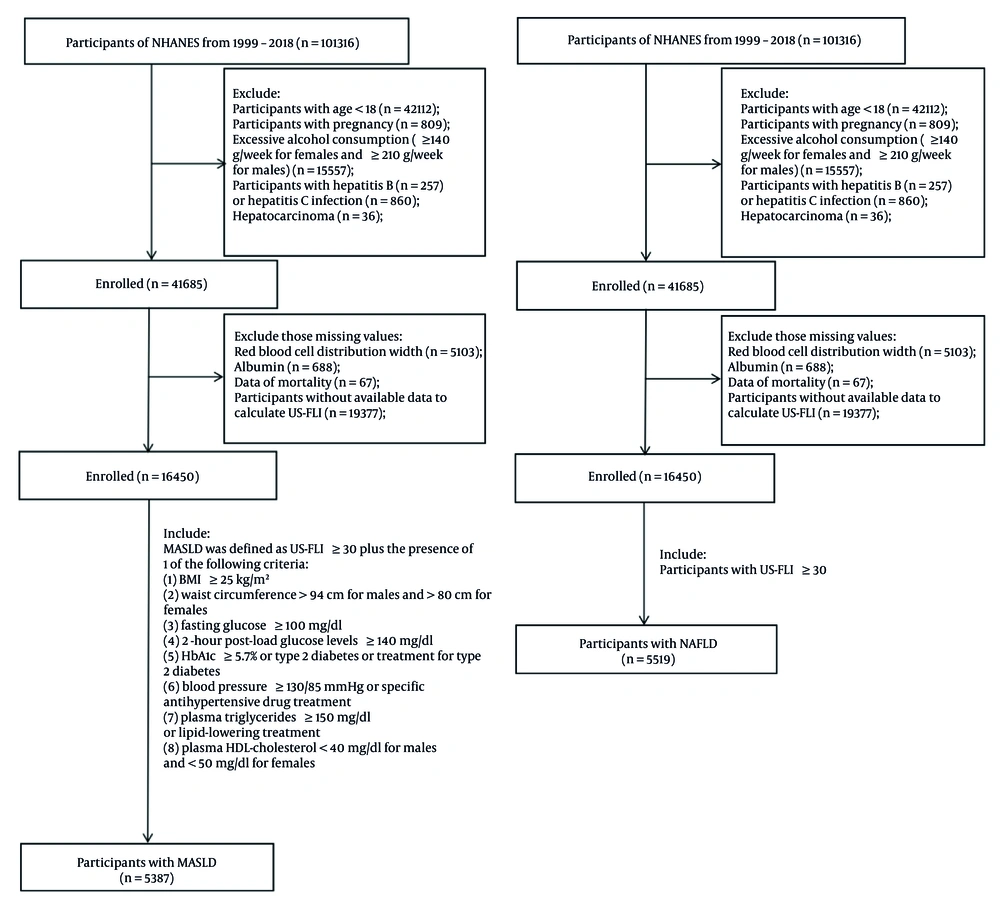
Figure 1.
Flow chart of the selection of included studies
3.2. Definitions
3.2.1. RDW-to-Albumin Ratio
The RDW-to-albumin ratio (RAR) was calculated as follows: RAR = red cell distribution width (%) / serum albumin (g/dL) (19). During the NHANES survey, peripheral blood RDW (%) was measured using a Coulter analyzer at the Mobile Examination Center. Albumin levels (g/dL) were assessed using the bromocresol purple method. Laboratory testing methods were consistent across all cycles (20).
3.2.2. Body Mass Index
Body Mass Index (BMI) was calculated as weight in kilograms divided by height in meters squared (kg/m2).
3.2.3. Hypertension
Hypertension was defined as systolic blood pressure ≥ 140 mmHg, diastolic blood pressure ≥ 90 mmHg, or the use of antihypertensive medications.
3.2.4. US Fatty Liver Index
The US-FLI was calculated as follows (21): (e−0.8073×non-Hispanic black + 0.3458×Mexican American + 0.0093×age + 0.6151×loge (GGT) + 0.0249×waist circumference + 1.1792×loge (insulin) + 0.8242 ×loge (glucose) – 14.7812)/(1 + e−0.8073×non-Hispanic black + 0.3458×Mexican American + 0.0093×age + 0.6151×loge (GGT) + 0.0249×waist circumference + 1.1792×loge (insulin) + 0.8242×loge (glucose) – 14.7812)×100
3.2.5. Steatotic Liver Disease
Steatotic liver disease (SLD) was defined as a US-FLI ≥ 30 (22).
3.2.6. Non-Alcoholic Fatty Liver Disease
NAFLD was defined as the presence of SLD after excluding viral hepatitis (positive hepatitis B surface antigen, positive hepatitis C antibody, or positive hepatitis C RNA) and excessive alcohol intake (≥ 140 g/week for females and ≥ 210 g/week for males) (16).
3.2.7. Metabolic Dysfunction-Associated Steatotic Liver Disease
MASLD was defined as SLD with at least 1 cardiometabolic risk factor, without excessive alcohol intake, and with viral hepatitis excluded (17). Cardiometabolic risk factors included: 1) BMI ≥ 25 kg/m2 or waist circumference ≥ 94 cm for males and ≥ 80 cm for females; 2) fasting glucose ≥ 100 mg/dL, 2-hour post-load glucose ≥ 140 mg/dL, hemoglobin A1c ≥ 5.7%, type 2 diabetes, or treatment for type 2 diabetes; 3) blood pressure ≥ 130/85 mmHg or specific antihypertensive drug treatment; 4) plasma triglycerides ≥ 150 mg/dL or lipid-lowering treatment; and 5) plasma high-density lipoprotein cholesterol < 40 mg/dL for males and < 50 mg/dL for females or lipid-lowering treatment (17).
3.2.8. Diabetes
Diabetes was diagnosed according to any of the following 5 criteria (14): 1) physician-confirmed diabetes; 2) documented use of diabetes medication; 3) glycohemoglobin ≥ 6.5%; 4) fasting glucose ≥ 7.0 mmol/L; or 5) random blood glucose ≥ 11.1 mmol/L.
3.2.9. Laboratory Measurements
Laboratory measurements included complete blood count data. Biochemical markers included aspartate aminotransferase (AST, U/L), alanine aminotransferase (ALT, U/L), gamma-glutamyl transferase (GGT, U/L), fasting blood glucose (FBG, mmol/L), and insulin (pmol/L). NHANES laboratory methods remained consistent across the 1999 - 2018 cycles. These measurements were obtained using automated hematological analysis equipment. Detailed operating procedures are available on the National Center for Health Statistics website (23).
3.2.10. Outcome Definitions
Mortality status was assessed by linking NHANES data to the National Death Index from the National Center for Health Statistics. All-cause mortality was defined as death from any cause. Cause-specific mortality was defined using the International Classification of Diseases, Tenth Revision. Cardiovascular mortality referred to deaths caused by major cardiovascular and cerebrovascular diseases (codes I00 - I09, I11, I13, I20 - I51, and I60 - I69). Diabetes mortality referred to deaths caused by diabetes (codes E10 - E14). Follow-up was considered complete at death or on December 31, 2019.
3.3. Covariates
The covariates included in this study were selected based on prior research evidence and clinical relevance (15, 24). Questionnaire data covered demographic characteristics, health conditions, and lifestyle factors, including age, sex, ethnicity, educational attainment, household income, physical activity level, smoking behavior, and drinking behavior. Medical history variables, including hypertension, diabetes, hyperlipidemia, and cancer, were also considered covariates. Participants were classified by ethnicity as Mexican American, non-Hispanic White, non-Hispanic Black, or other. Educational attainment was divided into 3 categories: less than high school, high school diploma or equivalent, and college education or above. Household income was assessed using the PIR. Participants were stratified into 3 tiers: low (PIR < 1.30), moderate (1.30 ≤ PIR < 3.50), and high (PIR ≥ 3.50) (25). Physical activity was classified as low (< 500 MET/wk) or high (≥ 500 MET/wk) using metabolic equivalent of task (MET) values (26). Smoking status was classified as never, former, or current (27). Cancer diagnosis information was collected by self-report. Participants were asked, "Have you ever been told by a doctor or other health professional that you had cancer or a malignancy of any kind?" Individuals who responded positively were identified as cancer survivors (28).
3.4. Statistical Analyses
To ensure the generalizability of the findings to the noninstitutionalized civilian population of the United States, sample weighting, stratification design, and sensitivity analyses were applied. According to weighted RDW and RAR quartiles, all participants were assigned to 4 subgroups (Q1 - Q4): RDW Q1 (RDW ≤ 12.40%), Q2 (12.40% < RDW ≤ 13.00%), Q3 (13.00% < RDW ≤ 13.70%), and Q4 (RDW > 13.70%); and RAR Q1 (RAR ≤ 2.88), Q2 (2.88 < RAR ≤ 3.10), Q3 (3.10 < RAR ≤ 3.38), and Q4 (RAR > 3.38). To mitigate reductions in sample size due to missing covariate data, missing covariates were imputed using linear and logistic regression models. Variables with < 20% missingness were imputed, whereas variables with > 20% missingness were excluded. Final imputed values were obtained through nearest-neighbor matching based on the predictive mean matching framework. Table S1 in the Supplementary File shows the proportion of missing data for each variable. Among participants with MASLD, missing data accounted for 9 (0.17%) for FIB-4, 6 (0.11%) for education, 183 (3.4%) for smoking status, 957 (17.76%) for physical activity, 231 (4.29%) for energy intake, 41 (0.76%) for BMI, 141 (2.62%) for marital status, 521 (9.67%) for PIR, 16 (0.30%) for hypertension, 76 (1.41%) for diabetes, and 222 (4.12%) for cancer. Among participants with NAFLD, missing data accounted for 0.18% for FIB-4, 0.11% for education, 3.48% for smoking status, 17.72% for physical activity, 4.96% for energy intake, 0.82% for BMI, 2.55% for marital status, 9.62% for PIR, 0.29% for hypertension, 1.38% for diabetes, and 4.19% for cancer. Because of collinearity concerns, the variance inflation factor of the covariates was assessed, and only covariates with variance inflation factor values < 5 were included in the model. Comprehensive data for the multicollinearity tests are provided in Tables S4-S7 in the Supplementary File. To assess the robustness of the Cox regression results, 5 sensitivity analyses were conducted: 1) analyzing the original dataset without data imputation (Tables S8-S9 in the Supplementary File); 2) removing extreme RDW/RAR values (Tables S10-S11 in the Supplementary File); 3) introducing additional variables, including BMI and energy intake (Tables S12-S13 in the Supplementary File); 4) excluding participants who died early during follow-up, defined as death within 2 years of follow-up, to mitigate reverse causation (Tables S14-S15 in the Supplementary File); and 5) excluding participants with CVD (Tables S16-S17 in the Supplementary File).
Before analysis, data were weighted according to official NHANES guidelines to ensure national representativeness. Continuous and categorical data are presented as weighted means and SEs or frequencies (percentages), respectively. Kaplan-Meier curves and log-rank tests were used to compare event-free survival by RDW and RAR levels. Weighted Cox proportional hazards models were used to examine the associations of RDW and RAR with all-cause and CVD mortality. Schoenfeld residuals were used to test the proportional hazards assumption in the Cox regression models, and the assumption was fulfilled for the all-cause and CVD mortality endpoints. The following adjustments were used: Model 1 was the crude model; Model 2 was adjusted for sex, age as a continuous variable, and race; and Model 3 included the variables in Model 2 plus marital status, education, smoking, physical activity, PIR, hypertension, diabetes, hyperlipidemia, cancer, and FIB-4. Subgroups were stratified by age group (< 45, 45 - 60, and ≥ 60 years), sex, educational level, race, family PIR (< 1.3, 1.3 - 3.5, and ≥ 3.5), and FIB-4 Index (< 1.3, 1.3 - 2.67, and ≥ 2.67). P values for interaction effects were determined using likelihood ratio tests comparing Cox proportional hazards regression models with and without cross-product terms for each evaluated factor. Finally, restricted cubic spline regressions were conducted to estimate potential nonlinearity between RDW and RAR and the risk of all-cause and CVD mortality after adjustment for confounding factors in Model 3. The restricted cubic spline function was used to evaluate nonlinearity, and analysis of variance testing was applied to assess whether the full model and nonlinear terms significantly improved model fit. The value that maximized likelihood within the candidate threshold range was selected to determine the optimal inflection point. Four knots were used, with knot locations at the weighted 5th, 35th, 65th, and 95th percentiles. The reference value was the median. Threshold-effect analysis was conducted to identify inflection points using the "segmented" package. All results were considered statistically significant at a 2-tailed P < 0.05. All analyses were adjusted using the complex weights of NHANES. The "survey" R package was used. Kaplan-Meier survival curves were plotted using the "jskm" package, and RCS analyses were performed with the "rms" package.
4. Results
4.1. Participant Characteristics
In this observational, population-based cohort analysis using NHANES with linked mortality follow-up, 2 independent cohort analyses were conducted based on the NAFLD and MASLD definitions. According to the diagnostic criteria for NAFLD (16), 16450 participants were included, of whom 5519 (33.6%) met the NAFLD criteria. In the MASLD cohort, 16450 participants were included, of whom 5387 (32.7%) met the MASLD criteria (Figure 1). To account for the complex sampling design of NHANES, all analyses were performed using appropriate sample weights. The baseline characteristics of participants with MASLD are summarized in Table 1. The mean age was 54.21 (SE, 0.31) years; 2450 (43.08%) were female, and 2937 (56.92%) were male. Participants were stratified into 4 quartiles based on weighted RDW levels: Q1 (RDW ≤ 12.40%), Q2 (12.40% < RDW ≤ 13.00%), Q3 (13.00% < RDW ≤ 13.70%), and Q4 (RDW > 13.70%). Table 1 shows significant differences across quartiles in sex, age, race, marital status, physical activity, PIR, hypertension, diabetes, cancer, FIB-4, BMI, and energy intake (all P < 0.05). All-cause and CVD mortality rates were highest in the Q4 group (19.84% and 7.77%, respectively), with significant differences across quartiles (P = 0.031 for all-cause mortality; P = 0.007 for CVD mortality). Similarly, Table 2 presents participants with MASLD stratified by weighted RAR quartiles: Q1 (RAR ≤ 2.88), Q2 (2.88 < RAR ≤ 3.10), Q3 (3.10 < RAR ≤ 3.38), and Q4 (RAR > 3.38). The 4 groups also differed significantly in the aforementioned variables (all P < 0.05). Mortality rates were significantly higher in Q4 than in the lower quartiles (all-cause mortality, 19.96% vs 13.92% - 17.99%, P = 0.011; CVD mortality, 8.11% vs 4.13% - 5.56%, P = 0.002). The baseline characteristics of participants with NAFLD, stratified by weighted RDW and RAR quartiles, showed similar patterns (Tables S2 and S3 in Supplementary File).
| Variables | Total | Q1 | Q2 | Q3 | Q4 | Statistic | P |
|---|---|---|---|---|---|---|---|
| Number of participants | 5387 (100) | 1102 (20.46) | 1419 (26.34) | 1303 (24.19) | 1563 (29.01) | ||
| Gender | χ2 = 78.35 | < 0.001 | |||||
| Male | 2937 (56.92) | 645 (63.51) | 839 (60.53) | 703 (57.11) | 750 (47.63) | ||
| Female | 2450 (43.08) | 457 (36.49) | 580 (39.47) | 600 (42.89) | 813 (52.37) | ||
| Age | 54.21 (0.31) | 49.62 (0.55) | 53.32 (0.55) | 55.50 (0.64) | 57.63 (0.52) | F = 37.90 | < 0.001 |
| Race | χ2= 133.66 | < 0.001 | |||||
| Mexican American | 1356 (10.13) | 376 (11.71) | 384 (10.23) | 306 (10.19) | 290 (8.68) | ||
| Non-Hispanic White | 2509 (72.48) | 537 (76.03) | 714 (76.00) | 606 (71.88) | 652 (66.48) | ||
| Non-Hispanic Black | 645 (6.19) | 61 (2.85) | 124 (4.36) | 133 (5.19) | 327 (11.72) | ||
| Other | 877 (11.21) | 128 (9.41) | 197 (9.42) | 258 (12.73) | 294 (13.11) | ||
| Marital status | χ2 = 29.98 | 0.008 | |||||
| Married or living with a partner | 3423 (68.67) | 722 (70.88) | 936 (70.80) | 817 (67.68) | 948 (65.56) | ||
| Single | 1274 (19.82) | 201 (15.59) | 313 (18.59) | 336 (21.48) | 424 (22.96) | ||
| Never married | 690 (11.52) | 179 (13.53) | 170 (10.61) | 150 (10.84) | 191 (11.48) | ||
| Education | χ2 = 7.45 | 0.595 | |||||
| Less than high school | 1891 (22.21) | 408 (22.86) | 498 (22.07) | 458 (22.07) | 527 (21.97) | ||
| High school or equivalent | 1199 (24.58) | 241 (22.29) | 317 (25.33) | 277 (23.62) | 364 (26.51) | ||
| College or above | 2297 (53.21) | 453 (54.85) | 604 (52.59) | 568 (54.30) | 672 (51.53) | ||
| Physical activity | χ2 = 50.02 | < 0.001 | |||||
| Low physical activity | 2468 (42.80) | 424 (35.48) | 637 (43.92) | 587 (41.15) | 820 (49.05) | ||
| High physical activity | 2919 (57.20) | 678 (64.52) | 782 (56.08) | 716 (58.85) | 743 (50.95) | ||
| Smoking status | χ2 = 3.12 | 0.948 | |||||
| Never | 2961 (54.32) | 614 (53.18) | 758 (55.35) | 735 (54.32) | 854 (54.14) | ||
| Former | 1702 (32.44) | 340 (32.73) | 471 (31.72) | 397 (33.36) | 494 (32.09) | ||
| Current | 724 (13.24) | 148 (14.09) | 190 (12.93) | 171 (12.31) | 215 (13.76) | ||
| Energy intake, kcal/day | 2090.49 (16.88) | 2228.59 (38.75) | 2140.53 (30.61) | 2036.48 (36.24) | 1976.99 (33.46) | F = 10.54 | < 0.001 |
| BMI | 33.87 (0.15) | 31.92 (0.24) | 33.34 (0.24) | 34.02 (0.23) | 35.85 (0.27) | F = 43.96 | < 0.001 |
| PIR | χ2 = 24.05 | 0.029 | |||||
| < 1.3 | 1821 (22.40) | 348 (20.75) | 459 (20.11) | 437 (22.15) | 577 (26.37) | ||
| 1.3 - < 3.5 | 2096 (38.05) | 431 (37.57) | 545 (38.05) | 514 (38.48) | 606 (38.04) | ||
| ≥ 3.5 | 1470 (39.55) | 323 (41.68) | 415 (41.84) | 352 (39.37) | 380 (35.59) | ||
| FIB-4 | 1.18 (0.01) | 1.02 (0.02) | 1.14 (0.02) | 1.23 (0.03) | 1.31 (0.03) | F = 25.81 | < 0.001 |
| Hypertension | χ2 = 60.90 | < 0.001 | |||||
| No | 2118 (40.73) | 508 (45.29) | 625 (46.11) | 491 (38.36) | 494 (33.59) | ||
| Yes | 3269 (59.27) | 594 (54.71) | 794 (53.89) | 812 (61.64) | 1069 (66.41) | ||
| Diabetes | χ2 = 127.88 | < 0.001 | |||||
| No | 3253 (66.84) | 764 (74.68) | 933 (73.45) | 756 (62.66) | 800 (57.48) | ||
| Yes | 2134 (33.16) | 338 (25.32) | 486 (26.55) | 547 (37.34) | 763 (42.52) | ||
| Hyperlipidemia | χ2 = 4.08 | 0.553 | |||||
| No | 639 (11.04) | 114 (9.58) | 163 (10.91) | 161 (12.05) | 201 (11.41) | ||
| Yes | 4748 (88.96) | 988 (90.42) | 1256 (89.09) | 1142 (87.95) | 1362 (88.59) | ||
| Cancer | χ2 = 79.76 | < 0.001 | |||||
| No | 4711 (86.95) | 1010 (91.38) | 1248 (88.31) | 1147 (88.64) | 1306 (80.37) | ||
| Yes | 676 (13.05) | 92 (8.62) | 171 (11.69) | 156 (11.36) | 257 (19.63) | ||
| All-cause mortality | χ2 = 12.81 | 0.031 | |||||
| No | 4225 (82.76) | 899 (84.59) | 1083 (82.23) | 1043 (84.59) | 1200 (80.16) | ||
| Yes | 1162 (17.24) | 203 (15.41) | 336 (17.77) | 260 (15.41) | 363 (19.84) | ||
| CVD mortality | χ2 = 16.05 | 0.007 | |||||
| No | 4998 (94.32) | 1036 (94.81) | 1326 (95.29) | 1214 (95.05) | 1422 (92.23) | ||
| Yes | 389 (5.68) | 66 (5.19) | 93 (4.71) | 89 (4.95) | 141 (7.77) |
a Values are expressed as No. (%) or mean (SE). Abbreviations: BMI, Body Mass Index; CVD, cardiovascular disease; FIB-4, Fibrosis-4 Index; MASLD, metabolic dysfunction-associated steatotic liver disease; PIR, poverty-income ratio; RDW, red cell distribution width.
b Q1: RDW ≤ 12.40%; Q2: 12.40% < RDW ≤ 13.00%; Q3: 13.00% < RDW ≤ 13.70%; Q4: RDW > 13.70%. Group differences were assessed using the chi-square test for categorical variables or 1-way analysis of variance for continuous variables.
| Variables | Total | Q1 | Q2 | Q3 | Q4 | Statistic | P-Value |
|---|---|---|---|---|---|---|---|
| Number of participants | 5387 (100) | 1222 (22.68) | 1287 (23.89) | 1356 (25.17) | 1522 (28.25) | ||
| Gender | χ2 = 368.35 | < 0.001 | |||||
| Male | 2937 (56.92) | 871 (74.95) | 780 (61.30) | 666 (52.12) | 620 (39.46) | ||
| Female | 2450 (43.08) | 351 (25.05) | 507 (38.70) | 690 (47.88) | 902 (60.54) | ||
| Age | 54.21 (0.31) | 49.21 (0.55) | 54.71 (0.53) | 56.52 (0.60) | 56.35 (0.58) | F = 39.07 | < 0.001 |
| Race | χ2= 156.60 | < 0.001 | |||||
| Mexican American | 1356 (10.13) | 412 (11.90) | 328 (9.45) | 325 (10.26) | 291 (8.90) | ||
| Non-hispanic White | 2509 (72.48) | 584 (75.11) | 652 (76.36) | 648 (73.18) | 625 (65.30) | ||
| Non-hispanic Black | 645 (6.19) | 55 (2.17) | 97 (3.66) | 176 (6.82) | 317 (12.07) | ||
| Other | 877 (11.21) | 171 (10.82) | 210 (10.53) | 207 (9.75) | 289 (13.74) | ||
| Marital status | χ2 = 106.61 | < 0.001 | |||||
| Married or living with a partner | 3423 (68.67) | 820 (73.25) | 875 (70.80) | 857 (69.35) | 871 (61.30) | ||
| Single | 1274 (19.82) | 185 (12.33) | 279 (19.32) | 362 (22.23) | 448 (25.32) | ||
| Never married | 690 (11.52) | 217 (14.42) | 133 (9.88) | 137 (8.42) | 203 (13.38) | ||
| Education | χ2 = 11.08 | 0.375 | |||||
| Less than high school | 1891 (22.21) | 430 (21.16) | 450 (22.37) | 472 (21.31) | 539 (24.00) | ||
| High school or equivalent | 1199 (24.58) | 274 (23.95) | 294 (25.35) | 278 (23.03) | 353 (25.98) | ||
| College or above | 2297 (53.21) | 518 (54.88) | 543 (52.27) | 606 (55.65) | 630 (50.02) | ||
| Physical activity | χ2 = 57.48 | < 0.001 | |||||
| Low physical activity | 2468 (42.80) | 454 (35.62) | 552 (41.02) | 658 (44.96) | 804 (49.53) | ||
| High physical activity | 2919 (57.20) | 768 (64.38) | 735 (58.98) | 698 (55.04) | 718 (50.47) | ||
| Smoking status | χ2 = 13.75 | 0.218 | |||||
| Never | 2961 (54.32) | 687 (55.13) | 678 (53.12) | 730 (52.33) | 866 (56.71) | ||
| Former | 1702 (32.44) | 385 (33.16) | 439 (33.75) | 440 (33.90) | 438 (28.94) | ||
| Current | 724 (13.24) | 150 (11.71) | 170 (13.13) | 186 (13.77) | 218 (14.35) | ||
| Energy intake, kcal/day | 2090.49 (16.88) | 2269.51 (33.07) | 2060.72 (34.22) | 2068.76 (32.44) | 1964.06 (30.41) | F = 17.33 | < 0.001 |
| BMI | 33.87 (0.15) | 31.24 (0.19) | 32.68 (0.21) | 34.51 (0.26) | 37.01 (0.32) | F = 104.93 | < 0.001 |
| PIR | χ2 = 52.06 | < 0.001 | |||||
| < 1.3 | 1821 (22.40) | 359 (18.19) | 427 (21.19) | 447 (21.76) | 588 (28.45) | ||
| 1.3 ≥ 3.5 | 2096 (38.05) | 508 (40.20) | 469 (36.53) | 542 (37.66) | 577 (37.81) | ||
| ≥ 3.5 | 1470 (39.55) | 355 (41.61) | 391 (42.28) | 367 (40.58) | 357 (33.74) | ||
| FIB-4 | 1.18 (0.01) | 1.04 (0.02) | 1.20 (0.02) | 1.23 (0.02) | 1.26 (0.03) | F = 19.29 | < 0.001 |
| Hypertension | χ2 = 50.72 | < 0.001 | |||||
| No | 2118 (40.73) | 587 (47.11) | 490 (39.43) | 535 (42.42) | 506 (33.96) | ||
| Yes | 3269 (59.27) | 635 (52.89) | 797 (60.57) | 821 (57.58) | 1016 (66.04) | ||
| Diabetes | χ2 = 130.71 | < 0.001 | |||||
| No | 3253 (66.84) | 869 (77.00) | 821 (69.52) | 798 (63.96) | 765 (56.99) | ||
| Yes | 2134 (33.16) | 353 (23.00) | 466 (30.48) | 558 (36.04) | 757 (43.01) | ||
| Hyperlipidemia | χ2 = 14.88 | 0.043 | |||||
| No | 639 (11.04) | 134 (9.39) | 144 (9.89) | 156 (11.23) | 205 (13.64) | ||
| Yes | 4748 (88.96) | 1088 (90.61) | 1143 (90.11) | 1200 (88.77) | 1317 (86.36) | ||
| Cancer | χ2 = 66.05 | < 0.001 | |||||
| No | 4711 (86.95) | 1126 (92.25) | 1130 (88.25) | 1177 (85.17) | 1278 (82.17) | ||
| Yes | 676 (13.05) | 96 (7.75) | 157 (11.75) | 179 (14.83) | 244 (17.83) | ||
| All-cause mortality | χ2 = 17.88 | 0.011 | |||||
| No | 4225 (82.76) | 1006 (86.08) | 996 (82.01) | 1060 (82.93) | 1163 (80.04) | ||
| Yes | 1162 (17.24) | 216 (13.92) | 291 (17.99) | 296 (17.07) | 359 (19.96) | ||
| CVD mortality | χ2 = 22.30 | 0.002 | |||||
| No | 4998 (94.32) | 1155 (95.87) | 1187 (94.44) | 1270 (95.08) | 1386 (91.89) | ||
| Yes | 389 (5.68) | 67 (4.13) | 100 (5.56) | 86 (4.92) | 136 (8.11) |
a Values are expressed as No. (%) or mean (SE). Abbreviations: BMI, Body Mass Index; CVD, cardiovascular disease; FIB-4, Fibrosis-4 Index; MASLD, metabolic dysfunction-associated steatotic liver disease; PIR, poverty-income ratio; RAR, red blood cell distribution width-to-albumin ratio; RDW, red cell distribution width.
b Q1: RAR ≤ 2.88; Q2: 2.88 < RAR ≤ 3.10; Q3: 3.10 < RAR ≤ 3.38; Q4: RAR > 3.38. Group differences were assessed using the chi-square test for categorical variables or 1-way analysis of variance for continuous variables.
4.2. Associations of RDW and RAR With All-Cause and CVD Mortality in Patients With MASLD
During a median follow-up of 115 months (range, 1 - 249 months), 1162 patients with MASLD died from all causes, and 389 died from CVD (Tables 1 and 2). Kaplan-Meier analysis showed that participants in higher RDW and RAR quartiles had significantly increased risks of both all-cause and CVD mortality (log-rank P < 0.001; Figure 2). Cox proportional hazards models were used to further quantify these associations (Table 3). In the unadjusted model (Model 1), RDW and RAR, analyzed as continuous variables, were significantly associated with increased risks of all-cause and CVD mortality. These associations remained significant after progressive adjustment for covariates, including in the fully adjusted model (Model 3). To assess the robustness of these findings, RDW and RAR were also analyzed as categorical variables (quartiles). Compared with the lowest quartile (Q1), participants in the highest quartile (Q4) of both RDW and RAR had significantly higher risks of all-cause and CVD mortality in all models (all P < 0.05), with significant dose-response trends across quartiles (P-trend < 0.001). Although effect sizes were attenuated in Model 3, the associations remained statistically significant.
Table 3.
Hazard Ratios (95% Confidence Intervals) for All-Cause and CVD Mortality According to RDW and RAR Quartiles Among Participants with MASLD a
| Variables | Model 1 | Model 2 | Model 3 | |||
|---|---|---|---|---|---|---|
| HR (95% CI) | P-Value | HR (95% CI) | P-Value | HR (95% CI) | P-Value | |
| All-cause mortality | ||||||
| RDW | 1.20 (1.13 - 1.28) | < 0.001 | 1.20 (1.14 - 1.27) | < 0.001 | 1.19 (1.12 - 1.26) | < 0.001 |
| Q1 | 1.00 (Reference) | 1.00 (Reference) | 1.00 (Reference) | |||
| Q2 | 1.47 (1.19 - 1.82) | < 0.001 | 1.17 (0.94 - 1.45) | 0.165 | 1.14 (0.91 - 1.43) | 0.251 |
| Q3 | 1.90 (1.51 - 2.39) | < 0.001 | 1.33 (1.08 - 1.64) | 0.008 | 1.27 (1.03 - 1.57) | 0.026 |
| Q4 | 3.28 (2.64 - 4.06) | < 0.001 | 2.11 (1.70 - 2.62) | < 0.001 | 1.92 (1.52 - 2.41) | < 0.001 |
| P trend | < 0.001 | < 0.001 | < 0.001 | |||
| CVD mortality | ||||||
| RDW | 1.22 (1.14 - 1.31) | < 0.001 | 1.22 (1.14 - 1.30) | < 0.001 | 1.21 (1.13 - 1.30) | < 0.001 |
| Q1 | 1.00 (Reference) | 1.00 (Reference) | 1.00 (Reference) | |||
| Q2 | 1.16 (0.82 - 1.63) | 0.401 | 0.90 (0.64 - 1.28) | 0.563 | 0.89 (0.62 - 1.28) | 0.520 |
| Q3 | 1.81 (1.17 - 2.79) | 0.007 | 1.23 (0.81 - 1.87) | 0.333 | 1.16 (0.77 - 1.76) | 0.471 |
| Q4 | 3.80 (2.60 - 5.56) | < 0.001 | 2.33 (1.57 - 3.47) | < 0.001 | 2.17 (1.46 - 3.25) | < 0.001 |
| P trend | < 0.001 | < 0.001 | < 0.001 | |||
| All-cause mortality | ||||||
| RAR | 2.03 (1.69 - 2.43) | < 0.001 | 2.08 (1.77 - 2.45) | < 0.001 | 1.90 (1.61 - 2.26) | < 0.001 |
| Q1 | 1.00 (Reference) | 1.00 (Reference) | 1.00 (Reference) | |||
| Q2 | 1.71 (1.35 - 2.17) | < 0.001 | 1.33 (1.03 - 1.70) | 0.027 | 1.29 (1.01 - 1.65) | 0.044 |
| Q3 | 2.05 (1.58 - 2.67) | < 0.001 | 1.46 (1.14 - 1.88) | 0.003 | 1.44 (1.12 - 1.86) | 0.004 |
| Q4 | 3.05 (2.43 - 3.83) | < 0.001 | 2.50 (1.92 - 3.26) | < 0.001 | 2.22 (1.69 - 2.91) | < 0.001 |
| P trend | < 0.001 | < 0.001 | < 0.001 | |||
| CVD mortality | ||||||
| RAR | 2.30 (1.83 - 2.90) | < 0.001 | 2.42 (1.99 - 2.94) | < 0.001 | 2.30 (1.87 - 2.82) | < 0.001 |
| Q1 | 1.00 (Reference) | 1.00 (Reference) | 1.00 (Reference) | |||
| Q2 | 1.81 (1.21 - 2.69) | 0.004 | 1.38 (0.93 - 2.06) | 0.113 | 1.31 (0.88 - 1.94) | 0.178 |
| Q3 | 2.02 (1.25 - 3.26) | 0.004 | 1.41 (0.85 - 2.36) | 0.185 | 1.38 (0.82 - 2.33) | 0.220 |
| Q4 | 4.18 (2.80 - 6.25) | < 0.001 | 3.34 (2.16 - 5.17) | < 0.001 | 3.00 (1.96 - 4.59) | < 0.001 |
| P trend | < 0.001 | < 0.001 | < 0.001 | |||
a Q1 - Q4 indicate quartiles of RDW or RAR, as defined in Tables 1 and 2. Model 1: Crude model. Model 2: Adjusted for sex, age, and race. Model 3: Adjusted for sex, age, race, marital status, education, smoking, physical activity, PIR, hypertension, diabetes, hyperlipidemia, cancer, and FIB-4. P for trend was calculated using the median value of each quartile as a continuous variable. Abbreviations: HR, hazard ratio; CI, confidence interval; CVD, cardiovascular disease; RDW, red cell distribution width; RAR, red blood cell distribution width-to-albumin ratio; PIR, poverty-income ratio; FIB-4, Fibrosis-4 Index
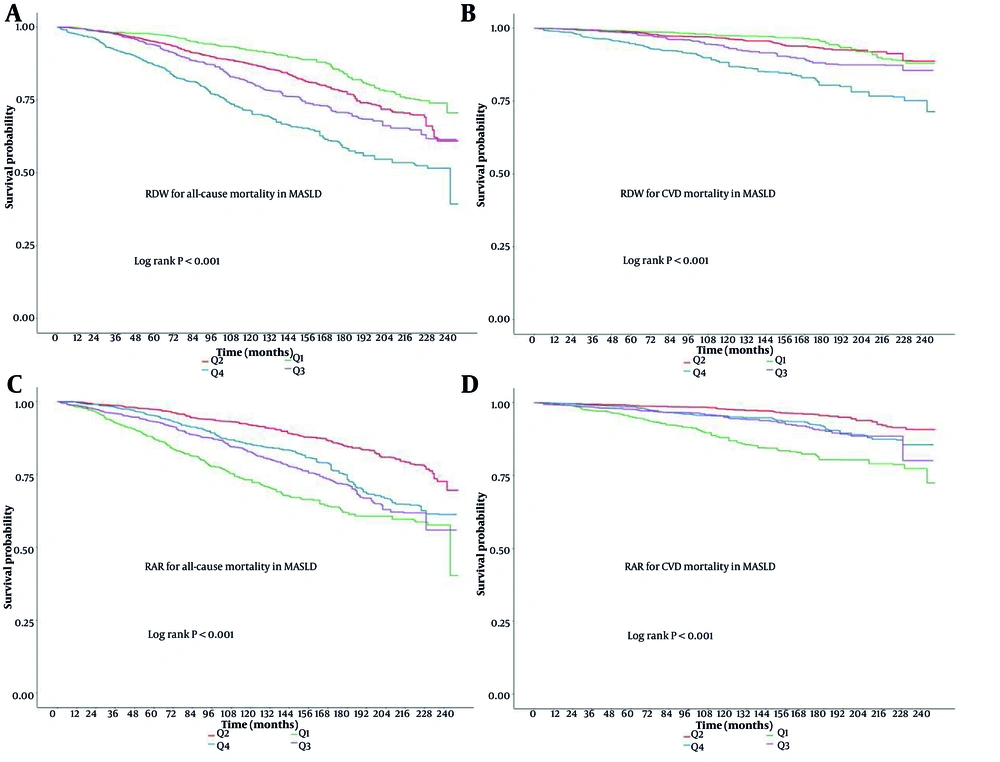
Figure 2.
Kaplan-Meier curves for the incidence of all-cause mortality and CVD mortality by RDW and RAR quartiles in MASLD participants. A, Cumulative incidence of all-cause mortality by RDW quartile in MASLD participants; B, cumulative incidence of CVD mortality by RDW quartile in MASLD participants; C, cumulative incidence of all-cause mortality by RAR quartile in MASLD participants; D, cumulative incidence of CVD mortality by RAR quartile in MASLD participants. Group comparisons were performed using the log-rank test. P-values for trend across quartiles are reported in the main text. Abbreviations: RDW, red cell distribution width; RAR, red blood cell distribution width-to-albumin ratio; CVD, cardiovascular disease; MASLD, metabolic dysfunction-associated steatotic liver disease.
4.3. Associations of RDW and RAR With All-Cause and CVD Mortality in Patients With NAFLD
During follow-up, 1180 patients with NAFLD died from all causes, and 395 died from CVD (Tables S2 and S3 in Supplementary File). Consistent with the findings in MASLD, Kaplan-Meier curves showed that patients with NAFLD in higher RDW and RAR quartiles had significantly increased risks of both all-cause and CVD mortality (log-rank P < 0.001; Figure 3). Cox regression analyses further confirmed these associations (Table 4). RDW and RAR, analyzed as continuous variables, were significantly associated with elevated risks of all-cause and CVD mortality in the unadjusted model (Model 1), and these associations persisted in the fully adjusted model (Model 3). In sensitivity analyses in which RDW and RAR were treated as categorical variables (quartiles), participants in the highest quartile (Q4) continued to show a statistically significant increase in mortality risk compared with those in the lowest quartile (Q1) for both all-cause and CVD mortality (all P < 0.05). Significant dose-response trends were observed across quartiles (P-trend < 0.001). Although the hazard ratios were attenuated in Model 3, all associations remained statistically significant.
Table 4.
Hazard Ratios (95% Confidence Intervals) for All-Cause and CVD Mortality According to RDW and RAR Quartiles Among Participants with NAFLD a
| Variables | Model 1 | Model 2 | Model 3 | |||
|---|---|---|---|---|---|---|
| HR (95% CI) | P-Value | HR (95% CI) | P-Value | HR (95% CI) | P-Value | |
| All-cause mortality | ||||||
| RDW | 1.20 (1.13 - 1.27) | < 0.001 | 1.20 (1.14 - 1.27) | < 0.001 | 1.19 (1.12 - 1.27) | < 0.001 |
| Q1 | 1.00 (Reference) | 1.00 (Reference) | 1.00 (Reference) | |||
| Q2 | 1.47 (1.19 - 1.81) | < 0.001 | 1.16 (0.93 - 1.44) | 0.185 | 1.15 (0.92 - 1.43) | 0.217 |
| Q3 | 1.91 (1.52 - 2.39) | < 0.001 | 1.33 (1.08 - 1.64) | 0.007 | 1.28 (1.04 - 1.58) | 0.022 |
| Q4 | 3.36 (2.70 - 4.17) | < 0.001 | 2.16 (1.74 - 2.68) | < 0.001 | 1.95 (1.55 - 2.45) | < 0.001 |
| P trend | < 0.001 | < 0.001 | < 0.001 | |||
| CVD mortality | ||||||
| RDW | 1.21 (1.14 - 1.30) | < 0.001 | 1.22 (1.14 - 1.29) | < 0.001 | 1.21 (1.13 - 1.30) | < 0.001 |
| Q1 | 1.00 (Reference) | 1.00 (Reference) | 1.00 (Reference) | |||
| Q2 | 1.15 (0.81 - 1.62) | 0.431 | 0.89 (0.63 - 1.26) | 0.502 | 0.89 (0.62 - 1.26) | 0.500 |
| Q3 | 1.81 (1.18 - 2.79) | 0.007 | 1.22 (0.81 - 1.86) | 0.342 | 1.16 (0.77 - 1.75) | 0.485 |
| Q4 | 3.82 (2.61 - 5.57) | < 0.001 | 2.32 (1.57 - 3.44) | < 0.001 | 2.14 (1.44 - 3.19) | < 0.001 |
| P trend | < 0.001 | < 0.001 | < 0.001 | |||
| All-cause mortality | ||||||
| RAR | 1.93 (1.63 - 2.28) | < 0.001 | 2.07 (1.78 - 2.41) | < 0.001 | 1.91 (1.62 - 2.26) | < 0.001 |
| Q1 | 1.00 (Reference) | 1.00 (Reference) | 1.00 (Reference) | |||
| Q2 | 1.70 (1.35 - 2.15) | < 0.001 | 1.32 (1.03 - 1.69) | 0.028 | 1.26 (0.99 - 1.61) | 0.058 |
| Q3 | 2.04 (1.57 - 2.64) | < 0.001 | 1.45 (1.13 - 1.86) | 0.003 | 1.41 (1.09 - 1.81) | 0.009 |
| Q4 | 3.10 (2.47 - 3.88) | < 0.001 | 2.55 (1.96 - 3.31) | < 0.001 | 2.25 (1.72 - 2.94) | < 0.001 |
| P trend | < 0.001 | < 0.001 | < 0.001 | |||
| CVD mortality | ||||||
| RAR | 2.15 (1.75 - 2.64) | < 0.001 | 2.37 (1.96 - 2.86) | < 0.001 | 2.28 (1.87 - 2.79) | < 0.001 |
| Q1 | 1.00 (Reference) | 1.00 (Reference) | 1.00 (Reference) | |||
| Q2 | 1.81 (1.21 - 2.69) | 0.004 | 1.38 (0.93 - 2.06) | 0.113 | 1.31 (0.88 - 1.94) | 0.178 |
| Q3 | 2.02 (1.25 - 3.26) | 0.004 | 1.41 (0.85 - 2.36) | 0.185 | 1.38 (0.82 - 2.33) | 0.220 |
| Q4 | 4.18 (2.80 - 6.25) | < 0.001 | 3.34 (2.16 - 5.17) | < 0.001 | 3.00 (1.96 - 4.59) | < 0.001 |
| P trend | < 0.001 | < 0.001 | < 0.001 | |||
a Q1 - Q4 indicate quartiles of RDW or RAR, as defined in Tables 1 and 2. Model 1: Crude model. Model 2: Adjusted for sex, age, and race. Model 3: Adjusted for sex, age, race, marital status, education, smoking, physical activity, PIR, hypertension, diabetes, hyperlipidemia, cancer, and FIB-4. P for trend was calculated using the median value of each quartile as a continuous variable. Abbreviations: HR, hazard ratio; CI, confidence interval; CVD, cardiovascular disease; RDW, red cell distribution width; RAR, red blood cell distribution width-to-albumin ratio; NAFLD, non-alcoholic fatty liver disease; PIR, poverty-income ratio; FIB-4, Fibrosis-4 Index.
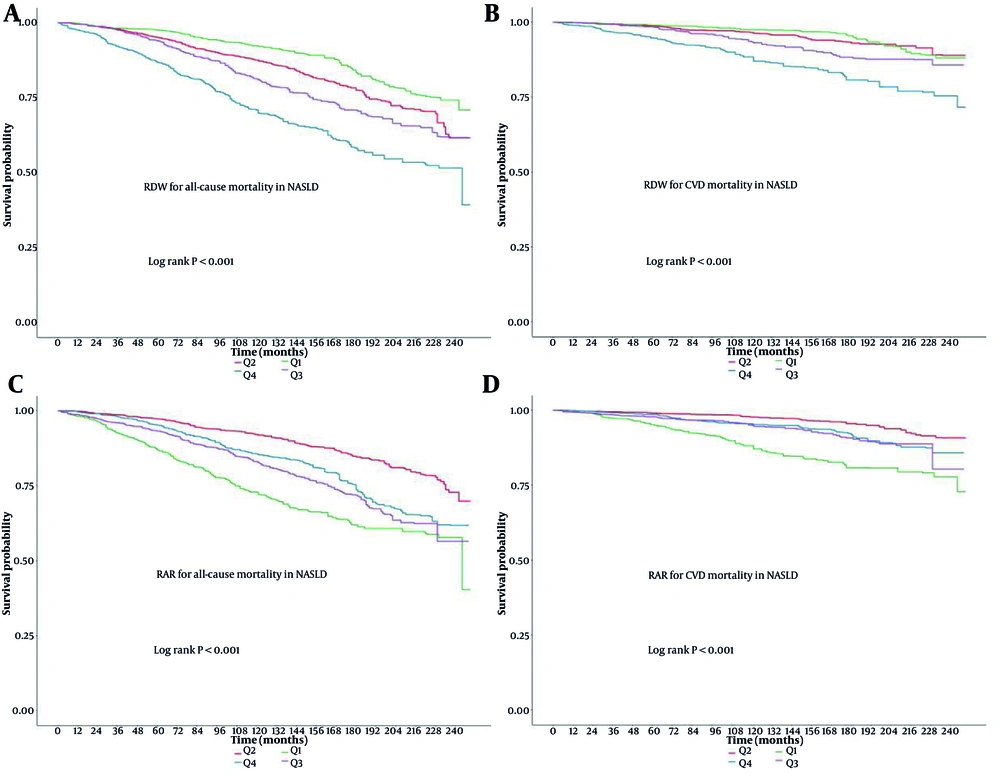
Figure 3.
Kaplan-Meier curves for the incidence of all-cause mortality and CVD mortality by RDW and RAR quartiles in NAFLD participants. A, Cumulative incidence of all-cause mortality by RDW quartile in NAFLD participants; B, cumulative incidence of CVD mortality by RDW quartile in NAFLD participants; C, cumulative incidence of all-cause mortality by RAR quartile in NAFLD participants; D, cumulative incidence of CVD mortality by RAR quartile in NAFLD participants. Group comparisons were performed using the log-rank test. P values for trend across quartiles are reported in the main text. Abbreviation: RDW, red cell distribution width; RAR, red blood cell distribution width-to-albumin ratio; CVD, cardiovascular disease; NAFLD, non-alcoholic fatty liver disease.
4.4. RCS Analyses of RDW and RAR With All-Cause and CVD Mortality in MASLD and NAFLD
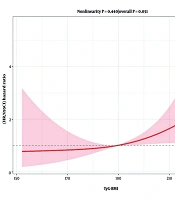
Restricted cubic spline analyses were performed to flexibly model and visualize the associations of RDW and RAR with all-cause and CVD mortality in patients with MASLD and NAFLD after adjustment for all covariates in Model 3. For all-cause mortality, the associations with both RDW and RAR were approximately linear in both the MASLD and NAFLD populations (P for nonlinearity: RDW in MASLD = 0.073, RAR in MASLD = 0.157, RDW in NAFLD = 0.051, and RAR in NAFLD = 0.136; Figure 4A and C and Figure 5A and C). In contrast, significant nonlinear relationships were observed for CVD mortality in both disease groups after adjustment for all covariates in Model 3. Specifically, the associations of RDW and RAR with CVD mortality were nonlinear in MASLD (P for nonlinearity: RDW = 0.005 and RAR = 0.004; Figure 4B and D) and in NAFLD (P for nonlinearity: RDW = 0.006 and RAR = 0.004; Figure 5B and D). To further characterize these nonlinear associations, threshold-effect analyses were conducted using segmented linear regression, and the reference values of the RCS curve were RDW = 13% and RAR = 3.097561%/g/dL. Table 5 shows that, for CVD mortality in MASLD, an inflection point was identified at RDW ≈ 15.6%. Below this threshold, RDW was positively associated with CVD mortality (HR = 1.39; 95% CI, 1.23 - 1.57; P < 0.001), whereas above 15.6%, no significant association was observed (HR = 0.80; 95% CI, 0.59 - 1.08; P = 0.139). Similarly, an inflection point for RAR was identified at approximately 4.08. Below 4.08, RAR was positively associated with CVD mortality (HR = 2.77; 95% CI, 1.99 - 3.86; P < 0.001), whereas no significant association was observed above this threshold (HR = 0.72; 95% CI, 0.31 - 1.65; P = 0.437) (Table 5). Comparable inflection points and threshold effects were observed in the NAFLD population (Table 6). For CVD mortality in NAFLD, an inflection point was identified at RDW ≈ 15.6%. Below this threshold, RDW was positively associated with CVD mortality (HR = 1.38; 95% CI, 1.23 - 1.56; P < 0.001), whereas no significant association was observed above 15.6%. For RAR, an inflection point was identified at approximately 4.08. Below 4.08, RAR was positively associated with CVD mortality (HR = 2.74; 95% CI, 1.97 - 3.81; P < 0.001), whereas no significant association was observed above this threshold (P = 0.467).
Table 5.
Threshold-Effect Analysis of RDW and RAR on CVD Mortality Among Participants with MASLD Using Piecewise Linear Regression a
| Variables and Model | HR (95% CI) | P-Value |
|---|---|---|
| RDW (Standard linear regression) | 1.17 (1.10 - 1.24) | < 0.001 |
| Two-piecewise linear regression | ||
| Inflection point = 15.6 | ||
| < 15.6 | 1.39 (1.23 - 1.57) | < 0.001 |
| ≥ 15.6 | 0.80 (0.59 - 1.08) | 0.139 |
| P for likelihood test | < 0.001 | |
| RAR (Standard linear regression) | 1.94 (1.64 - 2.31) | < 0.001 |
| Two-piecewise linear regression | ||
| Inflection point = 4.08 | ||
| < 4.08 | 2.77 (1.99 - 3.86) | < 0.001 |
| ≥ 4.08 | 0.72 (0.31 - 1.65) | 0.437 |
| P for likelihood test | 0.002 |
a Models were adjusted for sex, age, race, marital status, education, smoking, physical activity, PIR, hypertension, diabetes, hyperlipidemia, cancer, and FIB-4. Initial nonlinearity assessment used restricted cubic spline curves with knots placed at the weighted 5th, 35th, 65th, and 95th percentiles and the reference set at the median. Abbreviation: HR, hazard ratio; CI, confidence interval; RDW, red cell distribution width; RAR, red blood cell distribution width-to-albumin ratio; MASLD, metabolic dysfunction-associated steatotic liver disease.
Table 6.
Threshold-Effect Analysis of RDW and RAR on CVD Mortality Among Participants with NAFLD Using Piecewise Linear Regression a
| Variables and Model | HR (95% CI) | P-Value |
|---|---|---|
| RDW (Standard linear regression) | 1.17 (1.10 - 1.23) | < 0.001 |
| Two-piecewise linear regression | ||
| Inflection point = 15.6 | ||
| < 15.6 | 1.38 (1.22 - 1.56) | < 0.001 |
| > 15.6 | 0.81 (0.60 - 1.10) | 0.183 |
| P for likelihood test | < 0.001 | |
| RAR (Standard linear regression) | 1.93 (1.62 - 2.29) | < 0.001 |
| Two-piecewise linear regression | ||
| Inflection point = 4.08 | ||
| < 4.08 | 2.74 (1.97 - 3.81) | < 0.001 |
| > 4.08 | 0.74 (0.33 - 1.66) | 0.467 |
| P for likelihood test | 0.003 |
a Models were adjusted for sex, age, race, marital status, education, smoking, physical activity, PIR, hypertension, diabetes, hyperlipidemia, cancer, and FIB-4. Initial nonlinearity assessment used restricted cubic spline curves with knots placed at the weighted 5th, 35th, 65th, and 95th percentiles and the reference set at the median. Abbreviation: HR, hazard ratio; CI, confidence interval; RDW, red cell distribution width; RAR, red blood cell distribution width-to-albumin ratio; NAFLD, non-alcoholic fatty liver disease.
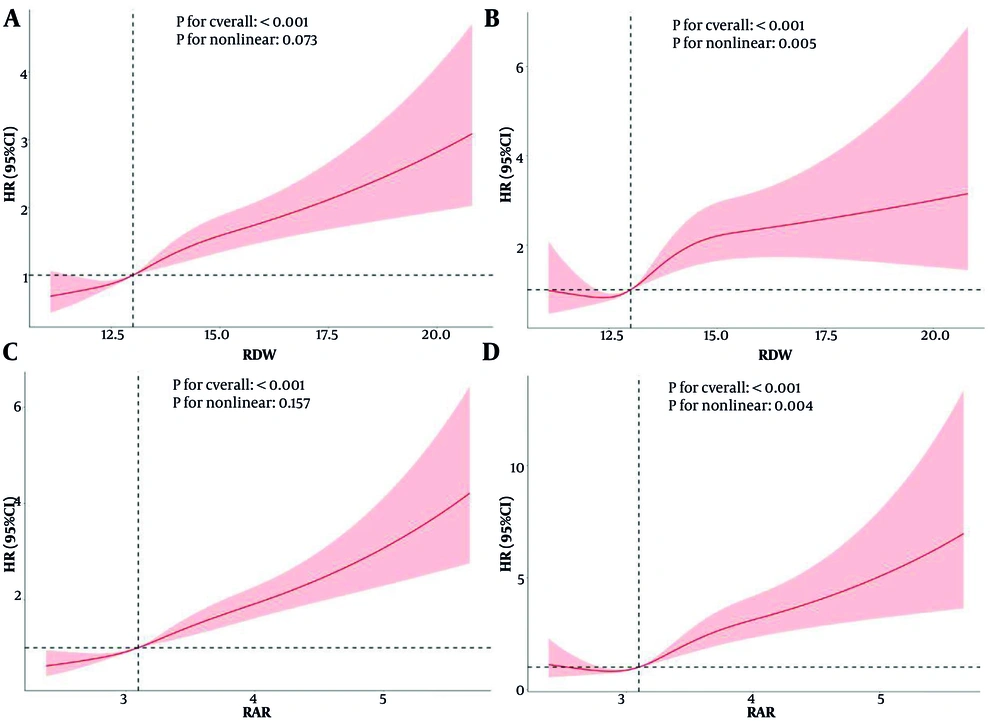
Figure 4.
Restricted cubic spline curves for the association of RDW and RAR with all-cause and CVD mortality among participants with MASLD. A, RDW and all-cause mortality; B, RDW and CVD mortality; C, RAR and all-cause mortality; D, RAR and CVD mortality. Abbreviations: RDW, red cell distribution width; RAR, red blood cell distribution width-to-albumin ratio; CVD, cardiovascular disease; MASLD, metabolic dysfunction-associated steatotic liver disease; PIR, poverty-income ratio; FIB-4, Fibrosis-4 index.
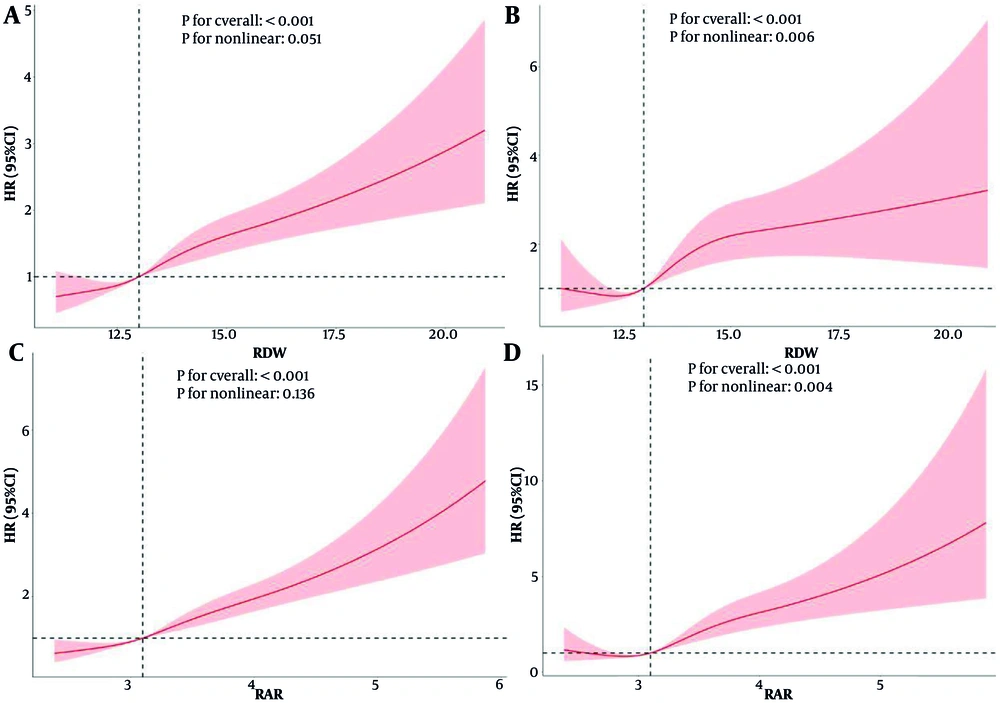
Figure 5.
Restricted cubic spline curves for the association of RDW and RAR with all-cause and CVD mortality among participants with NAFLD. A, RDW and all-cause mortality; B, RDW and CVD mortality; C, RAR and all-cause mortality; D, RAR and CVD mortality. Models were adjusted for sex, age, race, marital status, education, smoking, physical activity, PIR, hypertension, diabetes, hyperlipidemia, cancer, and FIB-4. The reference value for each exposure was set at the median. Knots were placed at the weighted 5th, 35th, 65th, and 95th percentiles. Abbreviations: RDW, red cell distribution width; RAR, red blood cell distribution width-to-albumin ratio; CVD, cardiovascular disease; NAFLD, non-alcoholic fatty liver disease; PIR, poverty-income ratio; FIB-4, Fibrosis-4 Index.
4.5. Subgroup Analysis
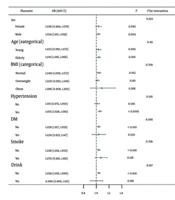
To evaluate the consistency of the associations between RDW/RAR and mortality across demographic and clinical subgroups, stratified analyses were performed by age, sex, race, educational level, family PIR, and FIB-4 Index in both the MASLD and NAFLD populations (Figures S1-S2 in Supplementary File). Elevated RDW and RAR levels remained significantly associated with increased risks of both all-cause and CVD mortality in most subgroups. For example, in the MASLD population, each unit increase in RDW was associated with a higher risk of all-cause mortality across all age strata: HR = 1.19 (95% CI, 1.03 - 1.38) for age < 45 years, HR = 1.35 (95% CI, 1.21 - 1.51) for age 45 - 60 years, and HR = 1.17 (95% CI, 1.10 - 1.25) for age ≥ 60 years (P for interaction = 0.047). Similar consistent trends were observed for RAR and for CVD mortality outcomes in both the MASLD and NAFLD cohorts. Importantly, no significant interactions were found between RDW/RAR and sex, educational level, or PIR in relation to mortality risk (all P-interaction > 0.05), indicating that these associations were largely independent of these factors. Overall, these subgroup analyses suggest that the positive associations of RDW and RAR with all-cause and CVD mortality are generally consistent across a wide range of demographic and clinical characteristics in individuals with NAFLD/MASLD.
4.6. Sensitivity Analysis
To assess the robustness of the primary findings, 5 sensitivity analyses were performed. First, BMI and daily energy intake were additionally adjusted for in the fully adjusted model (Model 3). The associations of RDW and RAR with all-cause and CVD mortality remained statistically significant, with HRs and CIs similar to those in the main analysis (Tables S8 and S9 in Supplementary File). Second, Cox regression analyses were repeated using the complete-case dataset before multiple imputation to evaluate the potential impact of missing data (Table S1 in Supplementary File). The results were consistent with those obtained from the imputed dataset, indicating that the findings were not substantially influenced by the imputation process (Tables S10 and S11 in Supplementary File). Third, after excluding extreme values of RDW/RAR, the associations of RDW/RAR with all-cause and CVD mortality remained after adjustment for potential confounders (Tables S12 and S13 in Supplementary File). Fourth, after censoring participants who died within the first 2 years of follow-up (n = 141 among patients with MASLD and n = 143 among patients with NAFLD), robust associations between RDW/RAR and mortality outcomes remained in multivariable-adjusted models (Tables S14 and S15 in Supplementary File). Finally, after excluding individuals with missing baseline cardiovascular disease data (4381 retained among patients with MASLD and 4503 retained among patients with NAFLD), the associations of RDW/RAR with all-cause and CVD mortality persisted in fully adjusted models (Tables S16 and S17 in Supplementary File).
5. Discussion
This nationwide cohort study of adults demonstrated that, among patients with MASLD, higher RDW and RAR levels were significantly associated with increased risks of all-cause and CVD mortality, even after multivariable adjustment. Furthermore, Cox regression analyses showed a clear dose-response trend across RDW and RAR quartiles (P-trend < 0.001), with the highest quartile exhibiting a significantly elevated mortality risk compared with the lowest quartile. To our knowledge, this study is the first to systematically examine the independent associations of RDW and RAR with all-cause and cardiovascular mortality in a large, nationally representative MASLD population. These findings suggest that RDW and RAR may serve as useful biomarkers for stratifying mortality risk in this patient population.
MASLD is associated with a range of adverse clinical consequences that ultimately increase mortality, including severe liver inflammation and fibrosis, metabolic and cardiovascular diseases, and extrahepatic cancers (29). Previous studies have shown that patients with the homozygous PNPLA3 rs738409 GG variant have an increased risk of disease progression, liver-related events, and hepatocellular carcinoma, which is associated with more aggressive histological patterns, such as portal fibrosis, and increased oxidative stress (29). Existing studies have shown that RDW, as a marker of inflammation and oxidative stress, has predictive value for cardiovascular diseases, liver diseases, and all-cause mortality (7, 30, 31) and is also related to the severity of various liver diseases, including hepatitis B, hepatitis C, NAFLD, primary biliary cholangitis, and hepatocellular carcinoma (7). RDW alterations are driven by numerous pathological conditions, most notably chronic injury to the liver parenchyma (7). In MASLD, insulin resistance, dyslipidemia, and chronic low-grade inflammation are hallmark features (24). Excess adipose tissue releases proinflammatory cytokines and activates immune cells, promoting hepatic inflammation and fibrosis progression (5, 32). Liver tissue injury can induce a long-term inflammatory response and further increase circulating proinflammatory factor concentrations. These cytokines are known to interfere with and inhibit erythropoietin production and iron supply, thereby increasing RDW.
Serum albumin, the most abundant circulating protein, reflects nutritional status and inflammatory response and has anti-inflammatory, antioxidant, anticoagulant, and colloidal osmotic properties (15). Previous studies have shown that lower serum albumin levels are closely associated with higher risks of morbidity and mortality (15). In contrast, RDW sensitively reflects inflammation, oxidative stress, and cellular heterogeneity. RAR concurrently captures 2 key pathological factors: inflammation-driven metabolic disorder and nutritional reserve deficiency. This approach addresses the limitations of a single indicator and provides a more precise depiction of a patient’s overall pathophysiological state. Growing evidence indicates that RAR is a valuable indicator of adverse clinical outcomes in diverse illnesses, including diabetes (14), heart failure (33), chronic kidney disease (34), and burn surgery (12). Specifically, in liver diseases, RAR reflects both nutritional status and inflammatory response, facilitating the assessment of disease severity and prognostic risk (35). Liver diseases are frequently associated with malnutrition and chronic inflammation, and elevated RAR levels are associated with a higher risk of metabolic syndrome. High RDW combined with low albumin indicates systemic inflammation with malnutrition, suggesting more severe metabolic dysfunction. This study systematically verified the independent associations of RDW and RAR with both all-cause and CVD mortality in a large population with MASLD. Notably, these associations remained robust after adjustment for key sociodemographic and clinical confounders, particularly in the fully adjusted model. These findings suggest that both RDW and RAR are independently and significantly associated with increased risks of all-cause and CVD mortality in individuals with MASLD, highlighting their potential value as prognostic biomarkers in this high-risk population.
The RCS curves showed a nonlinear upward trend for both RDW and RAR in relation to mortality risk. Segmented linear regression identified risk inflection points at RDW ≈ 15.6% and RAR ≈ 4.08. Subgroup analysis revealed significant interactions (P < 0.05) between RDW/RAR levels and variables including race, age, and the FIB-4 Index, whereas interactions with educational level, sex, and family PIR were not significant (P > 0.05). Forest plots showed that the association between RDW/RAR and mortality risk remained consistent across most subgroups, supporting their potential as broadly applicable prognostic markers. RDW and albumin can be influenced by subclinical or preclinical disease, raising the possibility of reverse causality. Sensitivity analyses were conducted to address reverse causality. First, deaths occurring within the first 2 years of follow-up were excluded, a standard approach to reduce reverse causality, and the associations remained statistically significant. Second, excluding participants with baseline major CVD did not materially change the estimates. Although reverse causality cannot be completely excluded, these sensitivity analyses suggest that it does not fully account for the observed associations.
Although this study demonstrated significant associations of RDW/RAR with all-cause and CVD mortality in patients with MASLD, the underlying biological mechanisms driving these relationships remain incompletely elucidated. This study has several limitations. First, its observational design cannot establish causality. Second, MASLD was defined based on the US-FLI, which may have led to misclassification. Although numerous confounding factors were adjusted for, residual confounding, such as unmeasured genetic and behavioral factors, may still have affected the results. Third, because a weighted competing-risk model corresponding to the present model was not available, all individuals who did not die from CVD were classified as the nondeceased group, and the Cox regression results for CVD deaths did not involve a competing-risk model. Moreover, the specificity of the study population limits the generalizability of the conclusions. Based on these limitations, future studies should: 1) conduct prospective cohort studies to dynamically monitor the association between longitudinal changes in RDW/RAR and clinical outcomes; 2) perform interventional studies to explore whether improving nutritional status or reducing inflammation can lower RDW/RAR and ultimately improve prognosis; 3) integrate RDW/RAR into existing risk prediction models, such as FIB-4, and validate their incremental prognostic value in independent cohorts; and 4) use multiomics data to further elucidate the specific molecular pathways through which RDW/RAR may influence the prognosis of MASLD.
5.1. Conclusions
Both RDW and RAR were independently associated with increased risks of all-cause and CVD mortality in patients with NAFLD/MASLD. RCS analysis revealed positive dose-response relationships, with higher RDW and RAR values correlating with progressively greater mortality risks. These findings suggest that RDW and RAR may serve as valuable prognostic biomarkers for clinical outcomes in NAFLD/MASLD populations.