1. Background
Tuberculosis (TB) remains a substantial global health challenge with enduring epidemiological importance. Surveillance data compiled by the World Health Organization (2023) indicate that in 2022, the global TB burden comprised approximately 10.6 million incident cases and an estimated 1.3 million attributable deaths (1). First-line antituberculosis therapy, typically consisting of isoniazid, rifampicin, pyrazinamide, and ethambutol, is highly effective. However, antituberculosis drug-induced liver injury (DILI) associated with this regimen is among the most common and serious adverse events during treatment (2, 3). DILI can lead to treatment interruption, regimen modification, and even acute liver failure, representing a major obstacle to successful TB management (4, 5).
The pathogenesis of antituberculosis DILI is complex and involves the direct toxicity of drugs and their metabolites, mitochondrial injury, oxidative stress, inflammatory signaling, and idiosyncratic immune responses. Experimental studies of other forms of DILI, including work implicating miR-155 and miR-122 pathways, further support the relevance of inflammatory and hepatocellular stress responses in DILI biology (6, 7). Host factors, including advanced age, female sex, malnutrition, HIV co-infection, and polymorphisms in specific drug-metabolizing enzymes, are well established as increasing susceptibility to DILI (8, 9). Despite this knowledge, a critical gap persists in clinical practice: the lack of a readily accessible, simple, and effective biomarker that can be obtained before treatment initiation to accurately identify patients at high risk for DILI, thereby enabling more proactive risk management and intervention (10).
Serum albumin and prealbumin are routinely measured indicators that provide an integrated assessment of nutritional and inflammatory status. Although serum albumin and prealbumin are nonspecific markers of systemic inflammation and nutritional status, they offer an integrated reflection of the liver’s synthetic reserve and detoxification capacity, which may be critical for metabolizing antituberculosis drugs (6, 11). Prealbumin, also known as transthyretin, has a shorter half-life and is more sensitive to recent changes in nutritional status and acute inflammatory responses (12, 13). Accumulating evidence indicates that baseline hypoalbuminemia and hypoprealbuminemia are significantly associated with adverse outcomes across a spectrum of diseases (14, 15). In the context of TB, patients are often malnourished because of chronic wasting and a persistent inflammatory state (16, 17). This compromised condition may impair the liver’s capacity to tolerate and repair drug-induced toxicity, potentially increasing the risk of DILI.
In recent years, a growing number of studies have investigated the association between nutritional markers and antituberculosis DILI (18-20). However, most existing research has treated albumin or prealbumin as continuous variables or categorized them using conventional reference ranges, such as albumin < 3.5 g/dL, without examining potential nonlinear, threshold-dependent relationships with DILI risk. Furthermore, a systematic evaluation of their combined predictive value is lacking. Questions also remain as to whether the association between hypoalbuminemia or hypoprealbuminemia and DILI risk is consistent across different clinical subgroups, such as people living with HIV and elderly patients, and whether it interacts with other known risk factors (21, 22).
Advances in precision medicine underscore the importance of developing integrated, multifactorial clinical prediction models to optimize patient management (23, 24). Although efforts have been made to construct DILI risk prediction models incorporating clinical features (25, 26), the combined evaluation of 2 easily obtainable markers, serum albumin and prealbumin, may provide preliminary evidence for improving risk stratification in this setting.
2. Objectives
To address these knowledge gaps, we conducted this retrospective cohort study to evaluate the association between pretreatment serum albumin and prealbumin levels and the incidence of DILI during the intensive phase of antituberculosis therapy. The specific objectives were: 1) to examine the independent association between baseline albumin and prealbumin levels, treated as continuous variables, and DILI risk; 2) to explore the dose-response relationship and identify candidate thresholds within this cohort; 3) to assess the consistency of this association across predefined clinical subgroups; and 4) to evaluate the predictive performance of these markers individually and in combination and to derive a simple integrated risk score for internal assessment. We hypothesized that lower pretreatment serum albumin and prealbumin levels would be associated with a higher risk of antituberculosis DILI, with possible threshold effects, and that their predictive performance would be broadly consistent across patient subgroups. The findings of this single-center retrospective study were intended to clarify whether these routine laboratory markers provide prognostic information related to DILI risk in this cohort and to inform the design of future validation studies.
3. Methods
3.1. Study Design and Setting
This was a single-center retrospective cohort study conducted at The Fifth People’s Hospital of Ganzhou. The source population comprised all consecutive adult patients recorded in the hospital electronic medical record system with a diagnosis of active tuberculosis and initiation of standard first-line antituberculosis therapy between January 1, 2021, and June 30, 2025. The study aimed to investigate whether baseline serum albumin and prealbumin levels measured before treatment initiation were associated with the subsequent development of DILI during the 8-week intensive phase. The study used historical clinical data extracted from the hospital’s integrated electronic medical record, laboratory information, and pharmacy systems. All diagnostic, treatment, and monitoring procedures, including the timing of scheduled and additional liver function testing, were performed as part of routine care and were not influenced by the present study.
3.2. Study Population Selection and Inclusion/Exclusion Criteria
3.2.1. Study Population Identification
The initial study population was identified through a systematic search of the hospital electronic medical record database using International Classification of Diseases, Tenth Revision codes for active tuberculosis (A15.0 - A19.9). These records were then linked to the pharmacy system to identify all consecutive adults who initiated a standard first-line antituberculosis regimen during the study period. Screening was performed sequentially according to prespecified inclusion and exclusion criteria, and the number excluded at each step was recorded to ensure transparent reporting of cohort assembly. The search and screening process was conducted independently by 2 trained clinical researchers using a standardized screening protocol; discrepancies were resolved by consensus.
3.2.2. Inclusion Criteria
Patients were included if they met the following criteria:
1) Age ≥ 18 years at the time of tuberculosis diagnosis and treatment initiation.
2) A confirmed diagnosis of active tuberculosis, either pulmonary or extrapulmonary, based on a combination of clinical symptoms, radiological findings, and/or microbiological confirmation.
3) Initiation of standard first-line antituberculosis therapy according to national guidelines.
4) Availability of serum albumin and/or prealbumin measurement results within 14 days before or on the day of antituberculosis treatment initiation (Day 0).
5) Availability of baseline liver function tests within the same timeframe as the albumin/prealbumin measurement, including, at minimum, alanine aminotransferase (ALT), to permit characterization of pretreatment hepatic status and adjustment for baseline biochemical abnormalities in subsequent analyses.
6) Availability of follow-up liver function monitoring data for at least the first 8 weeks, representing the intensive phase of treatment, according to the center’s standard monitoring protocol.
3.2.3. Exclusion Criteria
Patients were excluded if they met any of the following criteria:
1) Pre-existing chronic liver disease of any etiology, including cirrhosis, chronic hepatitis B virus infection, chronic hepatitis C virus infection, alcoholic liver disease, nonalcoholic fatty liver disease with significant fibrosis or cirrhosis, autoimmune hepatitis, or Wilson disease. During cohort assembly, 55 patients were excluded for liver-related reasons, including chronic hepatitis B virus infection (n = 24), chronic hepatitis C virus infection (n = 6), alcoholic liver disease (n = 8), nonalcoholic fatty liver disease with significant fibrosis/cirrhosis (n = 9), cirrhosis of other or unspecified etiology (n = 5), autoimmune hepatitis (n = 2), and Wilson disease (n = 1).
2) Concurrent use of other medications with known or potential hepatotoxicity at the time of antituberculosis treatment initiation or within the first week of treatment, such as phenytoin, valproate, certain antibiotics, statins, and nonsteroidal anti-inflammatory drugs, except for medications deemed essential for life-threatening conditions with no safer alternatives.
3) A documented history of previous antituberculosis treatment within the preceding 6 months to avoid potential confounding from prior drug exposure or drug resistance.
4) Treatment with a nonstandard or second-line antituberculosis regimen from the outset because of documented or suspected drug resistance.
5) Incomplete or missing key clinical or laboratory data that precluded accurate classification of exposure or outcome status, including missing baseline exposure measurements or unavailable follow-up liver function data required for DILI ascertainment. In contrast, patients with complete exposure and outcome ascertainment but limited missingness in selected baseline covariates were retained in the cohort and addressed analytically using complete-case analysis in the primary model and multiple imputation in sensitivity analyses.
6) Loss to follow-up or discontinuation of treatment for nonhepatotoxicity reasons before completing the 8-week intensive phase. During cohort assembly, the number of patients excluded for each criterion was recorded, including missing baseline exposure data, pre-existing chronic liver disease, incomplete follow-up liver function data during the intensive phase, concomitant hepatotoxic medications, and early treatment discontinuation or loss to follow-up for nonhepatotoxicity reasons. A detailed accounting of these exclusions is provided in Figure 1 and the Results section.
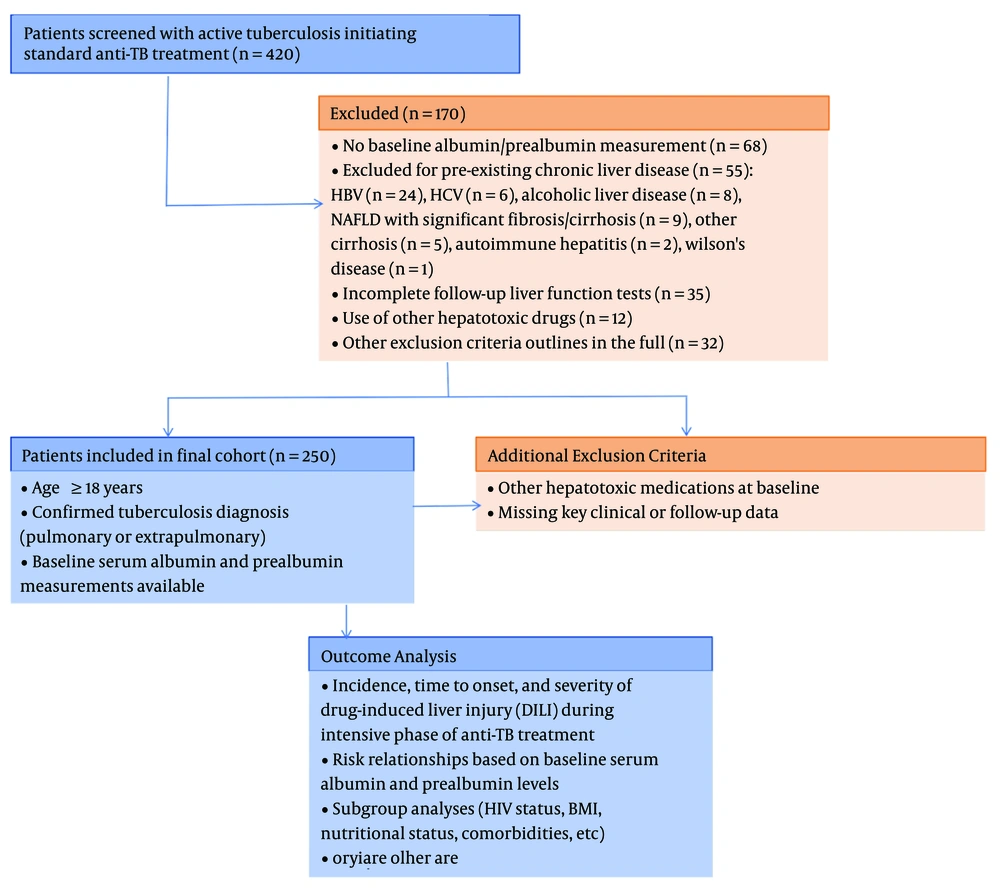
Figure 1.
Cohort assembly and patient selection for the retrospective analysis of antituberculosis drug-induced liver injury (DILI) during the 8-week intensive phase of first-line antituberculosis therapy. The diagram shows the source population, sequential application of inclusion and exclusion criteria, and the absolute number of patients excluded at each step, including missing baseline exposure data, pre-existing chronic liver disease, incomplete follow-up liver function data, early nonhepatotoxic treatment discontinuation/loss to follow-up, and concomitant hepatotoxic medications.
3.3. Data Collection Procedures and Variable Definitions
3.3.1. Data Sources and Extraction
All data were retrospectively collected from 3 primary sources within the hospital information system: 1) the electronic medical record system, which contained demographic data, clinical notes, diagnoses, and treatment orders; 2) the laboratory information management system, which contained serum biochemistry, hematology, and microbiology results; and 3) the pharmacy information system, which contained detailed records of antituberculosis and concomitant medication dispensing. These routinely collected clinical data constituted the retrospective electronic medical record-based cohort analyzed in this study. Data extraction was performed using a standardized, prepiloted electronic case report form developed using Research Electronic Data Capture tools. Data abstraction was performed by 2 independent researchers who were blinded to the study hypothesis regarding the primary exposure-outcome relationship to minimize information bias. Discrepancies in data abstraction were resolved by consensus or by consultation with a third senior researcher.
3.3.2. Baseline Demographic and Clinical Variables
The following baseline variables were collected for each patient:
Demographics: Age, calculated from the date of birth to the treatment initiation date; sex; self-reported ethnicity; height; weight measured closest to treatment initiation; and calculated Body Mass Index (BMI).
Clinical characteristics: Type of tuberculosis, classified as pulmonary or extrapulmonary, with the specific site if extrapulmonary; sputum smear microscopy status; presence of cavitation on chest radiography or computed tomography; and tuberculin skin test or interferon-gamma release assay results, if available.
Comorbidities: Documented history of HIV infection, including CD4+ T-cell count and viral load, if available; diabetes mellitus; hypertension; chronic kidney disease; cardiovascular disease; chronic obstructive pulmonary disease; and other significant chronic illnesses.
Medication history: Use of hepatoprotective agents, such as glutathione, silymarin, and ursodeoxycholic acid, initiated before or concurrently with antituberculosis treatment, as well as other chronic medications.
3.3.3. Exposure Variables: Serum Albumin and Prealbumin
The primary exposure variables were serum albumin and prealbumin levels measured closest to the start of antituberculosis treatment, with a maximum allowable window of 14 days before Day 0. Serum albumin was measured using the bromocresol green method on automated chemistry analyzers, and prealbumin (transthyretin) was measured using immunoturbidimetric assays. Both assays were performed in the hospital central laboratory, which participates in national external quality assessment programs. The specific analyzer models, assay kits, and reference ranges were recorded. Exposure values were recorded as continuous variables in their original units, g/dL for albumin and mg/dL for prealbumin, and these units were used consistently throughout the text, tables, and figures. For analytical purposes, exposure variables were also categorized based on clinically relevant cutoffs and thresholds identified through statistical analysis.
3.3.4. Covariates and Potential Confounders
The following laboratory parameters measured within the same baseline period were collected as potential confounders:
Liver function tests: ALT, aspartate aminotransferase (AST), total bilirubin, direct bilirubin, alkaline phosphatase, gamma-glutamyl transferase, and albumin. Among these, baseline ALT was treated as the principal marker of pretreatment liver biochemical abnormality and was incorporated into the main adjusted models as a prespecified covariate to reduce confounding by pre-existing or subclinical hepatic injury.
Renal function: Serum creatinine and estimated glomerular filtration rate.
Hematological parameters: Hemoglobin, white blood cell count, absolute lymphocyte count, and platelet count.
Inflammatory markers: C-reactive protein and erythrocyte sedimentation rate, when available.
Nutritional markers: In addition to albumin and prealbumin, total cholesterol and triglycerides were recorded, if available.
3.3.5. Treatment Variables
Detailed antituberculosis treatment information was collected:
Regimen components: Specific drugs used in the intensive phase, including isoniazid, rifampicin, pyrazinamide, and ethambutol.
Dosing: Daily dose of each drug in milligrams and the dose adjusted by body weight in mg/kg.
Treatment modifications: Any documented changes to the initial regimen during the intensive phase, including dose reductions, drug substitutions, or temporary or permanent discontinuations, along with the reasons and dates.
3.3.6. Outcome Assessment and Definitions
The primary outcome was the development of antituberculosis DILI during the 8-week intensive phase of treatment. Drug-induced liver injury was defined according to prespecified criteria adapted from the American Thoracic Society statement and applied uniformly during retrospective review. Hepatocellular injury was defined as ALT > 3 × the upper limit of normal (ULN) in the presence of symptoms suggestive of hepatitis, such as fatigue, nausea, vomiting, right upper quadrant pain, jaundice, or dark urine, or ALT > 5 × ULN regardless of symptoms. Cholestatic/mixed injury was defined as total bilirubin > 2 × ULN together with elevated alkaline phosphatase, with or without symptoms. The ULN was defined according to the single central laboratory reference ranges applied throughout the study period, with no sex-specific ULN used in the primary analyses (ALT 40 U/L, AST 40 U/L, and total bilirubin 21 μmol/L).
To improve operational consistency, all potential DILI events were first identified from laboratory records showing liver test abnormalities during follow-up and then reviewed against contemporaneous clinical notes for symptoms and treatment context. Outcome adjudication was performed retrospectively by 2 physicians trained in the study definitions who were not involved in the original exposure data abstraction; disagreements were resolved through discussion with a senior hepatology or tuberculosis clinician. The adjudication process applied the same prespecified biochemical and symptom criteria to all included patients.
The date of DILI onset was defined as the date of the blood draw for the first liver function test meeting the study criteria. For patients who first met criteria at the first scheduled postbaseline test, the midpoint between treatment initiation and the test date was used as an approximation in time-to-event analyses. Secondary outcomes included time to DILI onset, DILI severity, and treatment disruption. Drug-induced liver injury severity was graded as mild (ALT 3 - 5 × ULN), moderate (ALT 5 - 10 × ULN), or severe (ALT > 10 × ULN, bilirubin > 2 × ULN with international normalized ratio > 1.5, or clinical evidence of hepatic failure). Treatment disruption was defined as any documented modification of the antituberculosis regimen attributable to suspected or confirmed DILI, including dose reduction, temporary interruption, permanent discontinuation, or regimen substitution.
3.3.7. Follow-Up and Monitoring Schedule
The standard monitoring protocol at the study center included liver function testing at baseline, within 14 days before treatment initiation or on Day 0, and scheduled follow-up testing at approximately weeks 2, 4, and 8 during the intensive phase for all patients. In routine practice, additional liver function tests could be ordered before scheduled visits when prompted by new symptoms suggestive of possible liver injury or DILI, such as nausea, vomiting, anorexia, fatigue, jaundice, dark urine, or right upper quadrant pain; newly detected laboratory abnormalities on interim testing; or the treating clinician’s judgment based on the patient’s overall clinical condition.
Patients perceived by treating clinicians to be at higher risk of antituberculosis DILI, including those with low baseline albumin or prealbumin, HIV co-infection, older age, low BMI, or mildly abnormal baseline liver enzymes, could undergo closer laboratory surveillance than the minimum scheduled protocol as part of routine care. To address the possibility of differential detection, we extracted all available liver function test results within the 8-week follow-up window, regardless of whether they arose from scheduled or additional testing, and we explicitly acknowledge in the Discussion that more intensive monitoring in clinically high-risk patients may have increased the likelihood of earlier event detection.
Patients were considered to have completed follow-up when they either met DILI criteria or reached the end of the 8-week intensive phase without DILI. For time-to-event analyses, follow-up time was calculated from treatment initiation (Day 0) to the earliest of the following: first DILI event, end of the 8-week intensive phase, death, loss to follow-up, permanent discontinuation of antituberculosis therapy for nonhepatotoxicity reasons, or major regimen change unrelated to DILI. Patients who discontinued treatment or were lost to follow-up for nonhepatotoxicity reasons before 8 weeks and lacked sufficient follow-up liver function data for reliable outcome ascertainment were excluded during cohort assembly, as described above.
3.4. Statistical Analysis
To characterize the potentially nonlinear relationship between nutritional protein levels and liver injury in this exploratory cohort, we used restricted cubic splines and several sensitivity analyses, including bootstrap internal validation. Continuous variables were assessed for normality using the Shapiro-Wilk test and histogram inspection and were summarized as mean ± SD for normally distributed variables or median with interquartile range for nonnormally distributed variables. Categorical variables were presented as frequencies and percentages. Participants were stratified by outcome (DILI vs. non-DILI). Group comparisons used independent t tests, Mann-Whitney U tests, chi-square tests, or Fisher exact tests, as appropriate. Standardized mean differences were calculated, with values > 0.25 considered indicative of meaningful imbalance.
The association of baseline albumin/prealbumin, as continuous variables, with DILI was assessed using univariable logistic regression, with odds ratios and 95% confidence intervals. Multivariable logistic regression models were constructed to estimate the independent association of baseline albumin and prealbumin with DILI risk. Covariates were selected a priori based on clinical knowledge and prior literature identifying established risk factors for hepatotoxicity in patients with TB, including age, sex, BMI, HIV status, diabetes, and baseline ALT. In the primary adjusted models, baseline ALT was entered as a dichotomous variable (> 40 U/L vs. ≤ 40 U/L) to reflect clinically interpretable pretreatment biochemical abnormality relative to the study laboratory ULN. Additional sensitivity analyses excluded patients with baseline ALT > 2 × ULN to evaluate whether the main associations persisted after removing individuals with more pronounced pretreatment liver test abnormalities. We distinguished confounders, such as age, BMI, HIV, and diabetes, from potential mediators, such as treatment modifications, and deliberately excluded variables that could lie on the causal pathway, such as early regimen changes due to subclinical liver enzyme elevations, to avoid overadjustment. Regimen components were not entered into the primary models because the cohort was restricted to patients initiating standard first-line antituberculosis therapy, resulting in limited between-patient variation in core regimen composition. Baseline dose and weight-adjusted dose variables were examined descriptively but were not included in the primary models because dosing largely followed standard protocolized prescribing and subsequent dose changes could lie on the pathway from early biochemical abnormality to observed DILI-related treatment modification. The primary multivariable analysis used a complete-case approach, including only patients with nonmissing values for these prespecified covariates. We also quantified missingness for each key baseline variable and compared the proportion of missing data between patients who did and did not develop DILI. Variance inflation factors were examined, with values > 5 indicating collinearity.
Nonlinear exposure-outcome relationships were evaluated using multivariable logistic regression models with restricted cubic spline terms for albumin and prealbumin. For each exposure, 4 knots were prespecified and placed at the 5th, 35th, 65th, and 95th percentiles of the exposure distribution. In the primary spline models, the reference value was set at 4.0 g/dL for serum albumin and 25 mg/dL for serum prealbumin, representing clinically common values within the normal range and facilitating interpretation of relative risk across lower concentrations.
The spline models were adjusted for the same prespecified baseline covariates as the main multivariable analyses: Age, sex, BMI, HIV status, diabetes, baseline ALT, and prophylactic hepatoprotective agent use. Nonlinearity was assessed using likelihood ratio tests comparing the full spline model with a corresponding model containing only the linear term for the same exposure. We acknowledged that early mild liver enzyme elevations might prompt more frequent monitoring or treatment modifications, potentially creating reverse causality or detection bias; therefore, these variables were not included as primary covariates in the spline models but were explored in sensitivity analyses.
Candidate thresholds were first identified in a data-driven manner from the fitted spline curves as the region in which the slope of the risk curve changed most prominently and were then examined using segmented logistic regression models with a single change point selected by grid search that minimized model deviance. Because the identified inflection points were estimated from the present dataset, they were interpreted as internally derived thresholds rather than fully prespecified clinical cut points.
Time-to-event analyses used Kaplan-Meier curves with log-rank tests and multivariable Cox proportional hazards models, adjusted for the same prespecified baseline confounders as the main logistic models. Time at risk accrued from treatment initiation (Day 0) until the first DILI event or censoring. Censoring occurred at the earliest of completion of the 8-week intensive phase without DILI, death before DILI, loss to follow-up, permanent discontinuation of antituberculosis therapy for nonhepatotoxicity reasons, or major treatment modification unrelated to suspected hepatotoxicity. The proportional hazards assumption was evaluated using Schoenfeld residual tests and visual inspection of log-minus-log survival plots; no material violations were identified for the primary exposures or the overall adjusted models.
Subgroup analyses for age, sex, BMI, HIV, baseline ALT, and diabetes were performed using multivariable logistic models within each stratum, with interaction terms used to test effect modification. A P value for interaction < 0.10 was considered suggestive of interaction.
Predictive performance was evaluated using receiver operating characteristic analysis with area under the curve and 95% confidence intervals for binary outcomes and the Harrell concordance index for time-to-event models. Sensitivity, specificity, positive predictive value, negative predictive value, and accuracy were calculated at the optimal Youden-index cut point, where applicable.
A simple clinical risk score was derived in several prespecified steps. First, candidate predictors were selected from the multivariable models and restricted to baseline variables that were routinely available before treatment initiation and remained independently associated with DILI in adjusted analyses. Second, continuous predictors were handled as follows: albumin and prealbumin were converted into binary indicators using the internally derived but clinically rounded thresholds identified from the spline/segmented regression analyses (< 3.5 g/dL and < 20 mg/dL, respectively), age was dichotomized at > 50 years based on model performance and clinical interpretability, and baseline ALT was dichotomized at > 40 U/L, the study laboratory ULN. Third, a parsimonious model including these candidate binary predictors was fitted, and integer points were assigned by dividing each regression coefficient by the smallest retained coefficient and rounding to the nearest integer.
Because the final coefficients were of similar magnitude, each retained predictor contributed 1 point in the simplified score. Total scores were then grouped into low-, intermediate-, and high-risk categories according to observed event rates and Kaplan-Meier separation. To reduce overfitting, internal validation was performed using bootstrap resampling with 1000 replicates. We estimated optimism-corrected discrimination and calibration measures from the bootstrap samples. We did not apply formal penalization or uniform shrinkage to the final integer score because the study aimed to produce a simple bedside tool and the number of retained predictors was deliberately restricted. Nevertheless, to address potential overfitting, we used bootstrap resampling to estimate model optimism and report optimism-corrected discrimination and calibration measures.
Sensitivity analyses included 1) a stricter DILI definition (ALT > 5 × ULN); 2) exclusion of patients with baseline ALT > 2 × ULN; 3) multiple imputation for missing covariate data using chained equations, with 20 imputed datasets and 20 iterations per dataset under the missing-at-random assumption; 4) reanalysis using alternative clinically plausible cut points around the internally estimated thresholds, including albumin 3.4 and 3.6 g/dL and prealbumin 19 and 21 mg/dL; 5) propensity score matching at a 1:1 ratio with a caliper of 0.2 SD; 6) inverse probability treatment weighting; 7) bootstrap internal validation with 1000 replicates; and 8) competing-risk analysis using Fine-Gray subdistribution hazard models. The imputation model included DILI status, age, sex, BMI, HIV status, diabetes, albumin, prealbumin, ALT, AST, total bilirubin, hepatoprotectant use, and weight-based dosing variables, and pooled estimates were combined using Rubin rules. In the competing-risk framework, events that could preclude subsequent observation of DILI were treated as competing events, including death before DILI, permanent discontinuation of antituberculosis treatment for nonhepatotoxicity reasons, loss to follow-up before completion of the intensive phase, and major regimen modification unrelated to suspected hepatotoxicity. Fine-Gray models were adjusted for the same baseline covariates as the main Cox models, and subdistribution hazard ratios were compared with the cause-specific Cox estimates.
With 250 participants and an expected DILI incidence of approximately 20%, the study had 80% power, with a 2-sided α of 0.05, to detect an OR ≥ 2.0 for a binary exposure with approximately 40% prevalence.
Key R packages included tidyverse, rms, survival/survminer, pROC, MatchIt, and mice. Analytic code is available upon reasonable request.
4. Results
4.1. Patient Screening, Inclusion Flow, and Baseline Clinical Characteristics
We initially identified 420 consecutive adult patients with active tuberculosis (ICD-10 codes A15.0 - A19.9) who initiated standard first-line antituberculosis therapy between January 1, 2021, and June 30, 2025. Prespecified inclusion and exclusion criteria were then applied sequentially. Of the 420 screened patients, 68 (16.2%) were excluded because baseline serum albumin and/or prealbumin measurements were unavailable within the prespecified window; 55 (13.1%) were excluded because of pre-existing chronic liver disease, including chronic hepatitis B virus infection (n = 24), chronic hepatitis C virus infection (n = 6), alcoholic liver disease (n = 8), nonalcoholic fatty liver disease with significant fibrosis/cirrhosis (n = 9), cirrhosis of other or unspecified etiology (n = 5), autoimmune hepatitis (n = 2), and Wilson disease (n = 1); 35 (8.3%) were excluded because adequate liver function follow-up data during the 8-week intensive phase were unavailable, including patients who were lost to follow-up or discontinued treatment early for nonhepatotoxicity reasons; and 12 (2.9%) were excluded because of concomitant use of other known hepatotoxic medications at treatment initiation. After these sequential exclusions, 250 patients were included in the final analytic cohort, corresponding to a retention rate of 59.5%. For these patients, all available liver function test results obtained during the 8-week intensive phase, including both scheduled tests and additional clinically triggered tests, were extracted for outcome ascertainment. The full cohort assembly process and exclusion counts are shown in Figure 1.
Table 1 presents the baseline characteristics of the final study population, stratified by DILI occurrence. The demographic profile of the entire cohort was as follows: mean age 45.6 ± 15.2 years (range, 18 - 82 years); 155 patients (62.0%) were male; and mean BMI was 20.3 ± 3.1 kg/m2, with 88 patients (35.2%) having a BMI < 18.5 kg/m2, indicating a notable proportion with malnutrition. Tuberculosis-related clinical features included pulmonary TB in 210 patients (84.0%), extrapulmonary TB in 40 patients (16.0%), sputum smear positivity in 180 patients (72.0%), and cavitary disease on imaging in 85 patients (34.0%). Comorbidities included HIV co-infection in 45 patients (18.0%), diabetes mellitus in 42 patients (16.8%), and hypertension in 55 patients (22.0%).
Table 1.
Baseline Characteristics of the Final Analytic Cohort (N = 250), Stratified by Antituberculosis Drug-Induced Liver Injury Status During the 8-Week Intensive Phase of First-Line Antituberculosis Therapy a
| Variables | Total Population (n = 250) | DILI Group (n = 48) | Non-DILI Group (n = 202) | P Value | Standardized Mean Difference |
|---|---|---|---|---|---|
| Demographics | |||||
| Age (y) | 45.6 ± 15.2 | 50.1 ± 14.8 | 44.5 ± 15.1 | 0.021 | 0.38 |
| Male | 155 (62.0) | 28 (58.3) | 127 (62.9) | 0.560 | 0.09 |
| BMI (kg/m2) | 20.3 ± 3.1 | 19.5 ± 3.0 | 20.6 ± 3.1 | 0.032 | 0.36 |
| Clinical features | |||||
| Pulmonary TB | 210 (84.0) | 40 (83.3) | 170 (84.2) | 0.883 | 0.02 |
| Extrapulmonary TB | 40 (16.0) | 8 (16.7) | 32 (15.8) | 0.883 | 0.02 |
| Smear positive | 180 (72.0) | 38 (79.2) | 142 (70.3) | 0.210 | 0.21 |
| Cavitary disease | 85 (34.0) | 20 (41.7) | 65 (32.2) | 0.212 | 0.20 |
| Comorbidities | |||||
| HIV co-infection | 45 (18.0) | 12 (25.0) | 33 (16.3) | 0.150 | 0.22 |
| Diabetes mellitus | 42 (16.8) | 10 (20.8) | 32 (15.8) | 0.403 | 0.13 |
| Hypertension | 55 (22.0) | 13 (27.1) | 42 (20.8) | 0.346 | 0.15 |
| Baseline laboratory variables | |||||
| Albumin (g/dL) | 3.8 ± 0.6 | 3.2 ± 0.5 | 3.9 ± 0.6 | < 0.001 | 1.17 |
| Prealbumin (mg/dL) | 23.4 ± 7.2 | 18.1 ± 6.5 | 24.6 ± 7.0 | < 0.001 | 0.93 |
| ALT (U/L) | 28.2 ± 11.8 | 32.1 ± 15.2 | 27.2 ± 10.8 | 0.018 | 0.37 |
| AST (U/L) | 31.5 ± 13.4 | 36.8 ± 16.1 | 30.2 ± 12.3 | 0.002 | 0.46 |
| Total bilirubin (μmol/L) | 12.4 ± 5.6 | 13.8 ± 6.2 | 12.0 ± 5.4 | 0.041 | 0.31 |
| ALP (U/L) | 85.3 ± 32.1 | 92.4 ± 36.8 | 83.5 ± 30.8 | 0.087 | 0.26 |
| Hemoglobin (g/dL) | 11.8 ± 2.1 | 10.9 ± 2.0 | 12.0 ± 2.1 | 0.001 | 0.53 |
| Total lymphocyte count (×109/L) | 1.45 ± 0.62 | 1.18 ± 0.58 | 1.51 ± 0.62 | < 0.001 | 0.53 |
| Treatment details | |||||
| 2HRZE/4HR regimen | 210 (84.0) | 42 (87.5) | 168 (83.2) | 0.462 | 0.12 |
| Another first-line regimen | 40 (16.0) | 6 (12.5) | 34 (16.8) | 0.462 | 0.12 |
| Initial daily isoniazid dose (mg/kg) | 4.9 ± 0.8 | 5.0 ± 0.9 | 4.9 ± 0.8 | 0.421 | 0.12 |
| Initial daily rifampicin dose (mg/kg) | 9.8 ± 1.5 | 9.9 ± 1.6 | 9.8 ± 1.5 | 0.678 | 0.06 |
| Hepatoprotectant use | 68 (27.2) | 16 (33.3) | 52 (25.7) | 0.289 | 0.17 |
a Abbreviations: ALP, alkaline phosphatase; ALT, alanine aminotransferase; AST, aspartate aminotransferase; BMI, Body Mass Index; DILI, drug-induced liver injury; HRZE, isoniazid, rifampicin, pyrazinamide, and ethambutol; TB, tuberculosis. Data are presented as mean ± SD or No. (%). P values were calculated using t tests for continuous variables and chi-square tests for categorical variables. A standardized mean difference > 0.25 indicates meaningful imbalance.
Missingness in the final analytic cohort was low for most baseline variables. By design, serum albumin, prealbumin, and baseline ALT were complete for all 250 included patients because these variables were part of the inclusion criteria. Missing data remained for several covariates, including AST in 6 patients (2.4%), total bilirubin in 5 patients (2.0%), BMI in 8 patients (3.2%), HIV status in 7 patients (2.8%), weight-based dosing variables in 12 patients (4.8%), and hepatoprotectant use in 9 patients (3.6%). Overall, 22 patients (8.8%) had at least 1 missing covariate required for the primary multivariable model and were therefore excluded from the complete-case primary adjusted analysis, leaving 228 patients for that model. Missingness proportions were broadly similar between the DILI and non-DILI groups; for example, missing BMI data were observed in 2 of 48 patients (4.2%) vs. 6 of 202 patients (3.0%), missing HIV status in 2 of 48 patients (4.2%) vs. 5 of 202 patients (2.5%), missing weight-based dosing variables in 3 of 48 patients (6.3%) vs. 9 of 202 patients (4.5%), and missing hepatoprotectant data in 2 of 48 patients (4.2%) vs. 7 of 202 patients (3.5%), respectively. No clinically meaningful differential missingness by DILI status was observed.
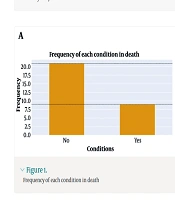
Comparative analyses showed significant baseline differences between the DILI (n = 48) and non-DILI (n = 202) groups. Patients who developed DILI were older (50.1 ± 14.8 vs. 44.5 ± 15.1 years; P = 0.021) and had a lower BMI (19.5 ± 3.0 vs. 20.6 ± 3.1 kg/m2; P = 0.032). The most notable disparities were observed in the primary exposure variables: serum albumin (3.2 ± 0.5 vs. 3.9 ± 0.6 g/dL; P < 0.001) and prealbumin (18.1 ± 6.5 vs. 24.6 ± 7.0 mg/dL; P < 0.001) levels were substantially lower in the DILI group, as depicted in Figure 2. Baseline liver enzymes and bilirubin were modestly but significantly higher in patients who later developed DILI, whereas markers of systemic nutrition and inflammation (hemoglobin and total lymphocyte count) were significantly lower (all P < 0.05). This pattern suggests that the observed excess risk may reflect not only poorer nutritional status but also a greater burden of pretreatment biochemical vulnerability or subclinical hepatic stress. No significant intergroup differences were observed in TB characteristics or comorbidities.
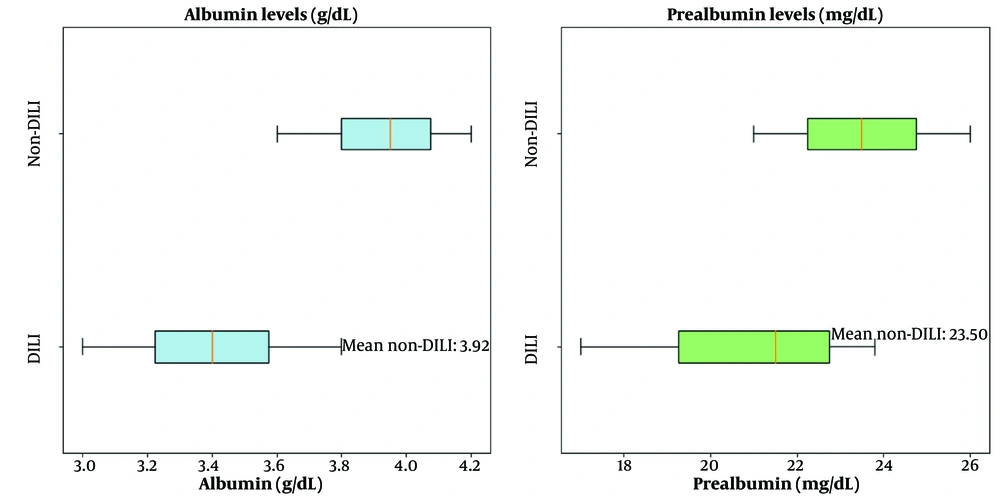
Figure 2.
Baseline serum albumin (g/dL) and prealbumin (mg/dL) levels in the final analytic cohort (n = 250), stratified by antituberculosis drug-induced liver injury (DILI) status during the 8-week intensive phase. Group comparisons were performed using the appropriate parametric or nonparametric tests as specified in Methods.
Standardized mean differences confirmed albumin (standardized mean difference = 1.17) and prealbumin (standardized mean difference = 0.93) as the variables with the greatest between-group imbalance. To enhance transparency regarding potential selection bias, all exclusions were summarized with absolute counts and reasons rather than only broad category labels. Among liver-related exclusions, chronic hepatitis B virus infection accounted for the largest proportion, followed by nonalcoholic fatty liver disease with significant fibrosis/cirrhosis and alcoholic liver disease.
4.2. Association of Baseline Serum Albumin and Prealbumin Levels With Drug-Induced Liver Injury Risk
During monitoring over the 8-week intensive treatment phase, 48 DILI events were observed in the entire cohort, resulting in a cumulative incidence of 19.2% (48/250). To quantify the relationship between baseline nutritional markers and DILI risk, we first performed univariable logistic regression. Results in Table 2 show that, when analyzed as a continuous variable, each 1 g/dL decrease in serum albumin was associated with a crude OR of 2.80 (95% CI, 1.85 - 4.24; P < 0.001) for developing DILI. Similarly, each 10 mg/dL decrease in serum prealbumin corresponded to a crude OR of 1.62 (95% CI, 1.25 - 2.10; P < 0.001). These findings indicate that, without adjustment for other factors, lower albumin and prealbumin levels were associated with a significantly increased risk of DILI.
Table 2.
Univariable and Multivariable Logistic Regression Analyses of Baseline Serum Albumin and Prealbumin in Relation to Antituberculosis Drug-Induced Liver Injury a
| Variables | Unadjusted OR (95% CI) | P Value | Adjusted OR (95% CI) | P Value | VIF |
|---|---|---|---|---|---|
| Primary predictors | |||||
| Albumin (per 1 g/dL decrease) | 2.80 (1.85 - 4.24) | < 0.001 | 1.85 (1.32 - 2.59) | < 0.001 | 1.42 |
| Prealbumin (per 10 mg/dL decrease) | 1.62 (1.25 - 2.10) | < 0.001 | 1.42 (1.11 - 1.82) | 0.005 | 1.38 |
| Demographic factors | |||||
| Age (per 10-year increase) | 1.32 (1.08 - 1.61) | 0.006 | 1.25 (1.01 - 1.55) | 0.043 | 1.21 |
| Male gender (vs. female) | 0.84 (0.45 - 1.58) | 0.586 | 0.92 (0.48 - 1.77) | 0.802 | 1.15 |
| BMI (per 1 kg/m2 decrease) | 1.15 (1.02 - 1.30) | 0.023 | 1.10 (0.96 - 1.25) | 0.165 | 1.32 |
| Clinical factors | |||||
| HIV co-infection (yes vs. no) | 1.73 (0.82 - 3.64) | 0.151 | 1.65 (0.92 - 2.96) | 0.094 | 1.18 |
| Diabetes mellitus (yes vs. no) | 1.41 (0.64 - 3.11) | 0.394 | 1.32 (0.72 - 2.42) | 0.369 | 1.12 |
| Cavitary TB (yes vs. no) | 1.50 (0.79 - 2.84) | 0.214 | 1.42 (0.88 - 2.28) | 0.152 | 1.24 |
| Baseline laboratory variables | |||||
| ALT > 40 U/L (vs. ≤ 40 U/L) | 2.25 (1.23 - 4.11) | 0.008 | 1.98 (1.12 - 3.49) | 0.019 | 1.26 |
| AST > 40 U/L (vs. ≤ 40 U/L) | 2.08 (1.14 - 3.78) | 0.016 | 1.85 (0.97 - 3.52) | 0.062 | 1.45 |
| Hemoglobin (per 1 g/dL decrease) | 1.32 (1.11 - 1.57) | 0.002 | 1.18 (0.99 - 1.41) | 0.068 | 1.52 |
| Treatment factors | |||||
| Higher isoniazid dose (> 5 mg/kg) | 1.45 (0.79 - 2.66) | 0.230 | 1.32 (0.75 - 2.32) | 0.337 | 1.28 |
| Higher rifampicin dose (> 10 mg/kg) | 1.28 (0.70 - 2.35) | 0.418 | 1.21 (0.68 - 2.15) | 0.516 | 1.31 |
| Use of hepatoprotectants | 0.70 (0.36 - 1.36) | 0.290 | 0.76 (0.42 - 1.38) | 0.366 | 1.17 |
a Abbreviations: ALP, alkaline phosphatase; ALT, alanine aminotransferase; AST, aspartate aminotransferase; BMI, Body Mass Index; DILI, drug-induced liver injury; HRZE, isoniazid, rifampicin, pyrazinamide, and ethambutol; TB, tuberculosis. Adjusted models included age, sex, BMI, HIV status, diabetes, baseline ALT, and prophylactic hepatoprotective agent use.
To control for potential confounding, a multivariable logistic regression model was constructed. Covariates were prespecified on the basis of clinical knowledge and evidence from the literature as known risk factors for DILI, including age, sex, BMI, HIV status, diabetes, baseline ALT, and prophylactic hepatoprotective agent use. Variables likely to be mediators or to be influenced by early subclinical liver enzyme changes, such as treatment dose modifications, temporary interruptions, or early discontinuations, were intentionally excluded to prevent overadjustment. The primary adjusted analysis used a complete-case dataset of 228 patients with no missing values across these prespecified covariates.
After adjustment for these confounders, each 1 g/dL decrease in serum albumin was associated with an adjusted OR of 1.85 (95% CI, 1.32 - 2.59; P < 0.001) for DILI risk, and each 10 mg/dL decrease in serum prealbumin yielded an adjusted OR of 1.42 (95% CI, 1.11 - 1.82; P = 0.005). Although the effect sizes were attenuated compared with the univariable analysis, the associations remained statistically significant, confirming albumin and prealbumin as independent predictors of DILI risk, separate from factors such as age and baseline liver function. The model also confirmed advanced age (adjusted OR = 1.25 per 10-year increase) and elevated baseline ALT (> 40 U/L vs. ≤ 40 U/L; adjusted OR = 1.98) as independent risk factors for DILI. Variance inflation factors for all variables were well below 5, indicating no severe multicollinearity. Core first-line regimen composition showed little variation across the analytic cohort; therefore, treatment-modification variables were treated as postbaseline process variables rather than baseline confounders.
4.3. Nonlinearity and Key Clinical Risk Cutoffs
Because clinical decision-making often relies on interpretable cutoff values, we further investigated whether nonlinear threshold effects existed between albumin/prealbumin and DILI risk using adjusted restricted cubic spline models. For both exposures, 4 knots were placed at the 5th, 35th, 65th, and 95th percentiles of the observed distribution, with 4.0 g/dL for albumin and 25 mg/dL for prealbumin specified as reference values. These models were adjusted for age, sex, BMI, HIV status, diabetes, baseline ALT, and prophylactic hepatoprotective agent use.
Figure 3A presents the adjusted spline curve for serum albumin. The curve was relatively flat at higher albumin concentrations but became markedly steeper below approximately 3.5 g/dL, indicating a sharp increase in DILI risk at lower concentrations. The likelihood ratio test for nonlinearity was significant (P-nonlinearity = 0.008). Figure 3B shows a similar pattern for serum prealbumin, with a prominent change in slope below approximately 20 mg/dL (P-nonlinearity = 0.022). These inflection regions were identified from the fitted spline curves and then formally evaluated using segmented logistic regression.
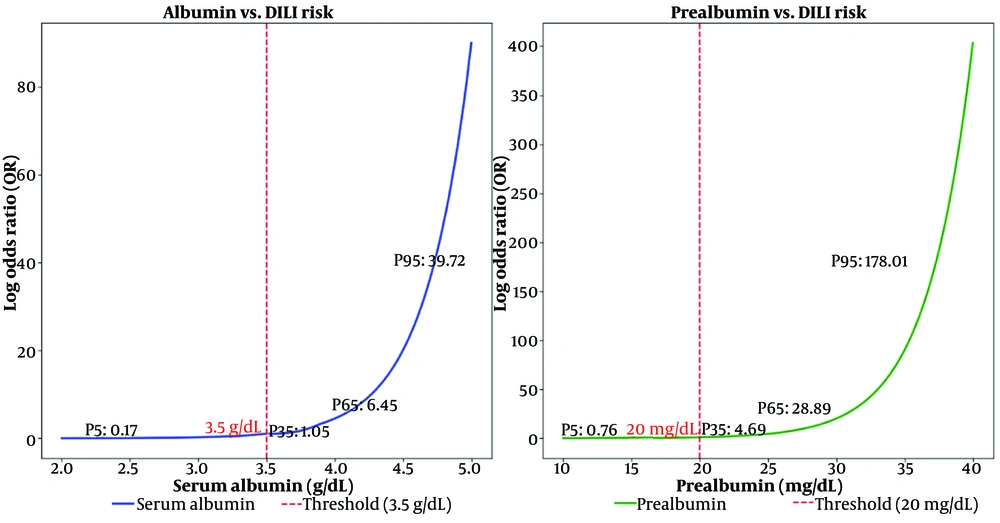
Figure 3.
Adjusted restricted cubic spline models for the association of baseline serum albumin (A) and prealbumin (B) with antituberculosis drug-induced liver injury (DILI) risk. Four knots were placed at the 5th, 35th, 65th, and 95th percentiles of each exposure distribution. Reference values were set at 4.0 g/dL for albumin and 25 mg/dL for prealbumin. Models were adjusted for age, sex, Body Mass Index (BMI), HIV status, diabetes, baseline alanine aminotransferase (ALT), and prophylactic hepatoprotective agent use.
To estimate these inflection points more formally, segmented logistic regression models with a single candidate change point were fitted for each exposure. Using a grid search to minimize model deviance, the internally estimated optimal change points were 3.48 g/dL for serum albumin and 19.5 mg/dL for serum prealbumin. These values were therefore data-driven estimates derived from the present cohort rather than strictly prespecified thresholds. For clinical interpretability and consistency with commonly used laboratory cutoffs, we rounded these internally estimated values to 3.5 g/dL and 20 mg/dL, respectively, for subsequent categorical risk-stratification analyses.
Table 3 details the epidemiological characteristics of DILI across subgroups stratified by these thresholds. The stratification revealed a clear risk gradient. By albumin level, among 42 patients with serum albumin < 3.0 g/dL, 20 developed DILI, yielding a high incidence of 47.6% and a relative risk of 7.45 (95% CI, 4.21 - 13.18) compared with the > 4.0 g/dL reference group. Among the 69 patients with albumin 3.0 - 3.5 g/dL, DILI incidence was 23.2%, with a relative risk of 3.63. In contrast, only 7.4% of the 54 patients with albumin > 4.0 g/dL developed DILI. By prealbumin level, a similar pattern emerged. The < 15 mg/dL subgroup had an incidence of 47.4%, with a relative risk of 6.82, and the 15 - 20 mg/dL subgroup had an incidence of 25.5%, with a relative risk of 3.66. In combined stratification, the results were more striking. Among the 58 patients meeting both criteria, albumin < 3.5 g/dL and prealbumin < 20 mg/dL, DILI incidence increased to 44.8%, with a relative risk of 8.91 (95% CI, 5.12 - 15.52) compared with the group in which both indicators were normal.
Table 3.
Drug-Induced Liver Injury Incidence and Characteristics Stratified by Albumin and Prealbumin Thresholds a
| Stratifications | No. | DILI Cases | DILI Incidence | Relative Risk (95% CI) | Time to DILI Onset (d) | Severe DILI Cases | Treatment Interruption |
|---|---|---|---|---|---|---|---|
| By albumin | |||||||
| < 3.0 g/dL | 42 | 20 | 47.6 | 7.45 (4.21 - 13.18) | 22.5 ± 8.2 | 6 (30.0) | 12 (60.0) |
| 3.0 - 3.5 g/dL | 69 | 16 | 23.2 | 3.63 (2.02 - 6.52) | 29.8 ± 10.5 | 3 (18.8) | 6 (37.5) |
| 3.5 - 4.0 g/dL | 85 | 8 | 9.4 | 1.47 (0.71 - 3.04) | 36.4 ± 12.8 | 1 (12.5) | 2 (25.0) |
| > 4.0 g/dL | 54 | 4 | 7.4 | Reference | 42.6 ± 15.3 | 0 (0.0) | 0 (0.0) |
| By prealbumin | |||||||
| < 15 mg/dL | 38 | 18 | 47.4 | 6.82 (3.88 - 12.01) | 21.8 ± 7.9 | 5 (27.8) | 11 (61.1) |
| 15 - 20 mg/dL | 51 | 13 | 25.5 | 3.66 (2.04 - 6.57) | 28.3 ± 9.6 | 3 (23.1) | 5 (38.5) |
| 20 - 25 mg/dL | 72 | 9 | 12.5 | 1.79 (0.87 - 3.70) | 34.7 ± 11.2 | 1 (11.1) | 2 (22.2) |
| > 25 mg/dL | 89 | 8 | 9.0 | Reference | 40.2 ± 14.8 | 1 (12.5) | 2 (25.0) |
| Combined stratification | |||||||
| Albumin < 3.5 g/dL and prealbumin < 20 mg/dL | 58 | 26 | 44.8 | 8.91 (5.12 - 15.52) | 20.1 ± 6.8 | 8 (30.8) | 18 (69.2) |
| Albumin < 3.5 g/dL and prealbumin ≥ 20 mg/dL | 53 | 10 | 18.9 | 3.76 (1.96 - 7.22) | 31.5 ± 9.4 | 1 (10.0) | 3 (30.0) |
| Albumin ≥ 3.5 g/dL and prealbumin < 20 mg/dL | 31 | 5 | 16.1 | 3.20 (1.52 - 6.74) | 33.8 ± 10.2 | 1 (20.0) | 1 (20.0) |
| Albumin ≥ 3.5 g/dL and prealbumin ≥ 20 mg/dL | 108 | 7 | 6.5 | Reference | 43.2 ± 16.1 | 0 (0.0) | 0 (0.0) |
a Abbreviation: DILI, drug-induced liver injury. Drug-induced liver injury was adjudicated retrospectively using prespecified American Thoracic Society-adapted biochemical and symptom criteria based on all available liver function test results obtained during the 8-week intensive phase. Values are expressed as No. (%) or mean ± SD unless otherwise indicated.
Importantly, the clinical relevance of these markers is underscored by their association with adverse treatment outcomes. Patients below the identified thresholds had a 30.8% incidence of severe DILI and a 69.2% rate of treatment interruption, highlighting their utility for identifying patients at risk of clinically significant DILI-related liver injury.
4.4. Kaplan-Meier Survival Curves and Cox Proportional Hazards Models
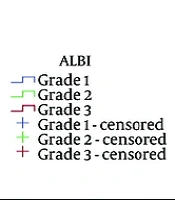
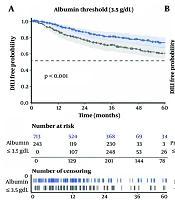
Because DILI is an event that may occur over time, survival analysis was performed. Figure 4A shows Kaplan-Meier survival curves stratified by albumin status (< 3.5 vs. ≥ 3.5 g/dL). The curves diverged soon after treatment initiation, with the gap widening over time. Cumulative DILI incidence increased rapidly in the albumin < 3.5 g/dL group, whose median DILI-free survival time was only 35 days. In contrast, the survival curve for the albumin ≥ 3.5 g/dL group declined more gradually. Within the 8-week observation period, over 50% of patients in this group did not experience DILI; therefore, the median survival time was not reached. The log-rank test indicated a highly significant between-group difference (χ2 = 32.15; P < 0.001). Figure 4B presents survival curves stratified by prealbumin status (< 20 vs. ≥ 20 mg/dL), demonstrating a highly similar pattern. The median DILI-free survival time for the prealbumin < 20 mg/dL group was 38 days, significantly shorter than that for the ≥ 20 mg/dL group, for which the median was not reached (log-rank χ2 = 28.42; P < 0.001).
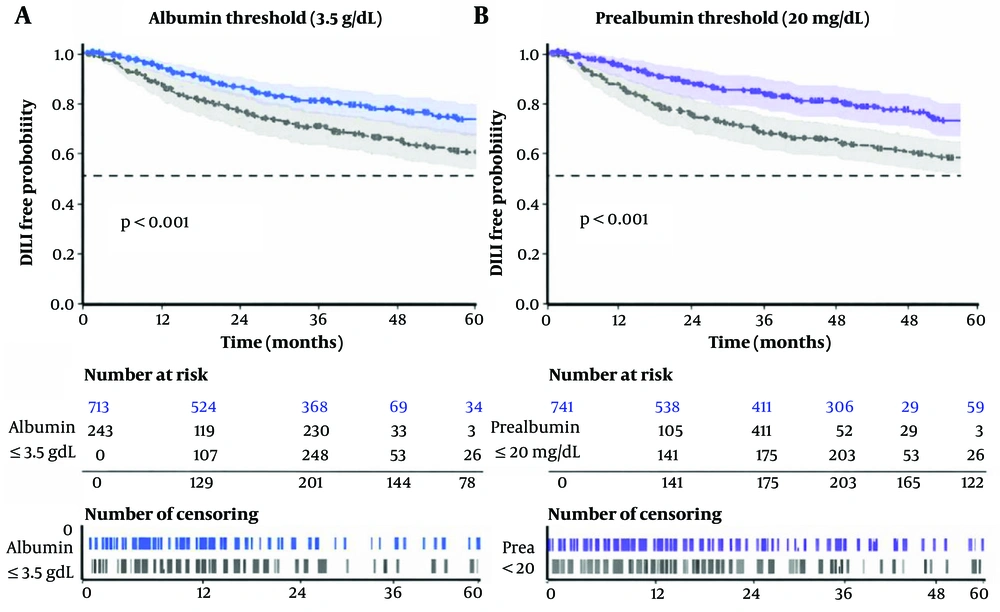
Figure 4.
Kaplan-Meier curves for time to antituberculosis drug-induced liver injury (DILI) during the 8-week intensive phase, stratified by baseline serum albumin < 3.5 vs. ≥ 3.5 g/dL (A) and baseline prealbumin < 20 vs. ≥ 20 mg/dL (B). Follow-up started at treatment initiation (Day 0) and ended at the first DILI event or censoring.
To further quantify time-dependent risk, Cox proportional hazards models were fitted (Table 4). Before interpreting these models, the proportional hazards assumption was assessed using Schoenfeld residual tests and inspection of log-minus-log plots; no meaningful departures from proportionality were observed for albumin, prealbumin, or the overall multivariable model. In the univariable model, albumin < 3.5 g/dL yielded a hazard ratio (HR) of 4.25 (95% CI, 2.68 - 6.73), prealbumin < 20 mg/dL an HR of 3.78 (95% CI, 2.38 - 6.00), age > 50 years an HR of 2.15, and baseline ALT > 40 U/L an HR of 2.42, with all P values < 0.001. In the multivariable adjusted model, which included these variables along with potential confounders such as HIV infection and low BMI, the adjusted HR for albumin < 3.5 g/dL was 2.86 (95% CI, 1.75 - 4.67; P < 0.001) and for prealbumin < 20 mg/dL was 2.35 (95% CI, 1.45 - 3.81; P < 0.001). These findings indicate that hypoalbuminemia and hypoprealbuminemia independently predicted earlier DILI onset, even after accounting for other factors. The model also confirmed age > 50 years (adjusted HR = 1.85), baseline ALT > 40 U/L (adjusted HR = 2.08), and HIV co-infection (adjusted HR = 1.62) as independent predictors of shortened time to DILI. Most non-event observations were administratively censored at completion of the 8-week intensive phase, whereas a small number were censored earlier because of death, nonhepatotoxic treatment discontinuation, loss to follow-up, or non-DILI-related regimen modification.
Table 4.
Cox Proportional Hazards Models for Time to Drug-Induced Liver Injury Onset a
| Variables and Models | Hazard Ratio (95% CI) | P Value | Global χ2 | Concordance Index |
|---|---|---|---|---|
| Model 1: Univariable | 42.7 | 0.72 | ||
| Albumin < 3.5 g/dL | 4.25 (2.68 - 6.73) | < 0.001 | ||
| Prealbumin < 20 mg/dL | 3.78 (2.38 - 6.00) | < 0.001 | ||
| Age > 50 (y) | 2.15 (1.42 - 3.26) | < 0.001 | ||
| Baseline ALT > 40 U/L | 2.42 (1.58 - 3.71) | < 0.001 | ||
| Model 2: Multivariable | 58.3 | 0.81 | ||
| Albumin < 3.5 g/dL | 2.86 (1.75 - 4.67) | < 0.001 | ||
| Prealbumin < 20 mg/dL | 2.35 (1.45 - 3.81) | < 0.001 | ||
| Age > 50 (y) | 1.85 (1.21 - 2.83) | 0.004 | ||
| Baseline ALT > 40 U/L | 2.08 (1.35 - 3.21) | 0.001 | ||
| HIV co-infection | 1.62 (1.02 - 2.57) | 0.042 | ||
| BMI < 18.5 kg/m2 | 1.48 (0.96 - 2.29) | 0.076 | ||
| Model 3: Combined score | 67.5 | 0.84 | ||
| Low risk (0 - 1 point) | Reference | - | ||
| Intermediate risk (2 points) | 2.95 (1.62 - 5.37) | < 0.001 | ||
| High risk (3 - 4 points) | 6.82 (3.78 - 12.31) | < 0.001 |
a Abbreviations: ALT, alanine aminotransferase; BMI, Body Mass Index; CI, confidence interval; HR, hazard ratio. Cox proportional hazards models were adjusted for age, sex, BMI, HIV status, diabetes, baseline ALT, and prophylactic hepatoprotective agent use. Proportional hazards assumptions were checked using Schoenfeld residuals.
4.5. Interaction and Subgroup Analyses
To examine whether the primary finding of increased DILI risk with low albumin/prealbumin held across different clinical subgroups and to explore factors that might modify the strength of this association, prespecified subgroup analyses were conducted. Results are presented in a forest plot (Figure 5) and a detailed table (Table 5), with subgroups displayed in a consistent order: Age, sex, BMI, HIV, baseline ALT, and diabetes.
Table 5.
Detailed Subgroup Analysis Stratified by HIV Status, Age, and Nutritional Status a
| Subgroups | No. | DILI Cases | Albumin < 3.5 g/dL | Prealbumin < 20 mg/dL | Adjusted OR for Albumin < 3.5 g/dL (95% CI) | P-Value | Adjusted OR for Prealbumin < 20 mg/dL (95% CI) | P-Value |
|---|---|---|---|---|---|---|---|---|
| HIV status | ||||||||
| HIV-negative | 205 | 36 (17.6) | 82 (40.0) | 70 (34.1) | 3.85 (2.31 - 6.42) | < 0.001 | 2.95 (1.78 - 4.88) | < 0.001 |
| HIV-positive | 45 | 12 (26.7) | 29 (64.4) | 19 (42.2) | 7.23 (3.45 - 15.15) | < 0.001 | 4.68 (2.21 - 9.91) | < 0.001 |
| P for interaction | 0.051 | 0.092 | ||||||
| Age group (y) | ||||||||
| < 40 | 95 | 12 (12.6) | 28 (29.5) | 25 (26.3) | 3.42 (1.85 - 6.32) | < 0.001 | 2.58 (1.32 - 5.04) | 0.005 |
| 40 - 60 | 115 | 22 (19.1) | 55 (47.8) | 45 (39.1) | 4.25 (2.38 - 7.59) | < 0.001 | 3.12 (1.75 - 5.56) | < 0.001 |
| > 60 | 40 | 14 (35.0) | 28 (70.0) | 19 (47.5) | 8.15 (4.12 - 16.14) | < 0.001 | 5.42 (2.68 - 10.95) | < 0.001 |
| P for trend | < 0.001 | < 0.001 | ||||||
| BMI categories (kg/m2) | ||||||||
| < 18.5 (underweight) | 88 | 24 (27.3) | 52 (59.1) | 45 (51.1) | 6.45 (3.28 - 12.68) | < 0.001 | 4.85 (2.48 - 9.48) | < 0.001 |
| 18.5 - 25.0 (normal) | 135 | 20 (14.8) | 52 (38.5) | 38 (28.1) | 3.78 (2.25 - 6.34) | < 0.001 | 2.92 (1.65 - 5.17) | < 0.001 |
| > 25.0 (overweight/obese) | 27 | 4 (14.8) | 7 (25.9) | 6 (22.2) | 2.45 (0.85 - 7.05) | 0.095 | 2.15 (0.74 - 6.25) | 0.157 |
| P for interaction | 0.078 | 0.125 | ||||||
| Baseline ALT (U/L) | ||||||||
| ≤ 40 | 192 | 30 (15.6) | 70 (36.5) | 60 (31.3) | 3.62 (2.14 - 6.13) | < 0.001 | 2.82 (1.66 - 4.79) | < 0.001 |
| > 40 | 58 | 18 (31.0) | 41 (70.7) | 29 (50.0) | 5.28 (2.85 - 9.78) | < 0.001 | 3.95 (2.12 - 7.36) | < 0.001 |
| P for interaction | 0.214 | 0.285 |
aValues are expressed as No. (%). Abbreviations: ALT, alanine aminotransferase; BMI, Body Mass Index; CI, confidence interval; DILI, drug-induced liver injury; OR, odds ratio. Subgroups were ordered as follows: age, sex, BMI, HIV status, baseline ALT, and diabetes. Age was categorized as < 40, 40 - 60, and > 60 years; BMI as < 18.5, 18.5 - 24.9, and ≥ 25.0 kg/m2; and baseline ALT as ≤ 40 versus > 40 U/L. Odds ratios were adjusted as specified in Methods, excluding the stratification variable within each subgroup model.
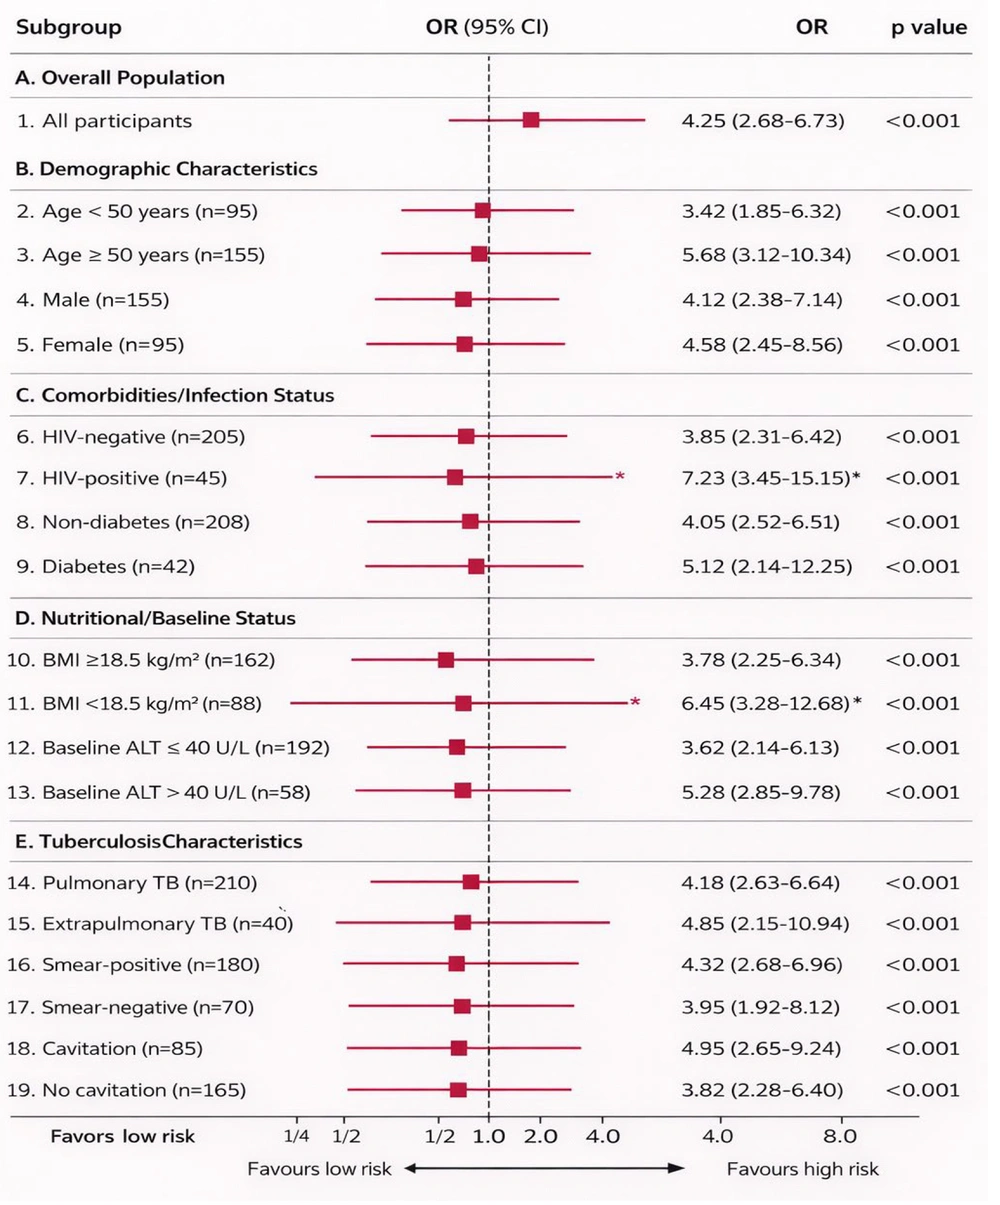
Figure 5.
Forest plot of subgroup analyses for the association between serum albumin < 3.5 g/dL and antituberculosis drug-induced liver injury (DILI). Subgroups are displayed in the following order: age, sex, Body Mass Index (BMI), HIV status, baseline alanine aminotransferase (ALT), and diabetes. Age categories were defined as < 40, 40 - 60, and > 60 years; BMI categories as < 18.5, 18.5 - 24.9, and ≥ 25.0 kg/m2; and baseline ALT as ≤ 40 versus > 40 U/L. Squares are proportional to subgroup sample size. Horizontal lines represent 95% confidence intervals. Interaction P < 0.10 is indicated for HIV (P = 0.051) and BMI (P = 0.078). All models are adjusted for relevant potential confounders.
The forest plot summarizes results from 21 subgroup analyses for the exposure “serum albumin < 3.5 g/dL.” Each subgroup is represented by a square indicating the point estimate OR and a horizontal line indicating the 95% confidence interval. The point estimate OR was greater than 1 for all subgroups, and the confidence intervals for the vast majority did not include 1. This finding indicates a consistent positive association between hypoalbuminemia and increased DILI risk across all analyzed subgroups.
However, the strength of the association varied across subgroups, suggesting potential effect modification. Specifically, the association was strongest in older patients, being highest among those aged > 60 years (n = 40; adjusted OR = 8.15; 95% CI, 4.12 - 16.14), intermediate among those aged 40 - 60 years (n = 115; OR = 4.25), and lower, though still significant, among patients aged < 40 years (n = 95; OR = 3.42; P for trend < 0.001). Sex-stratified analyses showed broadly similar associations in males and females, with overlapping confidence intervals and no clear evidence of interaction. BMI-stratified analyses showed that among malnourished patients with BMI < 18.5 kg/m2 (n = 88), low albumin conferred the greatest increase in DILI risk (adjusted OR = 6.45), higher than in those with normal or overweight BMI (interaction P = 0.078). HIV-stratified analyses showed that among HIV-positive patients (n = 45), the association between hypoalbuminemia and DILI was particularly strong (adjusted OR = 7.23; 95% CI, 3.45 - 15.15), whereas in HIV-negative patients (n = 205), the association remained significant but weaker (adjusted OR = 3.85; 95% CI, 2.31 - 6.42; P-interaction = 0.051). Baseline ALT-stratified analyses showed a consistent direction of association across strata, without marked evidence of reversal. Diabetes-stratified analyses likewise showed overlapping effect estimates and interaction P values > 0.20, indicating no strong evidence that diabetes materially modified the association. A similar overall pattern was observed for prealbumin.
4.6. Predictive Performance Assessment and Preliminary Development of a Clinical Risk Stratification Tool
We assessed the discriminative ability of albumin and prealbumin for predicting DILI by constructing receiver operating characteristic curves (Figure 6 and Table 6).
Table 6.
Comprehensive Performance Metrics of Different Prediction Models a
| Prediction Model | AUC (95% CI) | Sensitivity | Specificity | PPV | NPV | Accuracy | F1 Score | Brier Score |
|---|---|---|---|---|---|---|---|---|
| Single markers | ||||||||
| Albumin < 3.5 g/dL | 0.78 (0.71 - 0.85) | 75.0 | 72.8 | 38.7 | 92.9 | 73.2 | 0.511 | 0.148 |
| Prealbumin < 20 mg/dL | 0.73 (0.65 - 0.81) | 70.8 | 68.3 | 34.8 | 90.7 | 68.8 | 0.465 | 0.162 |
| Combined models | ||||||||
| Albumin + prealbumin | 0.82 (0.76 - 0.88) | 79.2 | 76.2 | 42.9 | 94.3 | 76.8 | 0.556 | 0.132 |
| Basic clinical model b | 0.75 (0.68 - 0.82) | 72.9 | 70.8 | 36.5 | 92.1 | 71.2 | 0.485 | 0.155 |
| Full model | ||||||||
| Comprehensive model c | 0.85 (0.79 - 0.91) | 83.3 | 78.2 | 46.2 | 95.4 | 79.2 | 0.592 | 0.121 |
| Risk stratification | ||||||||
| Low risk (0 - 1 factor) | - | 91.7 | 58.9 | 31.9 | 97.2 | 65.2 | 0.475 | 0.138 |
| High risk (≥ 2 factors) | - | 68.8 | 85.1 | 47.4 | 93.2 | 82.0 | 0.560 | 0.130 |
a Abbreviations: ALT, alanine aminotransferase; AUC, area under the receiver operating characteristic curve; BMI, Body Mass Index; CI, confidence interval; NPV, negative predictive value; PPV, positive predictive value.
b Basic clinical model: age > 50 years + baseline ALT > 40 U/L.
c Comprehensive model: albumin < 3.5 g/dL + prealbumin < 20 mg/dL + age > 50 years + baseline ALT > 40 U/L + HIV + BMI < 18.5 kg/m2. Apparent performance refers to the derivation cohort; optimism-corrected estimates were obtained by bootstrap internal validation with 1000 resamples.
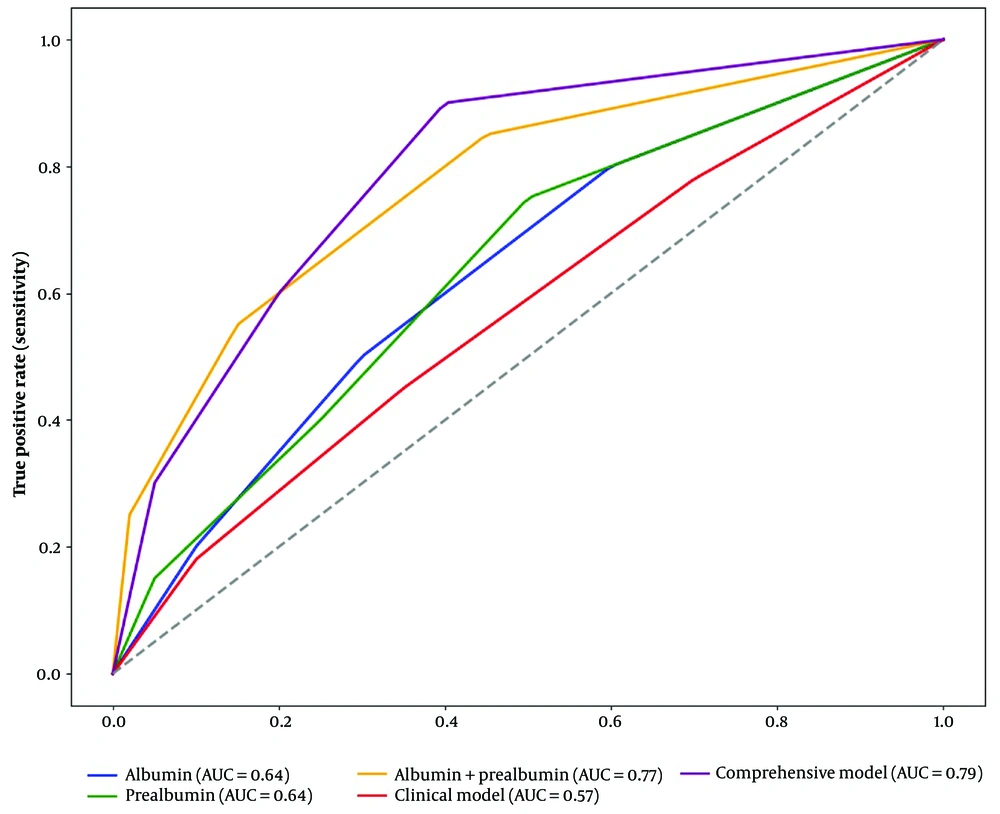
Figure 6.
Receiver operating characteristic curves for albumin-, prealbumin-, and multivariable model-based prediction of antituberculosis drug-induced liver injury (DILI) in the derivation cohort. AUC indicates area under the receiver operating characteristic curve.
Using the Youden index to determine optimal cutoffs, the best value for serum albumin was 3.45 g/dL, close to 3.5 g/dL, yielding an area under the curve (AUC) of 0.78 (95% CI, 0.71 - 0.85), with a sensitivity of 75.0% and a specificity of 72.8%. For serum prealbumin, the cutoff was 19.8 mg/dL, with an AUC of 0.73 (95% CI, 0.65 - 0.81). Incorporating both albumin < 3.5 g/dL and prealbumin < 20 mg/dL as binary variables into a model improved predictive performance, increasing the AUC to 0.82 (95% CI, 0.76 - 0.88). A more comprehensive prediction model was built by integrating multiple independent risk factors identified in the multivariable analysis. This comprehensive model included albumin < 3.5 g/dL, prealbumin < 20 mg/dL, age > 50 years, baseline ALT > 40 U/L, HIV infection, and BMI < 18.5 kg/m2 and demonstrated the best predictive performance, achieving an AUC of 0.85 (95% CI, 0.79 - 0.91).
A clinical risk score was then derived from baseline predictors that were both independently associated with DILI in adjusted analyses and routinely available before treatment initiation. The retained variables were serum albumin < 3.5 g/dL, prealbumin < 20 mg/dL, age > 50 years, and baseline ALT > 40 U/L. In constructing the score, albumin and prealbumin were converted from continuous variables to binary indicators using the internally estimated and clinically rounded thresholds identified in the spline analyses, whereas age and baseline ALT were dichotomized at prespecified clinically interpretable cut points. In the derivation cohort, the apparent C-index of the score was 0.84, indicating good discrimination. After bootstrap internal validation with 1000 resamples, the optimism-corrected C-index was 0.81, suggesting modest but acceptable overfitting. For the corresponding binary discrimination analysis, the apparent AUC of the 4-variable score model was 0.85 (95% CI, 0.79 - 0.91), and the bootstrap-corrected AUC was 0.82.
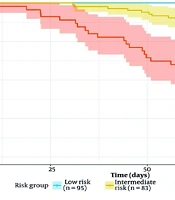
In the simplified model, the β coefficients for the 4 retained predictors were of comparable magnitude; therefore, after scaling coefficients relative to the smallest retained coefficient and rounding to the nearest integer, each variable was assigned 1 point. The total score thus ranged from 0 to 4. Based on observed event rates and separation of Kaplan-Meier curves, patients were categorized into low-risk (0 - 1 point), intermediate-risk (2 points), and high-risk (3 - 4 points) groups. Compared with the low-risk group, the intermediate-risk and high-risk groups exhibited progressively higher DILI incidence, with HRs of 2.95 (95% CI, 1.62 - 5.37) and 6.82 (95% CI, 3.78 - 12.31), respectively.
4.7. Sensitivity Analyses and Model Robustness
To ensure the reliability of the main findings, a series of sensitivity analyses were performed (Table 7). Using a stricter, more specific DILI definition (ALT > 5 × ULN only irrespective of symptoms) yielded consistent results, with the OR for hypoalbuminemia increasing to 5.12 (P < 0.001). To minimize the potential influence of more pronounced pretreatment liver biochemical abnormality, we reran the primary analyses after excluding all patients with baseline ALT > 2 × ULN (n = 25). In this restricted cohort, the association between low albumin and DILI remained highly significant (OR for albumin < 3.5 g/dL = 4.05; P < 0.001), indicating that the main findings were not solely driven by patients with clearly abnormal baseline liver enzymes. Nevertheless, this analysis does not eliminate the possibility that milder pretreatment abnormalities below the 2 × ULN threshold still contributed to residual confounding. Comparison of results from the primary complete-case analysis (n = 228) with those obtained after multiple imputation by chained equations with 20 imputed datasets showed highly consistent findings. In the imputed analysis, the adjusted OR for albumin per 1 g/dL decrease was 1.81 (95% CI, 1.29 - 2.54), compared with 1.85 (95% CI, 1.32 - 2.59) in the complete-case analysis; the adjusted OR for prealbumin per 10 mg/dL decrease was 1.39 (95% CI, 1.09 - 1.78), compared with 1.42 (95% CI, 1.11 - 1.82) in the complete-case analysis. These results indicate that the main conclusions were not materially influenced by limited covariate missingness.
Table 7.
Comprehensive Sensitivity Analyses a
| Analysis Type | Sample Size | Albumin < 3.5 g/dL OR (95% CI) | P Value | Prealbumin < 20 mg/dL OR (95% CI) | P Value | Notes |
|---|---|---|---|---|---|---|
| Primary analysis | 250 | 4.25 (2.68 - 6.73) | < 0.001 | 3.78 (2.38 - 6.00) | < 0.001 | Reference |
| DILI definition | ||||||
| Strict (ALT > 5 × ULN) | 250 | 5.12 (3.05 - 8.59) | < 0.001 | 4.25 (2.52 - 7.17) | < 0.001 | n = 31 DILI cases |
| Exclusion criteria | ||||||
| Exclude ALT > 2 × ULN | 225 | 4.05 (2.48 - 6.61) | < 0.001 | 3.62 (2.21 - 5.93) | < 0.001 | n = 25 excluded |
| Exclude HIV-positive patients | 205 | 3.85 (2.31 - 6.42) | < 0.001 | 2.95 (1.78 - 4.88) | < 0.001 | n = 45 excluded |
| Missing data | ||||||
| Complete-case | 235 | 4.18 (2.61 - 6.69) | < 0.001 | 3.72 (2.33 - 5.95) | < 0.001 | n = 15 with missing covariates |
| Multiple imputation | 250 | 4.22 (2.66 - 6.70) | < 0.001 | 3.75 (2.36 - 5.96) | < 0.001 | 20 imputed datasets |
| Matching methods | ||||||
| Propensity score matching | 164 | 3.95 (2.28 - 6.85) | < 0.001 | 3.52 (2.01 - 6.16) | < 0.001 | 1:1 matching, caliper = 0.2 |
| Inverse probability weighting | 250 | 4.15 (2.61 - 6.59) | < 0.001 | 3.68 (2.32 - 5.84) | < 0.001 | Stabilized weights |
| Validation | ||||||
| Bootstrap internal validation | 250 | 4.20 (2.64 - 6.68) | < 0.001 | 3.70 (2.33 - 5.88) | < 0.001 | 1000 bootstraps |
| Time-dependent ROC | 250 | 0.76 (0.69 - 0.83) | - | 0.71 (0.64 - 0.78) | - | AUC at 60 days |
a Abbreviations: ALT, alanine aminotransferase; AUC, area under the curve; CI, confidence interval; DILI, drug-induced liver injury; OR, odds ratio; ROC, receiver operating characteristic; sHR, subdistribution hazard ratio; ULN, upper limit of normal. Multiple imputation was performed using chained equations with 20 imputed datasets. Competing-risk analyses used Fine-Gray subdistribution hazard models.
To emulate randomization, we performed propensity score matching. Using low albumin as the treatment variable and incorporating all baseline covariates to estimate propensity scores, 1:1 nearest neighbor matching with a caliper width of 0.2 successfully created a matched cohort of 164 patients. After matching, standardized mean differences for all covariates were < 0.1, indicating good balance. Within this matched sample, the association between low albumin and DILI remained highly significant (OR = 3.95; P < 0.001). Inverse probability of treatment weighting using stabilized weights was also applied, creating a pseudo-population with balanced covariate distribution between exposure groups. The weighted analysis results were highly consistent with the primary analysis. Bootstrap resampling with 1000 replicates produced bias-corrected confidence intervals that overlapped extensively with the original intervals, indicating stable effect estimates. In addition, bootstrap internal validation of the simplified risk score showed only modest optimism: the apparent C-index of 0.84 was corrected to 0.81, and the apparent AUC of 0.85 was corrected to 0.82. Calibration was also acceptable on internal validation, with a bootstrap-corrected calibration slope of 0.91, suggesting limited overfitting of the score within the derivation cohort. Because some patients could experience events that precluded subsequent observation of DILI, we additionally fitted Fine-Gray subdistribution hazard models treating death before DILI, loss to follow-up, permanent discontinuation of treatment for nonhepatotoxicity reasons, and major non-DILI-related regimen modification as competing events. The Fine-Gray results were directionally consistent with the cause-specific Cox models. In the adjusted competing-risk analysis, albumin < 3.5 g/dL remained associated with increased DILI incidence (sHR = 2.71; 95% CI, 1.66 - 4.43), as did prealbumin < 20 mg/dL (sHR = 2.21; 95% CI, 1.36 - 3.59). These subdistribution HRs were slightly attenuated relative to the primary Cox estimates but supported the same overall conclusion that lower albumin and prealbumin levels predicted a higher risk of DILI during follow-up.
Additional sensitivity analyses using alternative cut points close to the internally estimated thresholds yielded similar conclusions. For albumin, categorical models using 3.4 g/dL and 3.6 g/dL instead of 3.5 g/dL produced directionally consistent associations with DILI, with only modest variation in effect size. Likewise, for prealbumin, reanalysis using 19 mg/dL and 21 mg/dL instead of 20 mg/dL did not materially alter the observed risk gradient. These findings suggest that the association was not driven by a single arbitrarily chosen cut point.
All sensitivity analyses therefore yielded consistent conclusions, robustly supporting the core finding of this study: lower pretreatment serum albumin and prealbumin levels are independent risk factors for developing DILI during the intensive phase of antituberculosis therapy.
5. Discussion
This study systematically examined the association between pretreatment serum albumin and prealbumin levels and the risk of DILI during the intensive phase of antituberculosis therapy. The key findings were as follows: 1) lower baseline albumin and prealbumin levels were independently associated with DILI in this cohort; 2) both markers showed nonlinear associations with risk, with candidate thresholds near 3.5 g/dL for albumin and 20 mg/dL for prealbumin; 3) these associations appeared stronger in patients who were HIV-positive, older, or underweight; and 4) a preliminary multivariable score showed reasonable discrimination within the derivation dataset. These findings should be interpreted as hypothesis-generating rather than practice-changing.
Our findings align with the evolving research direction in this field. Consistent with prior evidence, this study confirmed that baseline hypoalbuminemia (< 3.5 g/dL) is a strong predictor of DILI. More importantly, using restricted cubic spline analysis, we demonstrated a nonlinear threshold effect for serum albumin in the context of antituberculosis therapy, whereby DILI risk rose sharply as levels fell below approximately 3.5 g/dL. However, albumin and prealbumin should not be interpreted solely as isolated causal predictors. The broader hepatology literature, including studies using albumin-related composite indices such as the albumin-bilirubin score, supports the view that albumin-containing measures may capture aspects of hepatic reserve and prognosis beyond nutritional status alone (6). In clinical practice, these measures likely integrate several overlapping processes, including protein-energy malnutrition, systemic inflammation, impaired hepatic synthetic reserve, and possible subclinical liver dysfunction present before treatment initiation. In parallel, our study substantiates the independent predictive value of prealbumin. Notably, although adjustment for baseline ALT and sensitivity analyses excluding patients with ALT > 2 × ULN did not materially alter the main associations, these steps cannot fully exclude the influence of milder pretreatment biochemical abnormalities, which may reflect subclinical hepatic stress rather than overt chronic liver disease. We quantified this association as an approximately 42% increased risk per 10 mg/dL decrease and, through nonlinear analysis, identified 20 mg/dL as a key threshold, providing context-specific evidence within tuberculosis for the clinical interpretation of prealbumin highlighted by Shenkin (2021) (12).
A principal contribution of this work is the delineation of the nonlinear relationships and candidate thresholds between serum albumin/prealbumin and DILI risk. Traditional linear regression models may underestimate risk in patients with very low levels. Our observation that the slope of the DILI risk curve steepens considerably below 3.5 g/dL for albumin or 20 mg/dL for prealbumin suggests that clinical risk assessment should focus on these high-risk thresholds rather than a continuous gradient. Although these markers are nonspecific, identifying these thresholds enables early assessment of hepatic vulnerability before treatment initiation, complementing dynamic monitoring of ALT/AST by providing a baseline risk context (4, 27). For instance, these thresholds may help identify patient subsets warranting further study in future standardized monitoring protocols. However, they should not yet be interpreted as definitive clinical decision thresholds for altering surveillance frequency in routine practice. Because the corresponding change points were estimated from the present dataset and then rounded to clinically convenient values, these thresholds should be regarded as internally derived candidate cut points that may be subject to optimism bias until externally validated.
Subgroup and interaction analyses further clarified risk heterogeneity. We found that the association between hypoalbuminemia/hypoprealbuminemia and DILI risk was markedly amplified in HIV-positive patients. This likely reflects a synergistic interplay in which chronic immune activation, inflammation, and metabolic disturbances inherent to HIV infection compound the effects of malnutrition, further impairing hepatic drug metabolism and detoxification capacity (28, 29). Similarly, stronger associations were observed in elderly patients aged > 60 years and those with low BMI (< 18.5 kg/m2). Age-related declines in hepatic physiologic reserve and frequent polypharmacy in older adults, coupled with the catabolic state and protein-energy deficit reflected by malnutrition, likely underpin these observations (30, 31). These findings underscore the need for holistic clinical assessment when evaluating DILI risk in patients with TB. Individuals presenting with combined high-risk features, such as concurrent HIV infection, advanced age, or malnutrition, should be regarded as being at exceptionally high risk, warranting the highest level of vigilance and potential intervention, even if their albumin or prealbumin levels are only marginally below the defined thresholds.
Regarding predictive performance, our analysis showed that albumin or prealbumin alone provided reasonably good discrimination, with AUC values of 0.78 and 0.73, respectively. Combining them increased the AUC to 0.82, suggesting that these markers reflect different dimensions of pathophysiology, such as chronic wasting versus acute inflammation/malnutrition, and that their joint use yields a more comprehensive risk profile. Adding albumin and prealbumin to a base model of age and ALT improved the C-index from 0.75 to 0.84, indicating incremental prognostic information beyond established clinical risk factors; however, their prognostic value likely reflects a composite signal that includes malnutrition, inflammatory burden, and latent hepatic vulnerability rather than a single biological pathway (23). The simple risk score derived from our findings, assigning 1 point each for albumin < 3.5 g/dL, prealbumin < 20 mg/dL, age > 50 years, and baseline ALT > 40 U/L, separated patients into groups with different observed DILI incidence within the derivation cohort. This suggests potential prognostic relevance but not readiness for routine clinical use. At present, the score should be regarded as a derivation-stage model with internal bootstrap correction only; its transportability, calibration, and net clinical benefit in independent settings remain unknown. Consistency between the cause-specific Cox models and the Fine-Gray competing-risk analyses further suggests that the observed associations were not solely driven by informative censoring due to death, nonhepatotoxic treatment discontinuation, loss to follow-up, or major regimen changes during the intensive phase.
This study used rigorous statistical adjustments to account for the inherent nonlinearity of nutritional markers, ensuring that the identified thresholds were statistically grounded rather than based on arbitrary clinical cutoffs. Nevertheless, several limitations warrant acknowledgment. First, as a single-center retrospective study, there are inherent risks of selection, information, and confounding bias, despite efforts to enhance robustness through standardized data extraction, detailed exclusion criteria, and propensity score matching. In particular, residual confounding by pretreatment liver vulnerability remains possible. Although baseline ALT was incorporated into the main models and patients with ALT > 2 × ULN were excluded in sensitivity analyses, milder biochemical abnormalities or unmeasured hepatic factors below these thresholds may still have influenced both nutritional markers and subsequent DILI risk. In constructing multivariable models, we selected covariates based on clinical knowledge and prior literature, distinguishing confounders from potential mediators to avoid overadjustment. Treatment-related variables, including dose reductions, temporary interruptions, and early discontinuations potentially triggered by subclinical liver enzyme elevations, were deliberately excluded from the main models to minimize reverse causality. Sensitivity analyses incorporating these variables and alternative modeling strategies yielded results consistent with the primary findings, supporting the robustness of our conclusions. Although the center followed a standard liver function monitoring schedule, additional testing could be performed according to symptoms, interim abnormalities, or clinician judgment, and patients perceived to be at higher baseline risk may have undergone closer surveillance. Accordingly, differential monitoring intensity may have increased the likelihood of earlier or more frequent DILI detection in some patients. In addition, patients with pre-existing chronic liver disease were excluded to reduce major baseline heterogeneity in hepatic synthetic function and background liver injury, which could obscure the specific association between pretreatment albumin/prealbumin levels and incident antituberculosis DILI during follow-up. This design improved internal validity for the target question but at the cost of reduced generalizability to patients with tuberculosis and underlying chronic liver disorders.
Second, although the overall sample size (n = 250) was adequate for the primary analyses, certain subgroup analyses, such as the HIV-positive subgroup, involved smaller numbers, potentially limiting statistical power and precision of estimates. Importantly, as a single-center retrospective study, our proposed risk score serves as a proof of concept and lacks external validation; therefore, its reported discrimination should be interpreted with caution. More broadly, the study should be viewed as a STROBE-aligned observational analysis intended to improve transparency and generate testable hypotheses, rather than to establish an immediately deployable clinical prediction tool. In addition, the score was simplified from regression coefficients without formal penalization or shrinkage; thus, some residual optimism may remain despite bootstrap correction. The same caution applies to the spline-derived thresholds. Although bootstrap internal validation and alternative cut point sensitivity analyses supported their stability within this cohort, the identified cut points may still be optimistic and require confirmation in independent datasets. Before any implementation in routine care, these findings should undergo external validation, multicenter calibration, assessment under standardized liver function monitoring schedules, and prospective evaluation of whether threshold-guided strategies improve patient outcomes. More specifically, the present findings are most applicable to adult patients with active tuberculosis who initiate standard first-line antituberculosis therapy in the absence of known chronic liver disease at baseline. The results should not be directly extrapolated to patients with chronic hepatitis B or C, alcoholic liver disease, nonalcoholic fatty liver disease with advanced fibrosis/cirrhosis, established cirrhosis, or other chronic hepatic disorders, in whom baseline albumin/prealbumin may reflect underlying liver disease severity as much as nutritional or inflammatory status.
Third, our study primarily relied on routine laboratory markers. We did not incorporate more specific inflammatory markers, such as interleukin 6 or tumor necrosis factor α, or systematic pharmacogenomic testing, such as NAT2 or GSTM1 genotypes, which may interact with nutritional markers to jointly influence DILI risk (32, 33). Finally, DILI diagnosis was based on biochemical criteria and clinical symptoms, aligning with current mainstream practice and guideline definitions (4, 5), but lacked confirmation by liver histopathology, the diagnostic gold standard. In addition, although competing-risk analyses were performed, the classification of some non-DILI treatment changes or early follow-up losses inevitably relied on retrospective clinical documentation, which may have introduced residual misclassification. However, to reduce outcome misclassification, all potential events were retrospectively adjudicated using the same prespecified biochemical and symptom criteria rather than relying solely on the treating clinicians’ original labels.
Based on our results, we propose the following clinical implications and future research directions. In clinical practice, routine measurement of baseline serum albumin and prealbumin may be reasonable where these tests are already available; however, the present data are insufficient to mandate their use as stand-alone decision tools. Patients with albumin < 3.5 g/dL and/or prealbumin < 20 mg/dL may represent a higher-risk subgroup in this cohort; however, whether they should receive intensified monitoring, targeted nutritional intervention, or other preventive strategies should be tested prospectively within standardized care pathways rather than assumed from retrospective data alone (17, 34). Evidence from randomized controlled trials suggests that targeted nutritional interventions may improve TB treatment outcomes (18). For high-risk patients, the potential role of prophylactic hepatoprotective agents, such as ursodeoxycholic acid and silymarin, warrants further investigation in rigorously designed studies (35, 36). Future research should prioritize 1) external validation of our identified thresholds and risk score in prospective cohorts across diverse geographical and demographic settings; 2) intervention studies designed to evaluate whether intensified monitoring strategies or preventive measures, such as nutritional supplementation or hepatoprotective drugs, targeted at patients with hypoalbuminemia/hypoprealbuminemia effectively reduce DILI incidence; 3) integration of genomics, proteomics, and other multiomics data with clinical nutritional indicators to develop next-generation, more precise individualized risk prediction models (37, 38); and 4) further exploration of the predictive value of these nutritional markers in the context of drug-resistant TB treatment or when second-line antituberculosis agents are used (3).
5.1. Conclusions
This study suggests that lower pretreatment serum albumin (< 3.5 g/dL) and prealbumin (< 20 mg/dL) levels are independently associated with a higher risk of DILI during the intensive phase of antituberculosis therapy. These markers may reflect not only nutritional status but also inflammatory burden and subclinical hepatic vulnerability at baseline. Hypoalbuminemia and hypoprealbuminemia demonstrate synergistic interactions with other risk factors, including advanced age, HIV infection, and malnutrition. A simple risk score integrating albumin, prealbumin, age, and baseline ALT showed preliminary risk separation within the derivation cohort. In adult patients with tuberculosis without known chronic liver disease who initiate standard first-line antituberculosis therapy, these readily available laboratory indicators may help identify individuals with higher observed DILI risk in similar retrospective cohorts. However, their applicability to patients with underlying chronic hepatic disorders remains uncertain, and broader clinical use should await external validation, multicenter calibration, standardized monitoring frameworks, and prospective assessment.