1. Background
Chronic Hepatitis B (CHB) is a global health concern as it is associated with substantial morbidity and mortality. Although viral factors, such as Hepatitis B Virus (HBV) DNA, HBeAg, and genotype increase the risk of histological progression and Hepatocellular Carcinoma (HCC), there are other host factors that can also play key roles in the development of HCC (1-4). Non-Alcoholic Fatty Liver Disease (NAFLD) is increasingly common in both the general population and the HBV-infected patients, reflecting the increasing prevalence of obesity in both Western and Eastern countries (5, 6). The spectrum of NAFLD ranges from simple hepatic steatosis through Non-Alcoholic Steato Hepatitis (NASH) to liver cirrhosis (1-3, 7). Nowadays, many Asian patients are suffering from both NAFLD and chronic HBV infection. However, the mechanism of NAFLD and its effects on HBV infection have not yet been adequately clarified in patients with CHB. Some previous reports have revealed that hepatic steatosis in CHB patients is mainly associated with metabolic disorders, such as obesity, Type 2 Diabetes Mellitus (T2DM), and dyslipidemia; it is not associated with viral load or genotype. This is proved by the strongly expressive results indicating a negative association of hepatic steatosis with viral load. Thus, hepatic steatosis may enhance viral clearance and inhibit HBV DNA replication (1, 5, 7, 8). However, we have not been successful in elucidating the mechanism underlying the association between steatosis and HBV.
Some evidences indicate that Toll-Like Receptor 4 (TLR4) signals the pathway associated with the pathogenesis of NAFLD in patients with HBV infection. TLRs are a family of pattern recognition receptors that play a critical role in the innate immune system as ten different types of TLRs are expressed in human beings. Toll-like receptor 4 is a cell surface receptor that is crucial for the activation of innate immune responses (9). This receptor binding sites activate two distinct intracellular signaling pathways via MyD88-dependent and MyD88-independent pathways, resulting in the induction of proinflammatory cytokine genes, such as Tumor Necrosis Factor α (TNF-α), Interleukin 6 (IL-6), and Type 1 Interferons (IFNs I) (10, 11). Bacterial endotoxin Lipopolysaccharide (LPS) is a well-known TLR4 ligand (12, 13). Nonbacterial substances such as Free Fatty Acids (FFAs) may also function as TLR4 ligands. Several studies have reported that Palmitic Acid (PA) and Oleic Acid (OA) are the most common FFAs that covalently coordinate with TLR4 to induce the expression of proinflammatory cytokines in macrophages, adipocytes, and liver cells (9, 14-16). It has been reported that TLR4/MyD88 signaling pathways played a pivotal role in the development of NAFLD. Furthermore, downstream proinflammatory cytokines (TNFα, IL-6) promoted the progression of NAFLD. However, the interaction between chronic HBV infection and TLR4 is complex; some studies have reported that HBV replication is inhibited when LPS signals TLR4 to up-regulate IFN-β expression levels through MyD88-independent pathway (17-19).
It has been reported in previous studies that both direct and indirect mediators inhibit viral replication. IFNα/β, TNFα, IL-1, and nitric oxide act as direct mediators, whereas immunoregulatory cytokines, chemokines, lipid mediators, and peroxide act as indirect antiviral mediators (19, 20). We speculated that IFN-β, IL-6, and TNF-α served as the mediators to inhibit HBV replication in patients having chronic HBV infection along with NAFLD. In NAFLD patients and animal models, increased circulating LPS and FFAs, which are recognized by TLR4, lead to the elevated levels of IFN-β, TNF-α and IL-6. Therefore, we also speculated that both TLR4/MyD88 dependent and independent pathways might be simultaneously activated in chronic HBV infection with NAFLD.
2. Objectives
In this study, our aim was to determine whether TLR4 signaling pathway participated in the occurrence of NAFLD in HBV transgenic mice; we also identified whether Stearic Acid (SA) acts as a ligand of TLR4 to induce the steatosis of HepG2.2.15 cells. In addition, we determined whether TLR4-mediated innate immunity inhibited HBV replication in chronic HBV infection with NAFLD.
3. Materials and Methods
3.1. Mice and Experimental Procedures
We purchased male HBV-transgenic Balb/C mice aged 4-weeks from the Transgenic Engineering Research Laboratory, 458th Hospital of PLA (Guangzhou, China) and divided them into the following two groups, that is, control group and NAFLD group for 8 - 24 weeks of treatment. The mice belonging to the control group (HBV group, n = 8) were fed standard chow. The mice belonging to the NAFLD group (HBV/NAFLD group, n = 8) were fed High Fat Diet (HFD). This HFD consisted of 2% cholesterol, 10% lard oil, and 88% standard chow by weight. All the animals received unlimited access to the chow and water. These mice were sacrificed at the end of 8, 16, and 24 weeks of the study, respectively. We collected their serum samples and stored them at -20°C for further use. A portion of the liver’s left lobe was snapped and frozen in liquid nitrogen for performing subsequent RNA or protein analyses, and the remaining portion of this lobe was used to prepare homogenates. All the experiments were performed in accordance with the procedure approved by the Shanghai Jiao Tong University Institutional Animal Care and Use Committee.
3.2. Cell Culture
HepG2.2.15 cells were obtained from the American Type Culture Collection (Manassas, VA). These cells were maintained in a humidified incubator containing an atmosphere of 5% CO2 and a Dulbecco’s modified Eagle’s medium (DMEM) supplemented with L-glutamine, penicillin-streptomycin, and 10% fetal bovine serum (FBS, Gibco BRL, USA); the temperature of this medium was maintained at 37°C.
3.3. Cell Proliferation Assay
Cell proliferation was assessed using 3 - [4,5-dimethyl-thiazol-2-yl] - 2, 5-diphenyl tetrazolium bromide (MTT; Sigma, USA). HepG2.2.15 cells were seeded onto a 96-well plate at 4 × 10³/well in triplicate wells. After 24 hours, the cells were incubated with 25 μM, 50 μM, 100 μM, and 200 μM of SA (Sigma, USA), which was then dissolved in Dimethyl Sulfoxide (DMSO); the reaction mixture was kept standing for 6 hours, 24 hours, or 48 hours. Thereafter, 5 mg/mL of MTT was added to the culture medium according to method recommended by the manufacturer, and the cells were then incubated for an additional 4 hours. At the end of the assay, the cell-growth medium was replaced with 150 μL DMSO and the absorbance values were recorded at 490 nm.
3.4. Oil Red-O Staining and Triglyceride Assay
After HepG2.2.15 cells were treated with SA (0 μM, 25 μM, 50 μM, 100 μM, and 200 μM) for 48 hours, the degree of steatosis of cells was measured using Oil red-O staining. In this assay, cells were fixed with formaldehyde, while lipids were stained using 0.5% Oil red-O in isopropyl alcohol for 20 minutes, and nuclei were counterstained with hematoxylin for 1 minute. Cell images were then observed under a bright field microscope (Olympus, Japan) at 200 × magnification. Total triglyceride (TG) levels were measured by performing an enzymatic assay using a TG assay kit from Applygen Technologies Inc. (Shanghai, China), according to the manufacturer’s instructions, and the TG concentrations were normalized with protein content.
3.5. Histopathological and Immunohistochemistry Analysis
Ten percent formalin fixed, paraffin embedded sections of hepatic tissue were stained with hematoxylin-eosin (H and E) using standard procedures. The HBV/NAFLD groups were blindly evaluated using the NAFLD activity score.
Paraffin-embedded liver tissues were deparaffinized with xylene, washed with graded ethanol and then permeabilized with 0.2% trypsin at room temperature for 30 minutes. Inactivation of endogenous peroxidase was achieved using 3% H2O2 for 20 minutes. Then, these tissue sections were washed with Phosphate-Buffered Saline (PBS) and incubated overnight with appropriate primary antibodies at 4°C. Goat antibodies raised against mouse TLR4 or IL-6 (Abcam, Cambridge, UK), or mouse MyD88 (Cell signaling, USA) were diluted 1:100 in PBS. While using secondary antibodies, PBS served as the negative control. 3, 3-di-amino-benzidine (DAB; Santa Cruz, USA) was used for visualization. All the sections were evaluated using a binocular microscope (Leica, Germany). We quantitatively analyzed the intensity of immunostaining for TLR4, MyD88, and IL-6 using images of the liver tissues obtained from the two groups of mice at 8, 16, and 24 weeks, respectively. These images were analyzed for positive staining at a magnification of 200 × using the quantitative immunohistochemical analysis software Image Pro Plus (Media Cybernetics, Baltimore, MD). We evaluated integrated optical densities, where the term “integrated” refers to the sum of all pixel intensities or density values in a given region.
3.6. Quantitative Real-Time Polymerase Chain Reaction
Total RNA was extracted from the liver tissues and HepG2.2.15 cells using the TRIzol reagent (Invitrogen, USA) and reverse transcribed using the PrimeScript RT Reagent Kit (TaKaRa, Kusatsu, Japan). The mRNA expression of TLR4, MyD88, IL-6, TNF-α, and IFN-β was measured by Real-Time Polymerase Chain Reaction (RT-PCR) using the SYBR Premix Ex TaqTM Kit (TaKaRa, Kusatsu, Japan) and an ABI 7500 RT-PCR System (Applied Biosystems, USA). Target mRNA levels were normalized to β-actin expression levels. A duplicate of this experiment was performed for the same reaction. The 2-∆∆Ct method was used to calculate the relative expression levels for each gene. The sequences of primers were available upon request.
3.7. Enzyme-Linked Immunosorbent Assay
The Enzyme-Linked Immunosorbent Assay (ELISA) DuoSet Kits (R and D Systems Inc., Minneapolis, MN, USA) were used to determine the concentrations of TNF-α and IL-6 in hepatic homogenates and that of the cell culture supernatants and IFN-β in HBV transgenic mice serum and cell supernatants. The process of measuring these concentrations was performed according to the manufacturer’s instructions. All experiments were performed in duplicate.
3.8. Western Blot Analysis
The harvested cells were lysed in radioimmunoprecipitation (RIPA) buffer containing the protease inhibitor PMSF. Protein concentrations were determined using 2-Quinolinecarboxylic acid (BCA) assays, and samples containing 40 μg of total protein were resolved using 10% sodium dodecyl sulfate polyacrylamide gradient gel (SDS-PAGE); these resolved samples were then transferred to nitrocellulose membranes. The nitrocellulose membranes were blocked for 2 hours and incubated with 1:1000 rabbit polyclonal antihuman TLR4 (Abcam, Cambridge, UK), MyD88 (Cell signaling, USA), and mouse monoclonal antihuman β-actin (Beyotime, Shanghai, China) overnight at 4°C. Thereafter, these membranes were washed and incubated at room temperature with a Horseradish Peroxidase (HRP)-conjugated anti-goat secondary antibody (Beyotime, Shanghai, China) for 90 minutes. The detection was performed using enhanced chemiluminescence (ECL) detection reagents and a ChemiDoc Imaging System (Bio-Rad Laboratories, Hercules, CA).
3.9. Hepatitis B Virus-DNA Titers Assay
Serum of HBV transgenic mice and cell supernatants of HepG2.2.15 were corrected; then lysis buffer was added into the HBV-DNA Detection Kit (Daangene, Guangzhou, China). The HBV-DNA levels were measured by RT-PCR, according to the manufacturer’s instructions. The threshold cycle values were used to determinate the concentration of HBV-DNA. This experiment was performed in triplicate.
3.10. Statistical Analysis
The data were expressed in terms of Mean ± SD. An unpaired t-test was performed to compare the expression levels of mRNA and protein with the respective levels observed in the control groups. The analyses were performed using GraphPad Prism 5 software (GraphPad Software, Inc. San Diego, CA, USA). The values of P < 0.05 were considered to be statistically significant.
4. Results
4.1. Establishment of Non-Alcoholic Fatty Liver Disease in Hepatitis B Virus Transgenic Mice
Compared with the HBV transgenic mice in the control group, the mice belonging to the HBV/NAFLD group gained weight gradually and experienced an elevation in serum aminotransferases, dyslipidemia, impaired fasting glucose, and abnormal liver histology within 8 to 24 weeks of the treatment. In the HBV/NAFLD group, the mice experienced significant macrovesicular and microvesicular steatosis within 8 weeks; they developed steatohepatitis in 16 weeks and steatohepatitis with peri-cellular fibrosis in 24 weeks. However, the control mice fed with standard chow showed normal liver histology during the treatment period that extended from 8 to 24 weeks. The results of serum biochemistry and hepatic histopathological analyses have been reported in our previous study (4).
4.2. Up-Regulated Expressions of Toll-like receptor 4 (TLR4), Myeloid differentiation factor 88 (MyD88), Interleukin 6 (IL-6) and Interferon-β (IFN-β) in Hepatitis B Virus/Nonalcoholic Fatty Liver Disease (HBV/NAFLD) Groups
As compared to that of HBV group, the HBV/NAFLD group demonstrated significantly higher expression of TLR4, MyD88, and IL-6 in the tissue samples analyzed for mRNA and protein levels at the end of 8, 16, and 24 weeks (P < 0.05) (Figures 1 and 2). The quantitative data for TLR4, MyD88, and IL-6 obtained by immunohistochemical staining we analyzed using Image Pro Plus 6.0. The Integrated Optical Density (IOD) values further confirmed the increased levels of TLR4, MyD88, and IL-6 in liver tissues, respectively, with the IOD values exemplifying a time-dependent manner (P < 0.05) (Figure 2). Moreover, the expressions of TLR4, MyD88, and IL-6 in the HBV/NAFLD group experienced obvious up-regulation during the HFD treatment (Figures 1 and 2). The mRNA and protein expressions of TNF-α in the HBV/NAFLD group also exhibited an increasing trend, though no significant, when compared with that in the HBV group at different time-points (Figure 1). Then, the significantly elevated levels of serum IFN-β were also detected at week 24 (Figure 1 G).
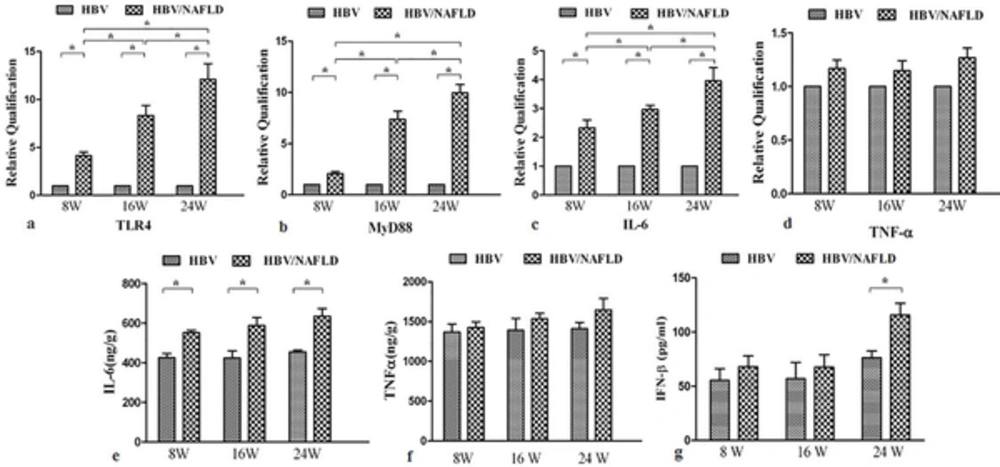
Figure 1.
A, B, C and D, RT-PCR showed mRNA expression changes of TLR4, MyD88, IL-6, and TNF-α in the livers of the HBV and HBV/NAFLD groups at 8, 16 and 24 weeks. E, and F, The concentration of pro-inflammatory cytokines (pg/g liver tissue) were measured by ELISA in liver homogenates of HBV and HBV/NAFLD groups at 8, 16, and 24 weeks. The data are expressed in terms of Mean ± Standard Error (SE) (n = 8), and all are normalized to HBV groups at different time-points.* P < 0.05.
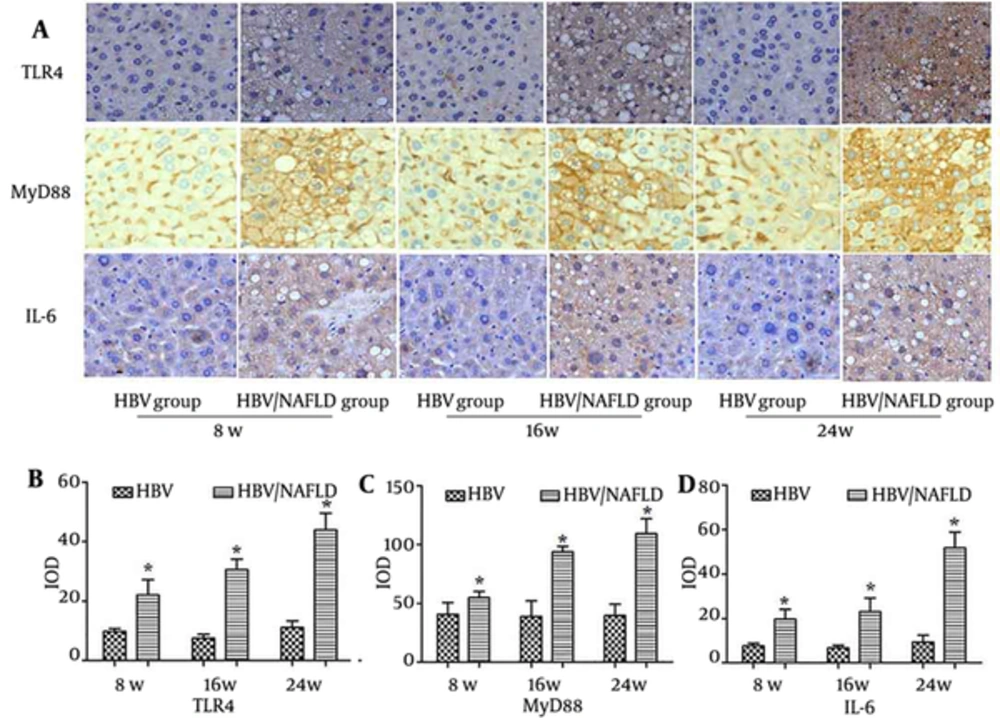
Figure 2.
A, the expression of TLR4, MyD88, and IL-6 in the livers of the HBV and HBV/NAFLD groups at 8, 16, and 24 weeks. Representative histological sections of immunohistochemistry (IHC) staining of livers were shown. B, C and D, quantitative data for TLR4, MyD88, and IL-6 immunohistochemical staining. Integrated optical densities (IOD) values of TLR4, MyD88, and IL-6 expression were determined using Image Pro Plus 6.0. Data are expressed as the Mean ± Standard Error (SE) (n = 8), and all are normalized to HBV groups at different time-points. * P < 0.05.
4.3. Up-Regulation of Toll-like receptor 4 (TLR4), Myeloid differentiation factor 88 (MyD88), Interleukin 6 (IL-6) and Tumor necrosis factor α (TNF-α) in Steatotic HepG2.2.15 Cells
The biological effects of SA (25 - 200 μM) were first analyzed using the cell proliferation assays. The data showed that SA (25-200 μM) promoted the HepG2.2.15 cell proliferation in a time-dependent manner. Furthermore, at different time points, the cell growth rate was relatively lower at 200 μM SA than at any other concentrations (Figure 3 B). Therefore, we adopted the time points of 48 hours for further experiments. After being exposed to 25 - 200 μM SA for 48 hours, both the number of Oil red-O staining positive droplets and the content of Triglyceride (TG) in cell lysates were significantly increased in HepG2.2.15 cells in a dose-dependent manner, compared to the control cells (Figure 3 A).
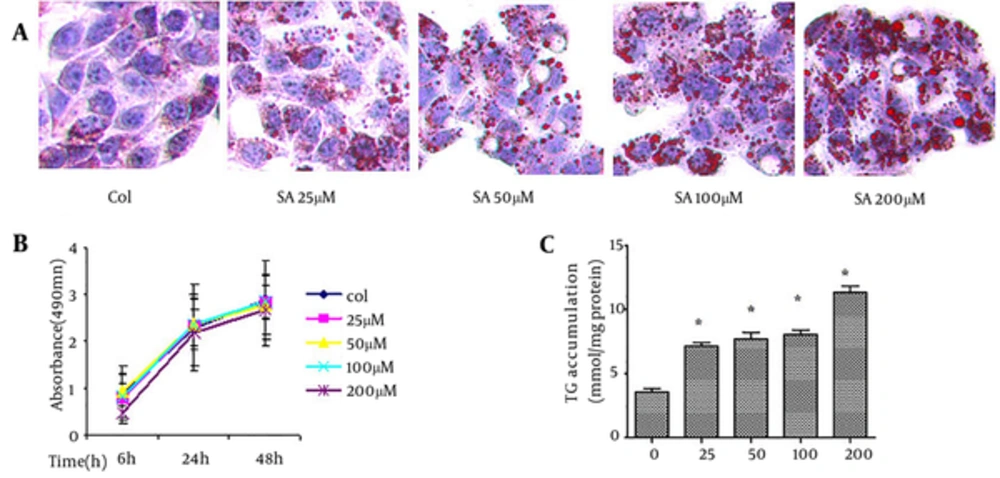
Figure 3.
A, Representative images show the lipid accumulation in HepG2.2.15 cells following SA treatment, as revealed by Oil Red O staining; B, Cell proliferation assay in HepG2.2.15 cells with/without SA incubation at 6 hours, 24 hours, and 48 hours; C, TG content (mmol/mg protein) measurement in HepG2.2.15 cells; data are expressed as the Mean ± Standard Error (SE) in triplicate. * P < 0.05.
Compared to the control cells, the mRNA and protein levels of TLR4 and MyD88 were higher in steatotic HepG2.2.15 cells at different concentrations of SA after 48 hour (Figure 4). The expression of downstream proinflammatory cytokines IL-6 and TNF-α also significantly increased in steatotic HepG2.2.15 cells (Figure 4). Then, the IFN-β expression levels were also detected in steatotic HepG2.2.15 cells, and cell supernatants showed that the level elevated remarkably especially at 50 - 200 μM concentrations of SA (Figure 4).
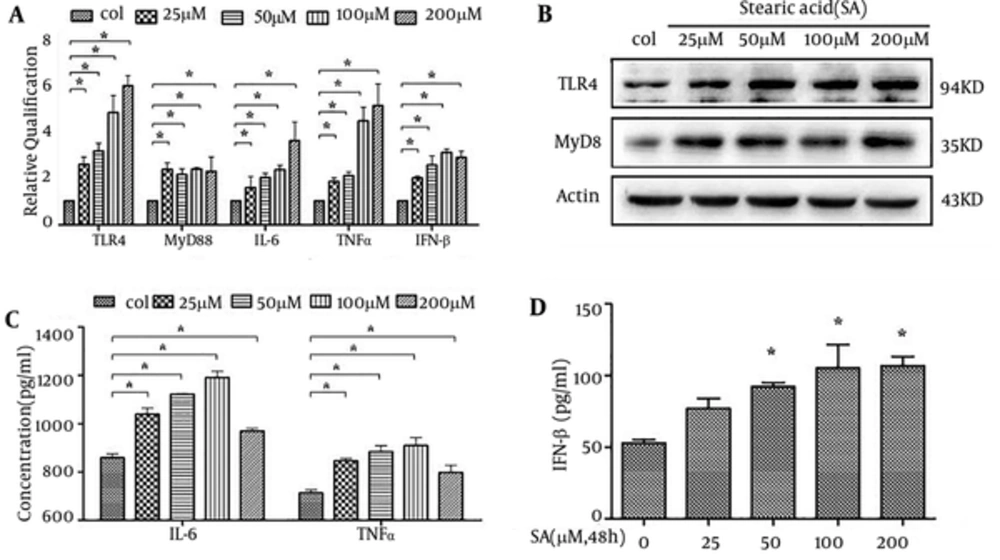
Figure 4.
A, RT-PCR showed mRNA expression changes of TLR4, MyD88, IL-6, TNF-α, and IFN-β in HepG2.2.15 cells with/without SA incubation for 48 hours; B, The expression of TLR4 and MyD88 proteins was analyzed by western blot in HepG2.2.15 cells with/without SA incubation for 48 hours; Also, C, D, The concentration of proinflammatory cytokines and IFN-β (pg/mL) were measured by ELISA in cell culture supernatants of HepG2.2.15 cells with/without SA incubation for 48 hours. Data are expressed as the Mean ± Standard Error (SE) in triplicate. * P < 0.05.
4.4. Viral Characterization in Hepatitis B Virus Transgenic Mice With Nonalcoholic Fatty Liver Disease and HepG2.2.15 Cells With Stearic Acid-Induced Steatosis
When compared to the HBV group, the viral indices (HBsAg, HBeAg and HBV-DNA) of the HBV/NAFLD group showed a decreasing tendency during the time-period of 8 - 16 weeks. Whereas significant decrease in the viral indices occurred at the end of the 24 weeks (Figure 5). However, there were no significant differences of HBsAg and HBeAg in the liver tissue that was obtained at different stages from the HBV and the HBV/NAFLD groups. The viral indices except HBsAg had no difference when compared at 16 weeks and 24 weeks to 8 weeks.
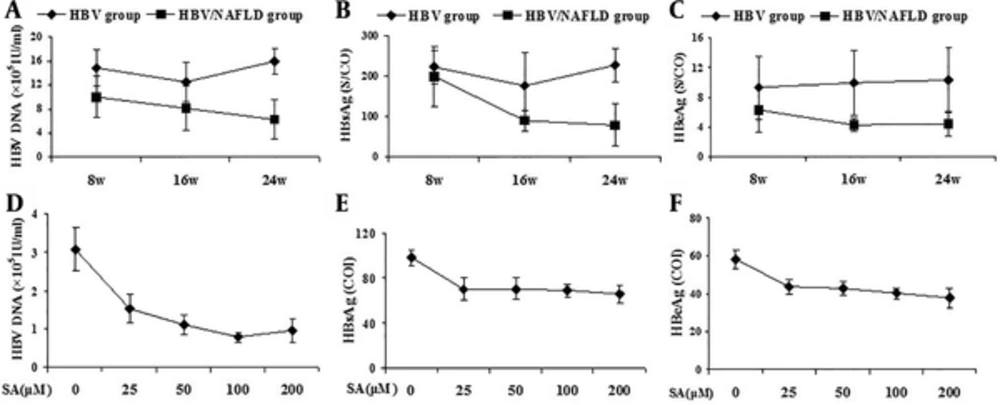
Figure 5.
A, B, C, effects of HFD on the serum viral dynamics (HBV DNA, HBsAg and HBeAg) of HBV transgenic mice; C, D, F, Effects of different concentrations of SA (25 μM, 50 μM, 100 μM, and 200 μM) on the supernatant viral dynamics of HepG2.2.15 cells. * P < 0.05.
After incubating HepG2.2.15 cells with 25 μM, 50 μM, 100 μM, and 200 μM SA for 48 hours, HBsAg, HBeAg, and HBV-DNA titers were determined. The results indicated that the viral dynamic exhibited a tendency of reduction in steatotic HepG2.2.15 cells, reducing significantly at 100 μM and 200 μM SA. This reduction in viral dynamics was not observed in HepG2.2.15 cells without SA (Figure 5).
5. Discussion
The pathogenesis of NAFLD in patients with chronic HBV infection is not well-understood, and for completely ethical and practical reasons, it has been difficult to conduct detailed mechanistic studies in humans. Therefore, great attempts have been made to develop in vivo and in vitro models of HBV infection with NAFLD in order to explore their pathogenesis and interaction. Some models have shown encouraging results. In this study, the HBV transgenic mice were immune-tolerant to HBV-related antigens as they had normal innate and acquired immunity and the liver histology of these mice was also normal (5, 21). HepG2.2.15 is an immortalized hepatocyte line established by the stable transfection of HBV ayw strain genome in HepG2 cells. In this study, we developed a model of NAFLD in HBV transgenic mice by continuously HFD. Furthermore, an in vitro steatosis developed in HepG2.2.15 cells treated with SA. These models closely resembled the occurrence of NAFLD in patients suffering from persistent chronic HBV infection.
There have been several evidences to indicate that TLRs plays a critical role in the pathogenesis and progression of many chronic liver diseases, such as chronic HBV and HCV infection, alcoholic liver disease, NAFLD/NASH, hepatic fibrosis, cirrhosis and liver cancer (22-24). Thirteen TLRs were identified in mammals and ten TLR members in human. Although it has reported that expression levels of TLR1-5 mRNA were significantly higher in livers of NAFLD patients in comparison to controls (25), and in fructose-induced hepatic steatosis mice, the levels of TLR1-9 increased remarkably in liver tissues (26), several studies have showed that TLR2, TLR4 and TLR9 played a role in the development of NAFLD (12, 13, 27, 28). In the HBV transgenic mice, injections of ligands of TLR3, TLR4, TLR5, TLR7 and TLR9 inhibit HBV replication in an IFN-β dependent manner. As we know, elevated circulating LPS and FFAs were detected in HFD-induced NAFLD models. Lipopolysaccharide was the typical and high affinity ligand to TLR4, and FFAs were also the potential ligands, which could be recognized by TLR4 and activated the downstream signal pathway.
Toll-like receptor 4 is a key component of the innate immune system and is widely expressed in all hepatic cell types, including hepatocytes, Kupffer cells, hepatic stellate cells, and sinusoidal endothelial cells. Several research studies have reported that the TLR4/MyD88 pathway is significantly associated with NAFLD (12-16, 29, 30). Myeloid differentiation factor 88 (MyD88) serves as an immediate adaptor for TLR4 in the signaling pathway, resulting in the production of TNF-α and IL-6, which are key regulatory molecules in the development and progression of NAFLD (15, 29-31).
Previous studies have shown that HBV-transgenic mice are chronic asymptomatic HBV carriers and are immune-tolerant to HBV-related antigens. In this study, we have also demonstrated that an HFD, rather than HBV infection, plays a vital role in the development of NAFLD in HBV-transgenic mice (4, 21, 32). Therefore, we hypothesized that the activation of TLR4/MyD88-mediated innate immune response may also be associated with HFD in HBV-transgenic mice. In support of this hypothesis, we established the model of HBV-transgenic mice with NAFLD and steatotic HepG2.2.15 cells to demonstrate the expressions of TLR4/MyD88 and prionflammatory cytokines. To our knowledge, this observation is significant as it is something that has been reported for the first time in reference to the HBV infection with NAFLD.
In our study, we observed that the activation of TLR4/MyD88 signaling was associated with elevated expression of IL-6 and TNF-α during the period 8, 16, and 24 weeks of HFD treatment. These results indicate that HFD induced hepatic inflammation through TLR4/MyD88 signaling in the HBV/NAFLD group. Recent studies uncovered that increased serum FFAs directly stimulate MyD88-dependent signaling pathway in hepatocytes (15, 16, 33). Therefore, HFD led to elevated levels of SFAs in circulation, thereby indicating that the activation of TLR4/MyD88 signaling may also play an important role in HBV transgenic mice with NAFLD. To confirm that SFAs induced the activation of TLR4/MyD88 signaling in vitro, SA was used to induce steatosis in cell lines of hepatocytes. HepG2.2.15 cells indeed expressed TLR4, MyD88 and proinflammatory cytokines (TNF-α and IL-6) in response to different concentrations of SA employed in our study. These experiments provide us with the evidence that SA serves as a TLR4 ligand and consequently activates TLR4/MyD88 signaling in hepatocytes with the HBV infection.
Previous studies revealed that HBV load was negatively associated with steatosis in CHB patients with NAFLD. In our study, we also found that the viral indices (HBsAg, HBeAg and HBV-DNA) in serum samples exhibited a tendency of decrease when they were obtained from HBV transgenic mice with NAFLD; this decrease in the viral indices was especially prominent at 24 weeks. Moreover, compared with the HBV group, a significantly increased IFN-β was detected in the serum samples obtained from the HBV/NAFLD group at 24 weeks. This indicates that the decreased viral indices may be associated with an increased IFN-β, although the level of IFN-β has no significantly increased at 8 or 16 weeks. It has been reported that TLR4-mediated suppression of HBV replication in nonparenchymal liver cells is MyD88-independent, which can also be initiated by TLR4 activation leading to the production of IFN-β. Therefore, we speculated that LPS and FFAs, which increased in number in HBV transgenic mice with NAFLD, were sensed by TLR4 and activated through MyD88-independent pathway to form the product IFN-β that inhibits HBV replication. The data of SA-induced steatosis in HepG2.2.15 cells were similar to that of the HBV/NAFLD group. The IFN-β levels were elevated and the viral indices were reduced in steatoric cells, indicating that HepG2.2.15 cells were responsive to TLR4 stimulation and had the ability to produce IFN-β through TLR4/MyD88-independent pathway in response to SFAs. In addition, the TNF-α and IL-6 levels elevated in the HBV transgenic mice with experimental NAFLD and HepG2.2.15 cells with steatotic generation. Moreover, TNF-α and IL-6 have been reported to be the antiviral mediators (20, 34). Then it is indicated that IL-6 and TNF-α may be another contributors inhibiting HBV replication; thus, activation of TLR4 signaling pathway may suggested to be a vital mechanism to reduce HBV-DNA and HBV-related antigens in mice with both chronic HBV infection and NAFLD.
In conclusion, we have demonstrated that the TLR4/MyD88 signal pathway was activated in the HBV-transgenic mice with NAFLD and HepG2.2.15 cells with SA-induced steatosis. These results further shed light on an action model in which SFA or LPS activates TLR4, in vivo and in vitro, which initiates the TLR4/MyD88 signaling and finally the production of proinflammatory cytokines. Therefore, the TLR4-mediated innate immune response may contribute to the inhibited HBV replication in experimental model with both CHB and NAFLD.