
1. Background
Coronary artery disease (CAD) and ST-segment elevation myocardial infarction (STEMI) are among the leading causes of mortality in developed countries (1). Acute myocardial infarction (MI) can lead to complex changes in left ventricular (LV) structure, ultimately resulting in left ventricular remodeling (LVr). In many STEMI patients, LVr begins during the acute phase of myocardial ischemia. These complications significantly impact LV function and patient prognosis. Therefore, early detection of patients at risk for LVr has both prognostic and therapeutic benefits (2, 3).
Speckle tracking echocardiography (STE) is a novel, non-invasive imaging technique that quantitatively analyzes global and regional myocardial function. Recently, STE has been utilized to predict LVr or post-MI heart failure. One of the indices evaluated through STE is the Post Systolic Shortening Index (PSSI), which relates to the heart’s delayed ejection motion following aortic valve closure. Quantitative assessment of myocardial longitudinal strain allows for the detection of subtle changes in contraction function, such as post systolic shortening (PSS). The PSS has been observed in ischemic myocardium and reported as a prognostic factor for myocardial viability (4-7).
This study was conducted to evaluate the predictive power of PSSI concerning LVr and left ventricular ejection fraction (LVEF) improvement in STEMI patients. While primary percutaneous coronary intervention (PPCI) is the gold standard treatment for STEMI, fibrinolytic therapy is still employed in many medical centers lacking PPCI capability. STEMI management guidelines recommend coronary angiography and PCI (if necessary) within 3 - 24 hours after successful fibrinolytic therapy. However, many patients do not receive PCI within the recommended period following fibrinolytic therapy. Although numerous studies have considered PPCI within 24 hours after fibrinolytic therapy to be successful, few studies have examined PCI outcomes more than 24 hours post-fibrinolytic therapy. Therefore, the long-term benefits beyond the recommended time interval remain unknown (8, 9).
2. Objectives
Therefore, the present study aims to investigate the capability of STE and PSSI to predict LVr, LVEF improvement, and detect viable myocardium in STEMI patients who underwent PCI after 24 hours (late PCI), thereby identifying patients who may benefit from late PCI.
3. Methods
3.1. Patient Selection
Forty-seven patients with STEMI and Q-ST elevation in V1-V4 precordial leads on electrocardiogram (ECG) who underwent late percutaneous coronary intervention (PCI) were included in this study. The diagnosis of acute MI was based on typical ECG changes, ischemic chest pain, and elevated cardiac biomarkers. Patients with a history of cardiomyopathy, moderate or severe valvular heart disease, age less than 18 years, morbid obesity (Body Mass Index > 40), and incompatible echocardiographic views were excluded.
3.2. Study Design and Ethics
This prospective cohort study was conducted in patients referred to the emergency department of Fatemeh Zahra Cardiovascular Hospital in Sari, North of Iran, between 2020 and 2021. All patients were diagnosed with STEMI, with symptoms present for at least 24 hours before admission. These patients received medical treatment at this center or elsewhere before undergoing PCI. History, physical examinations, ECG, and necessary laboratory data were collected from all patients at admission, and transthoracic echocardiography (TTE) was performed. All patients received standard doses of antiplatelet, anticoagulant, and statin medications before undergoing late PCI. Six weeks post-PCI, TTE was repeated for all patients. The study’s goals and structure were explained to the patients, and written consent was obtained. This study was registered and approved by the Vice President of Research Ethics Committee of Mazandaran University of Medical Sciences before its implementation (IR.MAZUMS.REC.1400.246).
3.3. Transthoracic Echocardiography, Speckle Tracking Echocardiography, and Outcome Measures
The first echocardiography was performed before PCI at the early hours of admission, and the second was conducted 6 weeks post-PCI. Left ventricular end-diastolic volume (LVEDV) and left ventricular end-systolic volume (LVESV) were measured, and LVEF was calculated using the modified Simpson formula: (LVEDV - LVESV)/(LVEDV) × 100. Left ventricular remodeling was defined as more than a 15% increase in LVESV 6 weeks after STEMI. The Wall Motion Score Index (WMSI) was also measured. The LV was divided into 16 segments, each analyzed using a semi-quantitative scoring system (normal: 1, hypokinesia: 2, akinesia: 3, dyskinesia: 4). The overall WMSI was calculated by summing the scores of all segments and dividing by the number of segments.
The STE analysis was performed using Siemens Acuson SC2000 commercial software. The endocardial and epicardial edges were manually traced at the end of diastole, and the software automatically tracked these edges throughout the cardiac cycle. The LV myocardium was divided into 6 regions per view. After confirming suitable tracking, the software calculated each region’s strain and the total strain. Left ventricular global longitudinal strain (GLS) was calculated as the average of apical 4-chamber, 3-chamber, and 2-chamber views. The GLS was determined as the average value of maximum systolic shortening in 18 regions of the left ventricle. Post-systolic shortening (PSS) is defined as shortening after aortic valve closure and can occur in approximately one-third of myocardial segments in healthy individuals, so it is not always indicative of disease (10). Based on previous studies, the PSSI was defined as: 100% × (maximum post-systolic strain – end-systole strain)/maximum post-systolic strain. If maximum longitudinal shortening occurs during systole and PSS is not observed, PSSI is set to zero. The overall PSSI is calculated as an average of 18 myocardial regions (11).
3.4. Statistical Analysis
Echocardiographic evaluations were performed by an echocardiologist who was blinded to the identity of the patients and their clinical conditions. Data were recorded and statistically analyzed using SPSS version 22. Quantitative variables are expressed as mean and standard deviation, while qualitative data are presented as frequency and percentage. The normal distribution of the data was confirmed using the Kolmogorov-Smirnov test. Differences in quantitative data between groups were evaluated using the Student’s t-test, and qualitative data were assessed using the chi-squared test or Fisher’s exact test. A P-value of less than 0.05 was considered statistically significant. Variables with a P-value of less than 0.05 were included in multivariable logistic regression analysis to identify factors directly related to LVr, LVEF, and GLS. Receiver Operating Characteristic (ROC) curves were also plotted to determine the best PSSI cutoff point in relation to LVr, LVEF, and GLS.
4. Results
4.1. Study Population
Table 1 summarizes the baseline demographic and clinical characteristics of the study population. Forty-seven patients, aged between 44 and 71 years (mean: 56.36 years), were included in the study. Among the participants, 34 were men (72.3%) and 13 were women (27.7%). Twenty patients (42.5%) had hypertension, 17 (36.1%) had hyperlipidemia, 16 (34.0%) had diabetes mellitus, and 14 (29.7%) had a history of smoking.
Table 1.
Baseline Demographic and Clinical Characteristics of the Study Population a
| Variables | Values |
|---|---|
| Age; y (IQR) | 56.36 (44.0 - 71.0) |
| Sex | |
| Male | 34 (72.3) |
| Female | 13 (27.7) |
| Body Mass Index; kg/m2 (IQR) | 22.24 (18.6 - 26.0) |
| Hypertension | 20 (42.5) |
| Hyperlipidemia | 17 (36.1) |
| Diabetes mellitus | 16 (34.0) |
| Cigarette smoking | 14 (29.7) |
| PSSI | 20.57 ± 10.24 |
| LVEF | 34.04 ± 10.21 |
| LVEDV (mL) | 148.40 ± 38.45 |
| LVESV (mL) | 94.89 ± 36.96 |
| Left ventricular GLS | -8.61 ± 4.13 |
| WMSI | 1.57 ± 0.37 |
Abbreviations: IQR, interquartile range; PSSI, Post Systolic Shortening Index; LVEF, left ventricular ejection fraction; LVEDV, left ventricular end diastolic volume; LVESV, left ventricular end systolic volume; GLS, global longitudinal strain; WMSI, Wall Motion Score Index.
a Values are expressed as No. (%) or mean ± SD unless otherwise indicated.
Cardiac function parameters were evaluated before and after PCI. As shown in Table 2, the values of PSSI, LVEDV, GLS, and WMSI parameters showed significant differences (P < 0.05) before and after PCI. The PSSI parameter value decreased significantly after PCI (P < 0.05). The observed difference in LVESV before and after PCI was not statistically significant (P = 0.55).
Table 2.
Mean Standard Deviation of Cardiac Parameters, Before and After Percutaneous Coronary Intervention a
| Parameters | Time | Diff (95% CI) | P-Value b | |
|---|---|---|---|---|
| Before PCI | After PCI | |||
| PSSI | 20.57 ± 10.24 | 16.26 ± 10.6 | 4.32 (2.72 - 5.92) | 0.01 |
| LVEF | 34.04 ± 10.21 | 38.89 ± 11.93 | 4.84 (3.42 - 6.26) | 0.03 |
| LVEDV (mL) | 148.40 ± 38.45 | 135.85 ± 39.42 | 12.55 (1.59 - 23.51) | 0.01 |
| LVESV (mL) | 94.89 ± 36.96 | 85.75 ± 33.91 | 9.14 (1.58 - 16.70) | 0.55 |
| Left ventricular GLS | -8.61 ± 4.13 | -10.80 ± 5.24 | 2.18 (1.53 - 2.84) | 0.03 |
| WMSI | 1.57 ± 0.37 | 1.48 ± 0.41 | 0.09 (0.03 - 0.21) | 0.04 |
Abbreviations: CI, confidence interval; PCI, percutaneous coronary intervention; PSSI, Post Systolic Shortening Index; LVEF, left ventricular ejection fraction; LVEDV, left ventricular end diastolic volume; LVESV, left ventricular end systolic volume; GLS, global longitudinal strain; WMSI, Wall Motion Score Index.
a Values are expressed as mean ± SD.
b A P-value of ≤ 0.05 is considered statistically significant.
4.2. Outcome Measures
4.2.1. Left Ventricular Remodeling After Percutaneous Coronary Intervention
Left ventricular remodeling was observed in 15 patients (31.9%) after PCI. The status of the patients based on the incidence of LV remodeling is shown in Table 3. The average pre-PCI PSSI in patients with LV remodeling was significantly lower (P = 0.005) than in the opposite group (patients without remodeling), while the average pre-PCI LVEF was significantly higher (P = 0.002) in patients with LV remodeling. The average of the other parameters (including LVEDV, LVESV, GLS, and WMSI) was also significantly lower (P < 0.05) in patients with LV remodeling compared to the opposite group.
Table 3.
The Status of the Patients Based on the Incidence of Outcome Measures (Left Ventricular Remodeling) a
| Variables | LVr | P-Value b | |
|---|---|---|---|
| No (n = 32) | Yes (n = 15) | ||
| PSSI | 22.5 (15.5 - 30) | 15 (8 - 18) | 0.005 |
| LVEF | 28 (25 - 40) | 45 (35 - 45) | 0.002 |
| LVEDV (mL) | 155 (133.25 - 188.50) | 130 (110 - 145) | 0.003 |
| LVESV (mL) | 102.50 (73.5 - 119.5) | 75 (60 - 100) | 0.04 |
| Left ventricular GLS | -6 [-12 - (-4)] | -12 [-14 - (-10)] | 0.005 |
| WMSI | 1.80 (1.3 - 2) | 1.20 (1.2 - 1.4) | 0.003 |
Abbreviations: LVr, left ventricular remodeling; PSSI, Post Systolic Shortening Index; LVEF, left ventricular ejection fraction; LVEDV, left ventricular end diastolic volume; LVESV, left ventricular end systolic volume; GLS, global longitudinal strain; WMSI, Wall Motion Score Index.
a Values are expressed as interquartile range (IQR).
b A P-value of ≤ 0.05 is considered statistically significant.
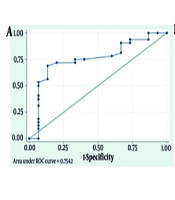
The results indicate that pre-PCI PSSI can predict LVR after PCI based on the ROC diagram (Figure 1A), with an AUC of 0.74 (95% CI: 0.6 - 0.91; P = 0.005). To designate the appropriate cut point of pre-PCI PSSI for predicting LV remodeling, the sensitivity, specificity, accuracy, and positive and negative predictive values of each PSSI point were calculated. The highest accuracy percentage (74.47%) was found at cut points 19 and 20. Cut point 19 of pre-PCI PSSI level has a sensitivity and specificity of 71.88% and 80%, respectively, while cut point 20 has a sensitivity and specificity of 68.75% and 86.67%, respectively.

Figure 1.
Receiver operating characteristic (ROC) curve: A, diagnostic value of pre- percutaneous coronary intervention (PCI) Post Systolic Shortening Index (PSSI) for predicting left ventricular remodeling (LVr); B, left ventricular ejection fraction (LVEF) improvement; and C, left ventricular global longitudinal strain (GLS) improvement.
4.2.2. Left Ventricular Ejection Fraction Improvement After Percutaneous Coronary Intervention
Improvement in LVEF occurred in 23 patients (48.9%) after PCI. As shown in Table 4, the average PSSI in patients with improved LVEF was significantly higher (P = 0.004) than in the opposite group. Additionally, the differences in the average parameters of GLS and WMSI were statistically significant (P < 0.05). The pre-PCI PSSI can predict LVEF improvement after PCI based on the ROC diagram (Figure 1B), with an AUC of 0.75 (95% CI: 0.6 - 0.89; P = 0.004). Cut point 19 of pre-PCI PSSI has the highest accuracy percentage (72.34%) for predicting LVEF improvement after PCI, with 78.26% sensitivity and 66.67% specificity.
Table 4.
The Status of the Patients Based on the Incidence of Outcome Measures (Improved Left Ventricular Ejection Fraction) a
| Variables | Improved LVEF | P-Value b | |
|---|---|---|---|
| No (n = 24) | Yes (n = 23) | ||
| PSSI | 15 (11.25 - 20) | 23 (19 - 31) | 0.004 |
| LVEF | 40 (30 - 45) | 27 (24 - 45) | 0.13 |
| LVEDV (mL) | 143.50 (127 - 156.75) | 142 (133 - 171) | 0.74 |
| LVESV (mL) | 87 (70 - 11.50) | 100 (60 - 115) | 0.66 |
| Left ventricular GLS | -12 [-14 - (-7.750)] | -6 [-10 - (-4)] | < 0.001 |
| WMSI | 1.30 (1.20 - 1.75) | 1.90 (1.30 - 2.00) | 0.02 |
Abbreviations: LV, left ventricular; PSSI, Post Systolic Shortening Index; LVEF, left ventricular ejection fraction; LVEDV, left ventricular end diastolic volume; LVESV, left ventricular end systolic volume; GLS, global longitudinal strain; WMSI, Wall Motion Score Index.
a Values are expressed as interquartile range (IQR).
b A P-value of ≤ 0.05 is considered statistically significant.
4.3. Global Longitudinal Strain Improvement After Percutaneous Coronary Intervention
The GLS improvement after PCI was observed in 25 patients (53.1%). The condition of the patients based on their GLS improvement is shown in Table 5. The average pre-PCI PSSI in patients who had improved GLS was significantly lower (P < 0.001) than in the opposite group (patients without improved GLS). The ROC diagram (Figure 1C) shows that the level of pre-PCI PSSI can predict the improvement of GLS after PCI, with an AUC of 0.98 (95% CI: 0.96 - 1; P < 0.001). Cut point 20 of pre-PCI PSSI level has the highest accuracy percentage (95.74%) for predicting GLS improvement after PCI, with 100% sensitivity and 92% specificity.
Table 5.
The status of the patients based on the incidence of outcome measures. Improved global longitudinal strain
| Variables | Improved GLS | P-Value b | |
|---|---|---|---|
| No (n = 22) | Yes (n = 25) | ||
| PSSI | 28 (21.75 - 34) | 13 (8.5 -1 7.5) | < 0.001 |
| LVEF | 25 (23 - 27) | 45 (40 - 45) | < 0.001 |
| LVEDV (mL) | 165.5 (139.5 - 192.5) | 131 (120 - 150) | 0.001 |
| LVESV (mL) | 111.5 (88.75 - 139) | 75 (61 - 99) | 0.001 |
| Left ventricular GLS | -4 [-6 - (-3.75)] | -12 [-13 - (-11.5)] | < 0.001 |
| WMSI | 1.90 (1.87 - 2.10) | 1.20 (1.20 - 1.30) | < 0.001 |
Abbreviations: LV, left ventricular; PSSI, Post Systolic Shortening Index; LVEF, left ventricular ejection fraction; LVEDV, left ventricular end diastolic volume; LVESV, left ventricular end systolic volume; GLS, global longitudinal strain; WMSI, Wall Motion Score Index.
a Values are expressed as interquartile range (IQR).
b A P-value of ≤ 0.05 is considered statistically significant.
5. Discussion
The present study results demonstrate the capability of STE and PSSI to identify viable myocardium, predict LVEF improvement, and assess LV remodeling in STEMI patients who underwent late PCI. Previous studies have shown that PSS obtained through STE provides prognostic information about the risk of major adverse cardiovascular events (MACE), heart failure, and death in the general population (12, 13). Some studies also indicate that PSS provides independent diagnostic information about significant CAD in patients with stable ischemic heart disease and can predict subsequent cardiovascular events (14). Lu et al. demonstrated that the prognostic value of PSS in these patients may be higher than GLS (15). Studies on diabetic patients have shown that PSS predicts subsequent cardiac events and provides prognostic information in these patients (16, 17).
While previous studies have indicated that GLS and PSS are strong indices for predicting the development of heart failure in acute coronary syndrome patients who underwent PCI (18, 19), the distinguishing aspect of our study is the assessment of PSS as a factor to predict LVEF improvement, LV systolic function recovery, and identify viable myocardium. Our study showed that LV segments with higher PSS and PSSI had better recovery after PCI, and patients with improved LVEF and no LV remodeling had higher total PSSI. In fact, it is possible that maximum shortening of ischemic segments with severely reduced wall motion does not occur during systole but may happen after aortic valve closure (PSS). Therefore, the higher this PSS is, the more likely the segment is viable.
Evaluating myocardial viability is one of the most important clinical indications for STE. Improvement of GLS during dobutamine stress echocardiography (DSE) is indicative of myocardial viability, which has diagnostic and prognostic value (20). In 2009, Fujimoto et al. showed that in patients with a history of old MI, PSS changes during DSE can help identify hibernating myocardium and distinguish it from damaged myocardium (21). Another study in 2011 on STEMI patients who underwent primary PCI showed that GLS obtained through STE is a predictor of LV remodeling, and there is also a moderate correlation between the level of longitudinal peak strain and irreversible dysfunctional segments (22).
Our study demonstrated that PSS is a significant factor in ischemic myocardium in STEMI patients and, when associated with reduced wall motion, indicates potentially viable myocardium. This finding is consistent with the results of previous studies (5, 23). In the present study, we aimed to evaluate the presence of potentially viable myocardium in STEMI patients who do not undergo PPCI by quantifying the contractile function of the ischemic myocardium and PSS through the PSSI to identify patients who may benefit from late PCI.
In a similar study, Tao Cong et al. in 2014 showed that GLS measured by STE is a strong predictor of LV remodeling in STEMI patients who underwent late PCI, predicting LV remodeling at a cut point of -10.85 with high sensitivity and specificity (3). The results of our study align with these findings in terms of the indices assessed by STE. Additionally, the determinative role of PSSI in predicting LVEF improvement and the incidence of LV remodeling has been highlighted. Our study indicates that pre-PCI PSSI can predict LV remodeling and LVEF improvement after late PCI. The ROC curves showed that pre-PCI PSSI was higher in patients with improved LVEF and no LV remodeling after late PCI, with the best cutoff value for predicting LVEF improvement being 19%, offering the highest diagnostic accuracy.
5.1. Conclusions
The present study demonstrated that in patients with STEMI who undergo late PCI (after 24 hours), STE indicators, including the PSSI, can predict LV remodeling, LVEF improvement, and recovery of LV systolic function, thereby identifying viable myocardium.
5.2. Study Limitations
The first limitation of this study was the relatively small population and the restriction of STEMI cases to anterior circulation. The second limitation was the absence of cardiac magnetic resonance imaging (CMR) to evaluate the longitudinal strain of the myocardium and compare it to STE data. The third limitation was the lack of follow-up coronary angiography to assess the patency of PCI sites during the study.