
1. Background
The age of menarche and the age of menopause are two important stages in women's reproductive life (1). Menarche is defined as the first menstruation of a girl and can be regarded as a marker of puberty, after which ovarian and other endocrine functions related to reproduction begin (2). The prevalence of early menarche (≤ 11 years) has increased worldwide (3-5). An early age of menarche has been shown to be associated with a high risk of cardiovascular disease (CVD) and its risk factors in women, in a number of primary studies conducted in Western countries (6, 7) including hypertension (HTN) or high blood pressure (BP) (8). Also, the age of menarche is linked to the risk of CVDs (9). The next clinically significant stage of a woman's life, as defined by the World Health Organization, is menopause, which is characterized by amenorrhea for at least 12 consecutive cycles. The average age of women at menopause is 51, though 4% of women experience natural menopause at less than forty years of age (10). Both the ages of menarche and menopause have been shown to be associated with BP and/or HTN in previous studies. Among children and adolescents, early menarche is associated with higher BP and risk for HTN (11). Hypertension is an important cause of CVDs and death and has been recognized as a public health concern worldwide (12, 13). Menopause has also been associated with increased salt sensitivity of BP (14). Nevertheless, another study conducted in Shanghai stated that there was no association between age of menarche and total CVD (15).
2. Objectives
Although the above-mentioned studies have been conducted investigating the relationship between the age of menarche and HTN, the heterogeneity of the studies motivated us to bridge the gap. Therefore, in the present study, we aimed to investigate the relationship between the age of menarche and menopause and HTN in menopausal women.
3. Methods
We utilized a cross-sectional study conducted among a population of postmenopausal women who referred to Dr. Heshmat Hospital during 2020 - 2021 in Rasht. Eligible people were selected to enter the study by the available sampling method. The inclusion criteria in the study included menopause only if the participants have reached this stage of life naturally in the last year, no cancer, no HTN before menopause, no menopause following uterine and ovarian disease and surgery. On the other hand, the exclusion criteria were the inability to remember the age of menarche and menopause, history of HTN during pregnancy, thyroid problems, calcium, phosphorus, serum creatinine disorders, kidney problems and kidney dysfunction, and secondary HTN. Overall, 1590 women with HTN participated in this study. In general, 90 women were excluded from the study since they did not meet the inclusion criteria. In the end, a sample size of 1500 women was included in the analysis. Informed consent was obtained from all patients. The required sample size for the study was determined based on the findings of Zhou et al. (16), considering age at menarche as an influential factor on HTN [OR: 1.15, 95% CI: 1.11 - 1.19], and a HTN prevalence of 56% among postmenopausal women. Using the following sample size formula with a 95% confidence level and 80% statistical power, the minimum sample size was calculated to be 1590 postmenopausal women.
1 – α = 0.95; 1 – β = 0.80; P = 56.0%; OR = 1.15 (age at menarche)
The collected information in the present study includes demographic variables (age, education level, and place of residence). Fertility factors (number of births, number of live children, use of oral contraceptive pill (OCP) or hormone replacement therapy (HRT), and Body Mass Index (BMI) were measured. The nurse collected the blood sample to measure hemoglobin A1c (HbA1c), fasting blood sugar (FBS), triglyceride-cholesterol, high-density lipoprotein (HDL), and low-density lipoprotein (LDL). In addition, the BP was measured with a calibrated digital device (Tech Model MA100). At first, the participants rested for 10 minutes before the BP check, did not use cigarettes or liquids for half an hour before the BP measurement, and their bladders were empty. The patient sat on a chair and BP was measured from the right arm. High systolic blood pressure (SBP) was considered higher than 140 and high diastolic blood pressure (DBP) was considered higher than ninety (17). This study was reported according to STROCSS criteria (17). The collected data were input into the statistical software IBM SPSS Statistics for Windows version 21.0. The descriptive results were presented by mean ± standard deviation (SD) for quantitative variables with normal distribution and by median (interquartile range) for quantitative variables without normal distribution. Categorical variables were described using frequency (percentage). Skewness and kurtosis values, Q–Q plot, and boxplot were used to determine the normal distribution of data. The t-test or Mann-Whitney test was used to compare quantitative variables. Pearson’s correlations (or Spearman's correlation) and adjusted logistic regression analyses were used to assess the relationships between age of menarche and menopause and BP (systolic and diastolic BP). The statistical significance was set at 0.05.
4. Results
The characteristics of the participants of the study are reported in Table 1. Participants aged 50.38 ± 3.76 years on average. Most of the women (80.7%) were married and lived with their spouses. A substantial proportion (14.7%) of women were illiterate, and only 10.9% had a high school or above education. The participants were, on average, normally weighed with a mean BMI of 26.88 ± 2.35 kg/m². The mean ages at menarche and menopause were 11.15 ± 1.2 and 49.38 ± 3.76 years, respectively.
Table 1.
Baseline Demographic, Clinical Characteristics of the Study Population
| Variables | Study Population (N = 1500) a |
|---|---|
| Age (y) | 49.00 (48.00 - 51.00) |
| BMI (kg/m2) | |
| 18.5 - 24.9 | 444 (29.6) |
| 25 - 29.9 | 959 (63.9) |
| ≥ 30 | 97 (6.5) |
| Education | |
| Illiterate | 221 (14.7) |
| Diploma | 1116 (74.4) |
| College education | 163 (10.9) |
| Location | |
| City | 864 (57.6) |
| Village | 636 (42.4) |
| Triglyceride (mg/dL) | 82.00 (49.00 - 120.00) |
| Total cholesterol (mg/dL) | 130.00 (110.00 - 168.00) |
| LDL (mg/dL) | 121.00 (111.00 - 124.00) |
| HDLb (mg/dL) | 36.00 (34.00 - 38.00) |
| FBSc (mg/dL) | 99.72 ± 12.71 |
| Menarche age (y) | 11.15 ± 1.20 |
| Menopausal age (y) | 48.00 (47.00 - 50.00) |
| Number of children | 2.00 (1.00 - 2.00) |
| Parity | 2.00 (1.00 - 2.00) |
| OCP | |
| Yes | 878 (58.5) |
| No | 622 (41.5) |
| BP (mmHg) | |
| High systolic BP | 1053 (70.2) |
| High diastolic BP | 47 (3.1) |
| Both systolic and diastolic HTN | 31 (2.1) |
Abbreviations: OCP, oral contraceptive pill; LDL, low-density lipoprotein; HDL, high-density lipoprotein; FBS, fasting blood sugar; HTN, hypertension; BP, blood pressure; BMI, Body Mass Index.
a Values are showed in frequency (%), mean ±SD or median (interquartile range).
The frequency of high SBP, high diastolic blood pressure, and both systolic and DBP in postmenopausal women was reported as 70.2%, 3.1%, and 2.1%, respectively. No statistical difference was observed between the menarche age and menopausal age of postmenopausal women with high systolic as well as DBP and normal BP (Table 2).
Table 2.
Comparison of Menopause Age Between Postmenopausal Women with High Systolic and Diastolic Blood Pressure and Normal Blood Pressure
| Variables | Frequency (%) | Menarche Age (y) Mean ± SD | P-Value a | Menopausal Age (y) Median (Interquartile Range) | P-Value b |
|---|---|---|---|---|---|
| High SBP (mmHg) | 0.227 | 0.225 | |||
| Yes | 1053 (70.2) | 11.13 ± 1.20 | 48.00 (47.00 - 50.00) | ||
| No | 447 (29.8) | 11.21 ± 1.18 | 48.00 (47.00 - 50.00) | ||
| High DBP (mmHg) | 0.317 | 0.145 | |||
| Yes | 47 (3.1) | 10.98 ± 1.07 | 48.00 (46.00 - 49.00) | ||
| No | 1453 (96.9) | 11.16 ± 1.20 | 48.00 (47.00 - 50.00) |
Abbreviation: SBP, systolic blood pressure; DBP, diastolic blood pressure.
a Independent t-test (menarche age and high systolic), P < 0.05 significance level.
b Mann-Whitney Test (menopausal age diastolic blood pressure).
The results of the correlation between the age of menarche and menopause and SBP presented in Table 3 revealed that there was a very weak negative correlation between the age of menarche and SBP (r = -0.094, P < 0.001) (Table 3).
Table 3.
Correlation of Age of Menarche and Menopause with Systolic and Diastolic Blood Pressure (N = 1500)
| Variables | SBP (mmHg) | DBP (mmHg) | ||
|---|---|---|---|---|
| r | P-Value | r | P-Value | |
| Menarche age (y) | -0.094 a | < 0.001 | -0.030 b | 0.250 |
| Menopausal age (y) | 0.010 a | 0.690 | 0.049 a | 0.058 |
Abbreviations: SBP, systolic blood pressure; DBP, diastolic blood pressure.
a Spearman's correlation coefficient.
b Pearson's correlation coefficient.
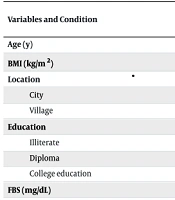
Table 4 presents adjusted associations between age at menarche and menopause with systolic and DBP in postmenopausal women. No significant associations were found between age at menarche (systolic BP OR: 0.926, 95% CI: 0.833 - 1.029, P = 0.153; diastolic BP OR: 0.896, 95% CI: 0.692 - 1.161, P = 0.407) or age at menopause (systolic BP OR: 1.001, 95% CI: 0.967 - 1.035, P = 0.974; diastolic BP OR: 0.956, 95% CI: 0.874 - 1.046) with BP measures. Systolic blood pressure was significantly higher in women living in cities (OR: 2.502, 95% CI: 1.903 - 3.288, P < 0.001), illiterate women (OR: 2.109, 95% CI: 1.349 - 3.298, P = 0.001), those with diploma education (OR: 1.645, 95% CI: 1.088 - 2.489, P = 0.018), higher LDL cholesterol (OR: 1.020, 95% CI: 1.015 - 1.026, P < 0.001), higher HDL cholesterol (OR: 1.013, 95% CI: 1.004 - 1.021, P = 0.002), and increased number of children (OR: 1.324, 95% CI: 1.105 - 1.585, P = 0.002). Diastolic blood pressure was significantly associated with higher BMI (OR: 1.156, 95% CI: 1.024 - 1.305, P = 0.019), but not with other variables. Use of OCPs showed no significant effect on DBP (OR: 1.479, 95% CI: 0.809 - 2.703, P = 0.203) (Table 4).
Table 4.
Relationship Between Age of Menarche and Menopause with Systolic and Diastolic Blood Pressure in Postmenopausal Women
| Variables and Condition | Adjusted SBP (mmHg) | Adjusted DBP (mmHg) | ||
|---|---|---|---|---|
| OR Adjusted (95% CI) | P-Value a | OR Adjusted (95% CI) | P-Value a | |
| Age (y) | - | - | - | - |
| BMI (kg/m2) | (0.906 - 1.007) 0.995 | 0.087 | 1.156 (1.024 - 1.305) | 0.019 |
| Location | ||||
| City | 2.502 (1.903 - 3.288) | < 0.001 | - | - |
| Village | 1 | - | - | |
| Education | ||||
| Illiterate | 2.109 (1.349 - 3.298) | 0.001 | - | - |
| Diploma | 1.645 (1.088 - 2.489) | 0.018 | - | - |
| College education | 1 (ref) | - | - | - |
| FBS (mg/dL) | 0.971 (0.959 - 0.983) | < 0.001 | 1.011 (0.981 - 1.042) | 0.481 |
| Triglyceride (mg/dL) | 0.997 (0.994 - 1.000) | 0.073 | 1.006 (1.000 - 1.013) | 0.066 |
| Total cholesterol (mg/dL) | 1.002 (0.998-1.005) | 0.419 | - | - |
| LDL (mg/dL) | 1.020 (1.015 - 1.026) | < 0.001 | - | - |
| HDL (mg/dL) | 1.013 (1.004 - 1.021) | 0.002 | - | - |
| Menarach age (y) | 0.926 (0.833 - 1.029) | 0.153 | 0.896 (0.692 - 1.161) | 0.407 |
| Menopausal age (y) | 1.001 (0.967 - 1.035) | 0.974 | 0.956 (0.874 - 1.046) | - |
| Number of children | 1.324 (1.105 - 1.585) | 0.002 | - | - |
| Parity | - | - | - | - |
| OCP | 0.203 | |||
| Yes | - | - | 1.479 (0.809 - 2.703) | |
| No | - | - | 1 (ref) | |
Abbreviations: OR (CI), odds ratio (confidence interval 95%); ref, reference; OCP, oral contraceptive pill; FBS, fasting blood sugar; LDL, low-density lipoprotein; HDL, high-density lipoprotein; SBP, systolic blood pressure; DBP, diastolic blood pressure; BMI, Body Mass Index.
a P < 0.05 significance level.
5. Discussion
Overall, this study indicated there was a very weak negative correlation between the age of menarche and SBP. In addition, based on the results of this model, no significant relationship was observed between the age of menarche or menopause and the chance of developing high systolic and DBP in postmenopausal women. The results of our study are consistent with a study conducted by Bubach et al. in 2018, which found that early menarche is associated with HTN among adult women. The higher mean SBP and DBP among women who presented early menarche may have been due to chance (18). Additionally, Liu’s study results revealed that late menarche tends to be associated with a high risk of HTN (19). Chen et al.'s findings suggested that late menarche is related to a higher risk of HTN among Chinese adult women, and this association appeared similar among different subgroups (20). The results of our study are discordant with a study conducted in Fujian on 3304 postmenopausal women, which found that late menarche was significantly associated with a lower CVD risk (21). Another study by Zhang et al. in 2019 found that late menarche was significantly linked to a lower risk of HTN (22). Also, a study among 7119 Chinese women revealed that women with late menarche (later than 18 years old) had a 39% higher risk of developing HTN (19). By contrast, an even larger study among 13,242 women reported that instead of late menarche, early menarche was related to a higher risk of self-reported HTN (23). The difference between our study and others may be due to different populations, different definitions of early and later menarche, and different lifestyles. The participants in our study were postmenopausal urban women, where the mean age at recruitment and menarche age was older than in the other studies. Relatively backward economic conditions may delay bodily development. Furthermore, although the age of recruitment was significantly different between the categories of age at menarche, the older the age at menarche, the older the age at recruitment. This could be explained by the trend reported in a study, showing a significant reduction in age at menarche over three generations (from mothers to daughters and grandmothers to granddaughters). Our study indicated that menarche age was negatively associated with FBS. After adjustment for multiple confounders, FBS had a negative effect on increasing BP. Shen et al.'s findings showed that age at menarche was negatively associated with both SBP and DBP after controlling for age, education, marital status, smoking, drinking, and antihypertensive medication use. For women with a 1-year early onset of menarche, SBP and DBP were 0.82- and 0.41-mmHg higher, respectively. Additionally, a 1-year early onset of menarche was linked to 6% higher odds of HTN when adjusting for age, education, marital status, smoking, and drinking. When further controlling for BMI, number of biological children, fasting glucose, HbA1c, LDL-C, HDL-C, and triglycerides, the associations were attenuated but still significant for SBP and DBP and marginally significant for HTN. The associations of age at menarche with BP and HTN were similar among postmenopausal women. When broken down by area of residence, the associations of menarche age with BP and HTN were only significant among women living in rural areas. There were significant interactions between menarche age and area of residence for SBP and DBP and a marginally significant interaction for HTN (24). Furthermore, Yang et al.'s findings revealed that the number of live births and having two children were found to be protective factors for the incidence of HTN compared with having less than two children among the postmenopausal women. Further, the postmenopausal women with three children showed a negative association with the prevalence of prehypertension compared with having five or more children (1). Chen et al.'s findings showed that women who were older at menarche were more likely to reside in rural areas, have more children, later menopause, and have higher mean BP. The positive association between age at menarche and HTN was evident among age at recruitment groups. This association was stronger in urban women and postmenopausal women (20).
5.1. Limitations
This study has several limitations that should be considered. Its cross-sectional design restricts the ability to draw causal inferences between reproductive factors and BP. Additionally, potential recall bias may have affected the accuracy of self-reported ages at menarche and menopause. Finally, since the study population is from a specific region, the generalizability of the findings to other populations may be limited.
5.2. Conclusions
These findings suggest that while reproductive timing (menarche and menopause ages) are not major determinants of BP among postmenopausal women, sociodemographic factors, lipid profiles, BMI, and parity contribute more substantially to BP variability in this population.