
Int J Endocrinol Metab

Image Credit:Int J Endocrinol Metab

Reference Values for Biochemical Analytes in An Iranian Population: The Tehran Lipid and Glucose Study

Author(s):
Shayan SadrinasabShayan SadrinasabShayan Sadrinasab ORCID1, Sajad JeddiSajad JeddiSajad Jeddi ORCID1, Fereidoun AziziFereidoun AziziFereidoun Azizi ORCID2, Asghar GhasemiAsghar GhasemiAsghar Ghasemi ORCID1,*
1Endocrine Physiology Research Center, Research Institute for Endocrine Molecular Biology, Research Institute for Endocrine Sciences, Shahid Beheshti University of Medical Sciences, Tehran, Iran
2Endocrine Research Center, Research Institute for Endocrine Disorders, Research Institute for Endocrine Sciences, Shahid Beheshti University of Medical Sciences, Tehran, Iran

International Journal of Endocrinology and Metabolism:Vol. 24, issue 3; e167774
Published online:Apr 28, 2026
Article type:Review Article
Received:Nov 01, 2025
Accepted:Feb 25, 2026
How to Cite:Sadrinasab S, Jeddi S, Azizi F, Ghasemi A. Reference Values for Biochemical Analytes in An Iranian Population: The Tehran Lipid and Glucose Study. Int J Endocrinol Metab. 2026;24(3):e167774. doi: https://doi.org/10.5812/ijem-167774

Abstract

Context:

Reference values (RVs) are essential tools for medical decision-making, used to interpret an individual’s health status and playing a crucial role in patient care. In addition to age, sex, and inherent biological variability, multiple determinants, including ethnicity, genetic background, dietary habits, environmental factors, and lifestyle, which vary across different populations, play a significant role in the establishment of RVs. Thus, each population requires its own RVs to ensure their effectiveness.

Evidence Acquisition:

In this review, we summarize RVs reported in the Tehran Lipid and Glucose Study (TLGS) between 2010 and 2026, covering 20 analytes measured in apparently healthy participants, including 16 in adults and 4 in pediatrics. Relevant TLGS publications were identified, and their findings were compared with corresponding international data.

Results:

RVs were provided for 20 parameters, classified into three categories: (1) Glucose, insulin, insulin resistance/sensitivity indices, and lipid profile; (2) thyroid function tests [thyroid-stimulating hormone (TSH) and free thyroxine (T4)] and autoimmunity [thyroid peroxidase antibody (TPO-Ab)]; (3) other variables, including creatinine and minerals (serum zinc and magnesium), and serum nitric oxide metabolites.

Conclusions:

The RVs determined by the TLGS provide a population-specific framework for the Iranian population and may serve as a more accurate tool for classification and clinical interpretation than common global RVs. These data emphasize the importance of developing localized RVs to enhance diagnostic precision and improve population health outcomes.

1. Context

The ultimate aim of biomedical science is to promote health, enhance patient care, and provide cost-effective healthcare services (1). Because health is a relative concept, tools are needed to distinguish healthy from unhealthy subjects (2). Reference values (RVs) are among the most widely used medical decision-making tools for interpreting a subject’s health status and play a crucial role in patient care (3). Although adopting common RVs may seem preferable at first glance, the practical application of this simple concept is challenging and does not justify such an approach (4, 5).
In addition to age, sex, and inherent biological variability, multiple determinants, including ethnicity, genetic background, dietary habits, environmental factors, and lifestyle, vary across populations and play significant roles in establishing RVs (6-8). Thus, each population requires its own RVs to ensure their effectiveness (9).
Reference values are derived from subject-based or population-based studies. Small, nonrepresentative sample sizes limit the generalizability of subject-based RVs, which may not accurately reflect the broader population (10-12). In contrast, population-based RVs, derived from large numbers of healthy individuals from the general population, yield more valid and broadly applicable RVs (13). Additionally, their large sample sizes increase statistical power and enable detailed subgroup analyses (14).
The use of inappropriate RVs can lead to misclassification, resulting in false-positive (15) or false-negative (16) results. False-positive results impose unnecessary psychological stress, diagnostic examinations, follow-ups, and medical care, all of which increase healthcare costs (17). Conversely, false-negative results can delay disease diagnosis, worsen prognosis, and ultimately increase morbidity (16). The Tehran Lipid and Glucose Study (TLGS) is a population-based prospective cohort study initiated in 1999 in Tehran, Iran, aimed at preventing noncommunicable diseases. In this study, a multistage stratified cluster sampling approach was used to recruit more than 15000 participants aged 3 years and older (18, 19). Data collected in the TLGS have paved the way for establishing population-based RVs for a broad array of measurements. The objective of this study was to summarize previously reported RVs for biochemical analytes in the TLGS, which can serve as decision-making tools for the Iranian population.

2. Adult Reference Values Determined in the Tehran Lipid and Glucose Study

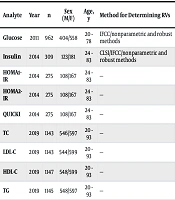
As shown in Tables 1 - 3, RVs for 16 parameters in healthy adult subjects have been reported in TLGS data from 2010 to 2019. These parameters can be divided into three categories: (1) Glucose (20), insulin (21), insulin resistance/sensitivity indices (21), and lipid profile (22); (2) thyroid function tests [thyroid-stimulating hormone (TSH) and free thyroxine (T4) (23)] and autoimmunity [thyroid peroxidase antibody (TPO-Ab) (24)]; and (3) other variables, including creatinine, as the most commonly used renal function test (25), minerals [serum zinc and magnesium (9, 26)], and serum nitric oxide metabolites (27). All reported studies included both male and female subjects, with an age range of 20 - 93 years. In addition, standard methods for determining RVs (ie, parametric and nonparametric methods) according to guidelines presented by the Clinical and Laboratory Standards Institute (CLSI) (28), the International Federation of Clinical Chemistry and Laboratory Medicine (IFCC) (29), and the National Academy of Clinical Biochemistry (NACB) (30) were used. For conversion between different measurement units, readers can find conversion factors elsewhere (31, 32).

2.1. Glucose, Insulin, Insulin Resistance/Sensitivity Indices, and Lipid Profile

The RV for serum glucose concentration in the TLGS was found to be 70 - 100 mg/dL in both men and women (20). This range is consistent with the American Diabetes Association (ADA) criteria for defining normal fasting glucose [70 - 100 mg/dL (33)], values used at Massachusetts General Hospital (34), and values reported from Nordic countries (35) and Japan (36). Reference values for serum insulin concentration in the TLGS [2 - 12 μU/mL in both men and women (21)] were similar to those reported in the adult French population (37, 38). The lower limit of insulin RVs in our population (~2 μU/mL) is consistent with other reports (34, 37, 39); however, the upper limit of fasting insulin RVs in our population (~12 μU/mL) was lower than that reported in China [16 μU/mL (39)] or at Massachusetts General Hospital [20 μU/mL (39)]. A likely explanation for this difference is the method used to measure insulin (40). It has been shown that circulating insulin levels measured using different methods can differ by up to 2-fold, a point that both clinicians and laboratorians should consider (41). Overall, common RVs can be used for fasting glucose, but not for fasting insulin, across different populations. Reference values for insulin sensitivity/resistance indices [homeostasis model assessment of insulin resistance (HOMA-IR) and quantitative insulin sensitivity check index (QUICKI)] have also been reported in the TLGS (Table 1). Although these parameters are not currently used in clinics for diagnosis or treatment, accumulating evidence indicates their future applicability, particularly in relation to cardiovascular disease in type 2 diabetes (42).
Table 1.Reference Values for Fasting Serum Glucose, Insulin, and Lipid Profile in Iranian Healthy Adults: Tehran Lipid and Glucose Study a
AnalyteYearnSex (M/F)Age, yMethod for Determining RVsMeasurement MethodRVs, MalesRVs, FemalesUnitIntra-assay CV, %Inter-assay CV, %Ref
Glucose2011962404/55820 - 78IFCC/nonparametric and robust methodsEnzymatic colorimetric (glucose oxidase)72 - 10368 - 101mg/dL2.22.2(20)
Insulin2014309123/18124 - 83CLSI/IFCC/nonparametric and robust methodsElectrochemiluminescence immunoassay (ECLIA)1.6 - 11.42.3 - 12.0μU/mL1.23.5(21)
HOMA1-IR2014275108/16724 - 83HOMA equation0.61 - 2.380.61 - 2.68
HOMA2-IR2014275108/16724 - 83HOMA2 calculator0.29 - 1.580.40 - 1.80
QUICKI2014275108/16724 - 83QUICKI equation0.22 - 0.420.33 - 0.42
TC20191143546/59720 - 93Enzymatic colorimetric (cholesteryl ester hydrolase)121 - 261118 - 236mg/dL3.03.0(22)
LDL-C20191143544/59920 - 93Friedewald equation54 - 17550 - 161mg/dL
HDL-C20191147548/59920 - 93Enzymatic colorimetric (lipoprotein lipase)31 - 7236 - 84mg/dL4.64.6
TG20191145548/59720 - 93Enzymatic colorimetric (lipoprotein lipase)47 - 30138 - 184mg/dL2.32.3

Abbreviations: CLSI, clinical and laboratory standards institute; CV, coefficient of variation; ECLIA, electrochemiluminescence immunoassay; F, female; HDL-C, high-density lipoprotein cholesterol; HOMA-IR, homeostasis model assessment of insulin resistance; IFCC, International Federation of Clinical Chemistry and Laboratory Medicine; LDL-C, low-density lipoprotein cholesterol; M, male; QUICKI, quantitative insulin sensitivity check index; TC, total cholesterol; TG, triglycerides.

a To convert glucose values from mg/dL to mmol/L, multiply by 0.05551. To convert TG values from mg/dL to mmol/L, multiply by 0.01129. To convert TC, LDL-C, and HDL-C values from mg/dL to mmol/L, multiply by 0.02586. To convert insulin values from μU/mL to pmol/L, multiply by 6.945 (31, 32).

Reference values for the lipid profile determined in healthy TLGS subjects (Table 1) differed between men and women, with higher upper limits for total cholesterol (TC), triglycerides (TG), and low-density lipoprotein cholesterol (LDL-C), as well as a lower lower-limit value for high-density lipoprotein cholesterol (HDL-C), observed in men compared with women (22). This finding is consistent with results from Canada (43), Finland (44), India (45, 46), and Turkey (47). The difference in HDL-C values is related to sex hormones, because estrogen increases and testosterone decreases serum HDL-C (48, 49). It should be noted that RVs for lipid profiles vary widely across populations (43, 45-47). This variation has been attributed to ethnicity, dietary habits, genetic background, environmental factors, and lifestyle (44, 45, 50). In addition, LDL-C may be measured directly or calculated using the original Friedewald formula (LDL-C = TC - HDL-C - TG/5) (51). However, it has been shown that a modified version of the Friedewald formula should be used across different populations; this modified version has also been reported in the TLGS (LDL-C = TC - HDL-C - TG/4) (52).

2.2. Thyroid Function Tests and Autoimmunity

The RVs for thyroid-related parameters reported in this review were derived from the Tehran Thyroid Study (TTS), an ancillary study conducted within the framework of the TLGS (53). Population-based RVs for serum TSH (0.31 - 4.14 mIU/L in men and 0.32 - 5.63 mIU/L in women) and free T4 (0.95 - 1.60 ng/dL in men and 0.89 - 1.50 ng/dL in women) in TPO-Ab-negative healthy Iranian subjects were reported in the TLGS for the first time (23) (Table 2). The most commonly used TSH RVs are 0.5 - 5 mIU/L, and the NACB recommends reducing this range to 0.4 - 2.5 mIU/L (54). Despite some minor differences across populations (55, 56), RVs for both serum TSH and free T4 obtained in the TLGS are consistent with those reported in Denmark (57), India (58), and Spain (59). It should be noted that the measurement method, iodine status, and exclusion criteria used may affect RVs. For example, some studies did not exclude TPO-Ab-positive subjects (60, 61); however, these subjects were excluded in the TLGS in accordance with NACB standards to obtain disease-free reference populations (54).
Table 2.Reference Values for Serum TSH, Free T4, and TPO-Ab in Iranian Healthy Adults: Tehran Thyroid Study, an Ancillary Study of the Tehran Lipid and Glucose Study a
AnalyteYearnSex (M/F)Age, yMethod for Determining RVsMeasurement MethodRVs, MalesRVs, FemalesUnitIntra-assay CV, %Inter-assay CV, %Ref.
TSH20132199953/1246≥ 20NACB guidelinesECLIA0.31 - 4.140.32 - 5.63mU/L1.44.6(23)
Free T420132199953/1246≥ 20NACB guidelinesECLIA0.95 - 1.600.89 - 1.50ng/dL1.33.3
TPO-Ab201528231081/174220 - 80NACB guidelinesELISA1.50 - 32.81.55 - 35.0IU/mL3.94.7(24)

Abbreviations: CV, coefficient of variation; ECLIA, electrochemiluminescence immunoassay; ELISA, enzyme-linked immunosorbent assay; F, female; M, male; NACB, National Academy of Clinical Biochemistry; T4, thyroxine; TPO-Ab, thyroid peroxidase antibody; TSH, thyroid-stimulating hormone.

a To convert free T4 values from ng/dL to pmol/L, multiply by 12.87 (31).

The RVs for serum TPO-Ab in adults in the TLGS were 1.50 - 32.8 IU/mL in men and 1.55 - 35.0 IU/mL in women (24) (Table 2). The upper limit of TPO-Ab found in the TLGS is consistent with the NACB standard (ie, 30 IU/mL) (54). This value is also consistent with those reported from Australia (62) and Italy (63). However, lower upper limits have also been reported in other populations [eg, 16 IU/mL in Japan (64) and 15 IU/mL in Danish Caucasians (65)]. In addition, TPO-Ab values are affected by measurement method, iodine intake status [because both iodine excess and deficiency increase TPO-Ab positivity (66)], genetics [certain human leukocyte antigen (HLA) types are associated with higher TPO-Ab levels (67)], age, and sex [for example, TPO-Ab increased with age in females (68)]. It has been shown that the upper limits of TPO-Ab RVs range from 6 to 29 IU/mL in men and from 7 to 29 IU/mL in women, depending on the method used (63), indicating a 4- to 5-fold difference. This information should be considered when interpreting serum TPO-Ab values.

2.3. Creatinine, Magnesium, Zinc, and Nitric Oxide Metabolites

In the TLGS, RVs for serum creatinine [0.53 - 1.11 mg/dL for men and 0.42 - 0.77 mg/dL for women (25)] were determined using the compensated Jaffe method (Table 3). These values are approximately 0.32 mg/dL lower than those measured using the conventional Jaffe method, a factor that should be considered when interpreting serum creatinine RVs (see the next section). Upper limits of creatinine RVs, which are clinically more relevant than lower ranges (69), in our population were close to those reported from China (70) and Kenya (71) but lower than those observed in European populations (72). Lower muscle mass in Asian populations may partially explain this discrepancy (73).
Table 3.Reference Values for Fasting Serum Creatinine, Magnesium, Zinc, and Nitric Oxide Metabolites in Iranian Healthy Adults: Tehran Lipid and Glucose Study a
AnalyteYearnSex (M/F)Age, yMethod for Determining RVsMeasurement MethodRVs, MalesRVs, FemalesUnitIntra-assay CV, %Inter-assay CV, %Ref.
Creatinine201452472792/245520 - 88CLSI/IFCC/nonparametric methodPhotometric Jaffe0.53 - 1.110.42 - 0.77mg/dL2.24.1(25)
Magnesium2010491233/25820 - 50IFCC/parametric and robust methodsAtomic absorption spectrometry1.8 - 2.51.8 - 2.5mg/dL0.842.5(26)
Zinc201226321119/151320 - 90IFCC/nonparametric methodAtomic absorption spectrometry63 - 20658 - 195µg/dL3.75.4(9)
Nitric oxide metabolites2010687244/442≥ 20IFCC/parametric and robust methodsSpectrophotometric (Griess assay)11 - 7610 – 66 bµmol/L4.24.9(27)

Abbreviations: CLSI, Clinical and Laboratory Standards Institute; CV, coefficient of variation; F, female; IFCC, International Federation of Clinical Chemistry and Laboratory Medicine; M, male.

a To convert creatinine values from mg/dL to mmol/L, multiply by 88.4. To convert zinc values from μg/dL to μmol/L, multiply by 0.153. To convert magnesium values from mg/dL to mmol/L, multiply by 0.411 (31).

b Women with menopause were not included.

As shown in Table 3, RVs for serum magnesium [1.8 - 2.5 mg/dL in both sexes (26)] were almost similar to those reported in Germany (74) and the United Kingdom (75), and minor differences may be attributed to ethnic variation (74, 76) and the more restrictive selection criteria in our study, which eliminated most magnesium metabolism-related problems (75). Reference values for serum zinc concentrations (Table 3) in the TLGS were 60 - 200 µg/dL for both sexes (9). Typical RVs currently used by most studies are 60 - 120 (77) or 70 - 120 μg/dL (78). The lower limits of serum zinc RVs in our population are consistent with those reported in Germany (79) and Kuwait (80), and our upper limits are consistent with those reported in the Canary Islands (81) and northeast Thailand (82). However, serum zinc RVs vary widely across populations (80, 83, 84). Although differences in dietary habits may partly explain these differences, this issue highlights the need to use local RVs (85) and warrants further investigation.
Adult RVs for serum nitric oxide metabolites in the TLGS (10 - 70 µM in both sexes, using the Griess assay) are the first population-based adult RVs for serum nitric oxide metabolites (27) (Table 3). These values support those obtained in small-sample studies conducted in healthy subjects using the Griess assay (8 - 75 µM) (86-89), high-performance liquid chromatography (HPLC) method (10 - 80 µM), and gas chromatography-mass spectrometry method (20 - 85 µM), which is the most accurate quantitative method for measuring nitric oxide. Nitric oxide metabolites are not currently measured routinely in clinics (89); however, accumulating evidence indicates that they may be used in the future, for instance, in septic shock, in which very high nitric oxide production is a major culprit in shock-induced hypotension that is resistant to available antihypertensive treatments (90).

3. Pediatric Age-Group Reference Values Determined in the Tehran Lipid and Glucose Study

As shown in Table 4, RVs for serum creatinine, magnesium, zinc, and nitric oxide metabolites have been determined in pediatric populations in the TLGS. These studies were conducted between 2010 and 2015 and included children and adolescents aged 3 - 19 years. Among these values, RVs for serum creatinine in the TLGS are consistent with those reported in other countries, including the United Kingdom (91) and Canada (92). For creatinine, we used two methods (the conventional Jaffe method and compensated Jaffe method), which provided two sets of RVs [conventional method: 0.6 - 1.2 mg/dL for boys and 0.6 - 1.0 mg/dL for girls; compensated method: 0.23 - 0.86 mg/dL for boys and 0.23 - 0.65 mg/dL for girls (93)]. The higher values observed with the conventional Jaffe method are due to assay interference from noncreatinine chromogens, which can be avoided by subtracting a constant value (0.35 mg/dL) from the results (94), yielding more specific and accurate creatinine measurements in children. Therefore, both laboratory staff and clinicians should be aware of the measurement method when reporting or interpreting RVs for serum creatinine in pediatric populations.
Table 4.Reference Values for Fasting Serum Analytes in Iranian Healthy Pediatric Age-Group: Tehran Lipid and Glucose Study a
AnalyteYearnSex (M/F)Age, yMethod for Determining RVsMeasurement MethodRVs, MalesRVs, FemalesUnitIntra-assay CV, %Inter-assay CV, %Ref.
Creatinine20151502778/7243 - 18CLSI/IFCC guidelines/nonparametric methodPhotometric conventional Jaffe0.60 - 1.200.60 - 1.00mg/dL3.94.7(93)
Creatinine20151502778/7243 - 18CLSI/IFCC guidelines/nonparametric methodPhotometric compensated Jaffe0.23 - 0.860.23 - 0.65mg/dL3.94.7(93)
Magnesium201014664/823 - 19IFCC/parametric and robust methodsFlame atomic absorption spectrometry1.8 - 2.41.8 - 2.4mg/dL0.842.5(95)
Zinc2012672323/3493 - 18CLSI/IFCC/nonparametric methodFlame atomic absorption spectrometry63 - 20660 - 202µg/dLNRNR(94)
Nitric oxide metabolites2010401189/2124 - 19IFCC/parametric and robust methodsGriess14 - 6911 - 66µmol/L4.24.9(96)

Abbreviations: CLSI, Clinical and Laboratory Standards Institute; CV, coefficient of variation; F, female; IFCC, International Federation of Clinical Chemistry and Laboratory Medicine; M, male; NR, not reported.

a To convert values from conventional units to SI units, see Table 3.

Pediatric RVs for serum magnesium [1.8 - 2.4 mg/dL for both sexes (95)] are consistent with those reported from other countries, including Romania (97), Croatia (98), and the United Kingdom (99). In addition, these values closely match those of healthy adults in the TLGS [1.8 - 2.5 mg/dL (26)], suggesting that a common RV for serum magnesium can be adopted. This is not the case for pediatric serum zinc RVs in our population [60 - 200 µg/dL in both sexes (94)]. A wide range in both lower limits (as low as 35 µg/dL) and upper limits (as high as 220 µg/dL) of serum zinc RVs has been reported across populations (79), underscoring the need to determine local RVs (85). These differences may be due to dietary habits and regional factors, such as environmental pollution and local agriculture (85).
To the best of our knowledge, population-based pediatric RVs for serum nitric oxide metabolites (10 - 70 µmol/L in both sexes) have been reported only in the TLGS (96). These values support those reported in other small-sample studies conducted in healthy children (100, 101).
In summary, pediatric RVs have not been extensively investigated in the TLGS population, possibly because of the difficulty of establishing exclusion criteria during steady-state growth in children. However, knowledge in this field is required to provide better health care for this specific population.

4. Quality Control

Quality control (QC) involves procedures to monitor and evaluate analytical methods and testing processes, aiming to detect and correct errors. It ensures that laboratory results are valid (accurate and fulfilling their claims) and thus suitable for subsequent applications (102, 103). Accuracy encompasses both trueness (closeness to the true value) and precision (minimal dispersion among repeated measurements) (102, 104). Trueness is the extent to which measurement results are free from systematic error or bias (mean of measurements - true value) (105, 106). In practice, laboratories use “controls” with prespecified values to determine trueness. Precision, the extent to which measurement results are free from random error (value of a single measurement - value of the mean of measurements), is a precondition for validity (107). In practice, precision is expressed as intra-assay and inter-assay coefficients of variation (CVs).
In the TLGS, a standard QC system was implemented to ensure the validity of the collected data (18, 108). The CVs for the analytes measured in the TLGS (Tables 1 - 4) are all within acceptable ranges, indicating the validity and precision of the assays employed (109). Based on standard laboratory practices, acceptable CVs are as follows: glucose, ≤ 2.4% (110); TC, ≤ 3% (111); TG, ≤ 5% (111); HDL-C, ≤ 4% (111); TSH, ≤ 5.6% (112); free T4, ≤ 3.8% (112); anti-TPO, ≤ 7% (113); creatinine, ≤ 8% (114); magnesium, ≤ 2.68% (115); and zinc, ≤ 7.55% (116). For insulin, CVs vary according to the measurement method and concentration range used; an intra-assay CV ≤ 10% and an inter-assay CV ≤ 13% are acceptable (41).

5. Conclusions and Future Perspectives

Reference values are essential tools in clinical decision-making and health assessment. Different genetic backgrounds, ethnicities, dietary habits, and environmental exposures warrant the establishment of RVs in each population. The TLGS, a large population-based cohort study, has provided a unique opportunity to define RVs for the Iranian population. Here, we summarized reported RVs for 16 parameters in adults and 4 parameters in pediatric populations, based on TLGS reports. Although common RVs can be adopted for some analytes (eg, serum glucose and magnesium), some RVs obtained in our population (eg, lipid profile and serum zinc) show substantial differences, warranting more attention from health decision-makers. In addition, RVs for other analytes (eg, liver function tests) need to be established. Finally, establishing RVs in pediatric populations is an understudied area in Iran. In conclusion, the RVs summarized from the TLGS in this study can be used by healthcare providers in Iran.
This study has several clinical and public health implications. First, for some analytes (eg, serum insulin), the measured value varies according to the measurement method, which should be considered when interpreting results. Second, for serum creatinine, values obtained by the compensated Jaffe method are lower than those obtained by the conventional Jaffe method, which requires careful consideration by clinicians. Finally, values for serum nitric oxide metabolites, although not routinely used in clinics, may be important for monitoring certain clinical conditions, particularly septic shock.


Footnotes

References

  • 1.
    Edwards A. Research and the Goal of Improving Patient Care. Forsch Komplementarmed. 1998;5 Suppl S1:116-20. [PubMed ID: 9892840]. https://doi.org/10.1159/000057330.
  • 2.
    Jones G, Barker A. Reference intervals. Clin Biochem Rev. 2008;29 Suppl 1(Suppl 1):S93-7. [PubMed ID: 18852866]. [PubMed Central ID: PMC2556592].
  • 3.
    Horn PS, Pesce AJ. Reference intervals: an update. Clin Chim Acta. 2003;334(1-2):5-23. [PubMed ID: 12867273]. https://doi.org/10.1016/s0009-8981(03)00133-5.
  • 4.
    Ceriotti F. Prerequisites for use of common reference intervals. Clin Biochem Rev. 2007;28(3):115-21. [PubMed ID: 17909616]. [PubMed Central ID: PMC1994109].
  • 5.
    Boyd JC. Cautions in the adoption of common reference intervals. Clin Chem. 2008;54(2):238-9. [PubMed ID: 18223131]. https://doi.org/10.1373/clinchem.2007.098228.
  • 6.
    Lim E, Miyamura J, Chen JJ. Racial/Ethnic-Specific Reference Intervals for Common Laboratory Tests: A Comparison among Asians, Blacks, Hispanics, and White. Hawaii J Med Public Health. 2015;74(9):302-10. [PubMed ID: 26468426]. [PubMed Central ID: PMC4578165].
  • 7.
    Tahmasebi H, Trajcevski K, Higgins V, Adeli K. Influence of ethnicity on population reference values for biochemical markers. Crit Rev Clin Lab Sci. 2018;55(5):359-75. [PubMed ID: 29874957]. https://doi.org/10.1080/10408363.2018.1476455.
  • 8.
    Ozcurumez MK, Haeckel R. Biological variables influencing the estimation of reference limits. Scand J Clin Lab Invest. 2018;78(5):337-45. [PubMed ID: 29764232]. https://doi.org/10.1080/00365513.2018.1471617.
  • 9.
    Ghasemi A, Zahediasl S, Hosseini-Esfahani F, Azizi F. Reference values for serum zinc concentration and prevalence of zinc deficiency in adult Iranian subjects. Biol Trace Elem Res. 2012;149(3):307-14. [PubMed ID: 22592845]. https://doi.org/10.1007/s12011-012-9445-2.
  • 10.
    Ozarda Y. Reference intervals: current status, recent developments and future considerations. Biochem Med (Zagreb). 2016;26(1):5-16. [PubMed ID: 26981015]. [PubMed Central ID: PMC4783089]. https://doi.org/10.11613/BM.2016.001.
  • 11.
    Solberg H. Subject-based reference values. Scand J Clin Lab Invest. 1995;55:7-10.
  • 12.
    Pusparum M, Ertaylan G, Thas O. From Population to Subject-Specific Reference Intervals. J Comput Sci. 2020. p. 468-82. https://doi.org/10.1007/978-3-030-50423-6_35.
  • 13.
    Szklo M. Population-based cohort studies. Epidemiol Rev. 1998;20(1):81-90. [PubMed ID: 9762511]. https://doi.org/10.1093/oxfordjournals.epirev.a017974.
  • 14.
    Onthoni DD, Chen YE, Lai YH, Li GH, Zhuang YS, Lin HM, et al. Clustering-based risk stratification of prediabetes populations: Insights from the Taiwan and UK Biobanks. J Diabetes Investig. 2025;16(1):25-35. [PubMed ID: 39387466]. [PubMed Central ID: PMC11693582]. https://doi.org/10.1111/jdi.14328.
  • 15.
    Timbrell NE. The Role and Limitations of the Reference Interval Within Clinical Chemistry and Its Reliability for Disease Detection. Br J Biomed Sci. 2024;81:12339. [PubMed ID: 38481978]. [PubMed Central ID: PMC10932992]. https://doi.org/10.3389/bjbs.2024.12339.
  • 16.
    Petticrew MP, Sowden AJ, Lister-Sharp D, Wright K. False-negative results in screening programmes: systematic review of impact and implications. Health Technol Assess. 2000;4(5):1-120. [PubMed ID: 10859208].
  • 17.
    Jackson BR. The dangers of false-positive and false-negative test results: false-positive results as a function of pretest probability. Clin Lab Med. 2008;28(2):305-19. vii. [PubMed ID: 18436073]. https://doi.org/10.1016/j.cll.2007.12.009.
  • 18.
    Azizi F, Rahmani M, Emami H, Mirmiran P, Hajipour R, Madjid M, et al. Cardiovascular risk factors in an Iranian urban population: Tehran lipid and glucose study (phase 1). Soz Praventivmed. 2002;47(6):408-26. [PubMed ID: 12643001]. https://doi.org/10.1007/s000380200008.
  • 19.
    Azizi F, Ghanbarian A, Momenan AA, Hadaegh F, Mirmiran P, Hedayati M, et al. Prevention of non-communicable disease in a population in nutrition transition: Tehran Lipid and Glucose Study phase II. Trials. 2009;10:5. [PubMed ID: 19166627]. [PubMed Central ID: PMC2656492]. https://doi.org/10.1186/1745-6215-10-5.
  • 20.
    Ghasemi A, Zahediasl S, Azizi F. Reference values for fasting serum glucose levels in healthy Iranian adult subjects. Clin Lab. 2011;57(5-6):343-9. [PubMed ID: 21755824].
  • 21.
    Tohidi M, Ghasemi A, Hadaegh F, Derakhshan A, Chary A, Azizi F. Age- and sex-specific reference values for fasting serum insulin levels and insulin resistance/sensitivity indices in healthy Iranian adults: Tehran Lipid and Glucose Study. Clin Biochem. 2014;47(6):432-8. [PubMed ID: 24530467]. https://doi.org/10.1016/j.clinbiochem.2014.02.007.
  • 22.
    Rahmani M, Jeddi S, Ghanbari M, Momenan AA, Azizi F, Ghasemi A. Reference Values for Serum Lipid Profiles in Iranian Adults: Tehran Lipid and Glucose Study. Arch Iran Med. 2019;22(1):24-31. [PubMed ID: 30821157].
  • 23.
    Amouzegar A, Delshad H, Mehran L, Tohidi M, Khafaji F, Azizi F. Reference limit of thyrotropin (TSH) and free thyroxine (FT4) in thyroperoxidase positive and negative subjects: a population based study. J Endocrinol Invest. 2013;36(11):950-4. [PubMed ID: 23873252]. https://doi.org/10.3275/9033.
  • 24.
    Amouzegar A, Bakhtiyari M, Mansournia MA, Etemadi A, Mehran L, Tohidi M, et al. Sex- and Age-Specific Reference Values and Cutoff Points for TPOAb: Tehran Thyroid Study. Thyroid. 2016;26(3):458-65. [PubMed ID: 26650261]. https://doi.org/10.1089/thy.2015.0276.
  • 25.
    Ghasemi A, Azimzadeh I, Zahediasl S, Azizi F. Reference values for serum creatinine with Jaffe-compensated assay in adult Iranian subjects: Tehran Lipid and Glucose Study. Arch Iran Med. 2014;17(6):394-9. [PubMed ID: 24916523].
  • 26.
    Ghasemi A, Zahediasl S, Azizi F. Reference values for serum magnesium levels in young adult Iranian subjects. Biol Trace Elem Res. 2010;138(1-3):99-106. [PubMed ID: 20229174]. https://doi.org/10.1007/s12011-010-8624-2.
  • 27.
    Ghasemi A, Zahediasl S, Azizi F. Reference values for serum nitric oxide metabolites in an adult population. Clin Biochem. 2010;43(1-2):89-94. [PubMed ID: 19782059]. https://doi.org/10.1016/j.clinbiochem.2009.09.011.
  • 28.
    Horn PS, Pesce AJ, Copeland BE. A robust approach to reference interval estimation and evaluation. Clin Chem. 1998;44(3):622-31. [PubMed ID: 9510871].
  • 29.
    Solberg HE. Approved recommendation (1987) on the theory of reference values. Part 5. Statistical treatment of collected reference values. Determination of reference limits. Clinica Chimica Acta. 1987;170(2-3):S13-32. https://doi.org/10.1016/0009-8981(87)90151-3.
  • 30.
    Demers LM, Spencer CA. Laboratory medicine practice guidelines: laboratory support for the diagnosis and monitoring of thyroid disease. Clin Endocrinol (Oxf). 2003;58(2):138-40. [PubMed ID: 12580927]. https://doi.org/10.1046/j.1365-2265.2003.01681.x.
  • 31.
    Young DS. Implementation of SI units for clinical laboratory data. Style specifications and conversion tables. Ann Intern Med. 1987;106(1):114-29. [PubMed ID: 3789557]. https://doi.org/10.7326/0003-4819-106-1-114.
  • 32.
    Knopp JL, Holder-Pearson L, Chase JG. Insulin Units and Conversion Factors: A Story of Truth, Boots, and Faster Half-Truths. J Diabetes Sci Technol. 2019;13(3):597-600. [PubMed ID: 30318910]. [PubMed Central ID: PMC6501531]. https://doi.org/10.1177/1932296818805074.
  • 33.
    American Diabetes Association Professional Practice C. 2. Diagnosis and Classification of Diabetes: Standards of Care in Diabetes-2024. Diabetes Care. 2024;47(Suppl 1):S20-42. [PubMed ID: 38078589]. [PubMed Central ID: PMC10725812]. https://doi.org/10.2337/dc24-S002.
  • 34.
    Kratz A, Ferraro M, Sluss PM, Lewandrowski KB. Case records of the Massachusetts General Hospital. Weekly clinicopathological exercises. Laboratory reference values. N Engl J Med. 2004;351(15):1548-63. [PubMed ID: 15470219]. https://doi.org/10.1056/NEJMcpc049016.
  • 35.
    Rustad P, Felding P, Franzson L, Kairisto V, Lahti A, Martensson A, et al. The Nordic Reference Interval Project 2000: recommended reference intervals for 25 common biochemical properties. Scand J Clin Lab Invest. 2004;64(4):271-84. [PubMed ID: 15223694]. https://doi.org/10.1080/00365510410006324.
  • 36.
    Koike Y, Ogushi Y, Jin D, Sato H, Yamada T. Fasting plasma glucose reference values among young Japanese women requiring 75g oral glucose tolerance tests. Tokai J Exp Clin Med. 2009;34(1):15-20. [PubMed ID: 21318991].
  • 37.
    Francois A, Maumus S, Vincent-Viry M, Gueguen R, Siest G, Visvikis S. Age- and sex-related reference values for serum insulin concentration and its biological determinants in a French healthy population. The STANISLAS cohort. Clin Chem Lab Med. 2004;42(10):1140-9. [PubMed ID: 15552273]. https://doi.org/10.1515/CCLM.2004.233.
  • 38.
    Gallois Y, Vol S, Caces E, Balkau B. Distribution of fasting serum insulin measured by enzyme immunoassay in an unselected population of 4,032 individuals. Reference values according to age and sex. D.E.S.I.R. Study Group. Donnees Epidemiologiques sur le Syndrome d'Insulino-Resistance. Diabetes Metab. 1996;22(6):427-31. [PubMed ID: 8985651].
  • 39.
    Li S, Huang S, Mo ZN, Gao Y, Yang XB, Chen XJ, et al. Generating a reference interval for fasting serum insulin in healthy nondiabetic adult Chinese men. Singapore Med J. 2012;53(12):821-5. [PubMed ID: 23268156].
  • 40.
    Melmed S, Polonsky KS, Larsen PR, Kronenberg HM. Williams textbook of endocrinology. Elsevier Health Sciences; 2015.
  • 41.
    Tohidi M, Arbab P, Ghasemi A. Assay-dependent variability of serum insulin concentrations: a comparison of eight assays. Scand J Clin Lab Invest. 2017;77(2):122-9. [PubMed ID: 28150502]. https://doi.org/10.1080/00365513.2016.1278260.
  • 42.
    Gast KB, Tjeerdema N, Stijnen T, Smit JW, Dekkers OM. Insulin resistance and risk of incident cardiovascular events in adults without diabetes: meta-analysis. PLoS One. 2012;7(12). e52036. [PubMed ID: 23300589]. [PubMed Central ID: PMC3532497]. https://doi.org/10.1371/journal.pone.0052036.
  • 43.
    Connelly PW, MacLean DR, Horlick L, O'Connor B, Petrasovits A, Little JA. Plasma lipids and lipoproteins and the prevalence of risk for coronary heart disease in Canadian adults. Canadian Heart Health Surveys Research Group. CMAJ. 1992;146(11):1977-87. [PubMed ID: 1596847]. [PubMed Central ID: PMC1490331].
  • 44.
    Maatela J, Marniemi J, Reunanen A, Jarvisalo J, Maki J, Tikkanen MJ. Health-based reference values of the Mini-Finland Health Survey: 2. Cholesterol in total serum and in different lipoprotein fractions. Scand J Clin Lab Invest. 1994;54(1):33-42. [PubMed ID: 8171269]. https://doi.org/10.3109/00365519409086507.
  • 45.
    Malati T, Mahesh MR. Reference intervals for serum total cholesterol, HDL-cholesterol, LDL-cholesterol, triglycerides, Lp (a), apolipoprotein A-I, A-II, B, C-II, C-III, and E in healthy South Indians from Andhra Pradesh. Indian J Clin Biochem. 2009;24(4):343-55. [PubMed ID: 23105859]. [PubMed Central ID: PMC3453058]. https://doi.org/10.1007/s12291-009-0063-5.
  • 46.
    Shetty S, Patil VP, Patil VS, Shilpasree AS, Ireshanavar DS, Rao A. Establishment of Reference Intervals for Fasting and Nonfasting Serum Lipid Profile from Healthy Population in Mangaluru, Karnataka, India. Indian J Med Biochem. 2018;23(3):327-30. https://doi.org/10.5005/jp-journals-10054-0124.
  • 47.
    Koseoglu M, Işleten F, Dursun S, Çuhadar S, Adresi Y. Determination of Reference Intervals of Healthy Adults Aged Between 20-50 Years in Izmir. Turkish J Biochem. 2010;35:215-24.
  • 48.
    Kirkland RT, Keenan BS, Probstfield JL, Patsch W, Lin TL, Clayton GW, et al. Decrease in plasma high-density lipoprotein cholesterol levels at puberty in boys with delayed adolescence. Correlation with plasma testosterone levels. JAMA. 1987;257(4):502-7. [PubMed ID: 3098992].
  • 49.
    Annema W, Tietge UJ. Role of hepatic lipase and endothelial lipase in high-density lipoprotein-mediated reverse cholesterol transport. Curr Atheroscler Rep. 2011;13(3):257-65. [PubMed ID: 21424685]. [PubMed Central ID: PMC3085744]. https://doi.org/10.1007/s11883-011-0175-2.
  • 50.
    Yadav D, Gupta M, Mishra S, Sharma P. Reference interval for lipid profile in North Indian population from Rajasthan according to various partitioning criteria. Clin Chim Acta. 2013;426:145-51. [PubMed ID: 23856338]. https://doi.org/10.1016/j.cca.2013.06.004.
  • 51.
    Friedewald WT, Levy RI, Fredrickson DS. Estimation of the concentration of low-density lipoprotein cholesterol in plasma, without use of the preparative ultracentrifuge. Clin Chem. 1972;18(6):499-502. [PubMed ID: 4337382].
  • 52.
    Ghasemi A, Asgari S, Hadaegh F, Kheirandish M, Azimzadeh I, Azizi F, et al. New modified Friedewald formulae for estimating low-density lipoprotein cholesterol according to triglyceride levels: extraction and validation. Endocrine. 2018;62(2):404-11. [PubMed ID: 30043091]. https://doi.org/10.1007/s12020-018-1685-2.
  • 53.
    Heydarian P, Azizi F. [Thyroid dysfunction and autoantibodies 10 years after implementation of universal salt iodization: Tehran Thyroid Study]. Iran J Endocrinol Metabol. 2002;4(4):229-41. FA.
  • 54.
    Baloch Z, Carayon P, Conte-Devolx B, Demers LM, Feldt-Rasmussen U, Henry JF, et al. Laboratory medicine practice guidelines. Laboratory support for the diagnosis and monitoring of thyroid disease. Thyroid. 2003;13(1):3-126. [PubMed ID: 12625976]. https://doi.org/10.1089/105072503321086962.
  • 55.
    Naous E, Hijazi R, Chalhoub M, El Ghorayeb N, Gannage-Yared MH. Reference intervals for thyroid-stimulating hormone in the adult Lebanese population: Results from the last decade. Heliyon. 2025;11(3). e42453. [PubMed ID: 39995938]. [PubMed Central ID: PMC11848085]. https://doi.org/10.1016/j.heliyon.2025.e42453.
  • 56.
    Wang P, Gao YJ, Cheng J, Kong GL, Wang Y, Wu XY, et al. Serum thyroid hormone reference intervals in the apparently healthy individuals of Zhengzhou area of China. Genet Mol Res. 2014;13(3):7275-81. [PubMed ID: 24782216]. https://doi.org/10.4238/2014.April.14.15.
  • 57.
    Jensen E, Petersen PH, Blaabjerg O, Hansen PS, Brix TH, Kyvik KO, et al. Establishment of a serum thyroid stimulating hormone (TSH) reference interval in healthy adults. The importance of environmental factors, including thyroid antibodies. Clin Chem Lab Med. 2004;42(7). https://doi.org/10.1515/cclm.2004.136.
  • 58.
    Marwaha RK, Tandon N, Ganie MA, Mehan N, Sastry A, Garg MK, et al. Reference range of thyroid function (FT3, FT4 and TSH) among Indian adults. Clin Biochem. 2013;46(4-5):341-5. [PubMed ID: 23041244]. https://doi.org/10.1016/j.clinbiochem.2012.09.021.
  • 59.
    Olmedo Carrillo P, Santiago Fernández P, García Fuentes E, Ureña Fernández T, Gutiérrez Alcántara C, Sánchez-Malo C, et al. Definition of reference ranges for free T4, TSH, and thyroglobulin levels in healthy subjects of the Jaén Health District. Endocrinol Diabetes Nutr. 2017;64(8):417-23. https://doi.org/10.1016/j.endien.2017.10.006.
  • 60.
    Eskelinen S, Suominen P, Vahlberg T, Lopponen M, Isoaho R, Kivela SL, et al. The effect of thyroid antibody positivity on reference intervals for thyroid stimulating hormone (TSH) and free thyroxine (FT4) in an aged population. Clin Chem Lab Med. 2005;43(12):1380-5. [PubMed ID: 16309377]. https://doi.org/10.1515/CCLM.2005.236.
  • 61.
    Boucai L, Surks MI. Reference limits of serum TSH and free T4 are significantly influenced by race and age in an urban outpatient medical practice. Clin Endocrinol (Oxf). 2009;70(5):788-93. [PubMed ID: 18727705]. https://doi.org/10.1111/j.1365-2265.2008.03390.x.
  • 62.
    O'Leary PC, Feddema PH, Michelangeli VP, Leedman PJ, Chew GT, Knuiman M, et al. Investigations of thyroid hormones and antibodies based on a community health survey: the Busselton thyroid study. Clin Endocrinol (Oxf). 2006;64(1):97-104. [PubMed ID: 16402936]. https://doi.org/10.1111/j.1365-2265.2005.02424.x.
  • 63.
    D'Aurizio F, Metus P, Polizzi Anselmo A, Villalta D, Ferrari A, Castello R, et al. Establishment of the upper reference limit for thyroid peroxidase autoantibodies according to the guidelines proposed by the National Academy of Clinical Biochemistry: comparison of five different automated methods. Auto Immun Highlights. 2015;6(3):31-7. [PubMed ID: 26275915]. [PubMed Central ID: PMC4633414]. https://doi.org/10.1007/s13317-015-0070-x.
  • 64.
    Shimizu Y, Kawashiri SY, Noguchi Y, Nagata Y, Maeda T, Hayashida N. Normal range of anti-thyroid peroxidase antibody (TPO-Ab) and atherosclerosis among eu-thyroid population: A cross-sectional study. Medicine (Baltimore). 2020;99(38). e22214. [PubMed ID: 32957357]. [PubMed Central ID: PMC7505314]. https://doi.org/10.1097/MD.0000000000022214.
  • 65.
    Jensen EA, Petersen PH, Blaabjerg O, Hansen PS, Brix TH, Hegedus L. Establishment of reference distributions and decision values for thyroid antibodies against thyroid peroxidase (TPOAb), thyroglobulin (TgAb) and the thyrotropin receptor (TRAb). Clin Chem Lab Med. 2006;44(8):991-8. [PubMed ID: 16879067]. https://doi.org/10.1515/CCLM.2006.166.
  • 66.
    Khudair A, Khudair A, Niinuma SA, Habib H, Butler AE. Beyond thyroid dysfunction: the systemic impact of iodine excess. Front Endocrinol (Lausanne). 2025;16:1568807. [PubMed ID: 40241991]. [PubMed Central ID: PMC11999837]. https://doi.org/10.3389/fendo.2025.1568807.
  • 67.
    Schultheiss UT, Teumer A, Medici M, Li Y, Daya N, Chaker L, et al. A genetic risk score for thyroid peroxidase antibodies associates with clinical thyroid disease in community-based populations. J Clin Endocrinol Metab. 2015;100(5):E799-807. [PubMed ID: 25719932]. [PubMed Central ID: PMC4422885]. https://doi.org/10.1210/jc.2014-4352.
  • 68.
    Ma C, Li D, Yin Y, Wu J, Guo X, Zhang R, et al. Establishing thresholds and effects of gender, age, and season for thyroglobulin and thyroid peroxidase antibodies by mining real-world big data. Clin Biochem. 2019;74:36-41. [PubMed ID: 31476287]. https://doi.org/10.1016/j.clinbiochem.2019.08.011.
  • 69.
    Fuentes-Arderiu X, Álvarez-Funes V, Coca-Fábregas L, Cruz-Placer M, Díaz-Fernández J, Herrero-Bernal P, et al. Multicentre physiological reference values for the concentration of creatininium in plasma and diagnostic specificity of glomerular filtration rate estimated with the MDRD equation. Clin Chem Lab Med. 2007;45(4). https://doi.org/10.1515/cclm.2007.097.
  • 70.
    Wang X, Xu G, Li H, Liu Y, Wang F. Reference intervals for serum creatinine with enzymatic assay and evaluation of four equations to estimate glomerular filtration rate in a healthy Chinese adult population. Clin Chim Acta. 2011;412(19-20):1793-7. [PubMed ID: 21672534]. https://doi.org/10.1016/j.cca.2011.05.033.
  • 71.
    Juma AA, Ngeranwa JJ, Njagi EN. Reference values for some renal function parameters for adult population in north-rift valley, kenya. Indian J Clin Biochem. 2012;27(1):40-5. [PubMed ID: 23277711]. [PubMed Central ID: PMC3286574]. https://doi.org/10.1007/s12291-011-0177-4.
  • 72.
    Arzideh F, Wosniok W, Haeckel R. Reference limits of plasma and serum creatinine concentrations from intra-laboratory data bases of several German and Italian medical centres: Comparison between direct and indirect procedures. Clin Chim Acta. 2010;411(3-4):215-21. [PubMed ID: 19914230]. https://doi.org/10.1016/j.cca.2009.11.006.
  • 73.
    Hawkins RC. Differences in serum creatinine concentration between Caucasians, Chinese, Indians and Malays. Clin Chim Acta. 2010;411(17-18):1393. [PubMed ID: 20580697]. https://doi.org/10.1016/j.cca.2010.05.027.
  • 74.
    Schimatschek HF, Rempis R. Prevalence of hypomagnesemia in an unselected German population of 16,000 individuals. Magnes Res. 2001;14(4):283-90. [PubMed ID: 11794636].
  • 75.
    Duncanson GO, Worth HG. Determination of reference intervals for serum magnesium. Clin Chem. 1990;36(5):756-8. [PubMed ID: 2337985].
  • 76.
    Horn PS, Pesce AJ. Effect of ethnicity on reference intervals. Clin Chem. 2002;48(10):1802-4. [PubMed ID: 12324505].
  • 77.
    Bahadoran Z, Ghafouri-Taleghani F, Azizi F, Ghasemi A. High Serum Zinc Concentration Accelerates Progression of Isolated Impaired Glucose Tolerance to Type 2 Diabetes: A Cohort Study. Biol Trace Elem Res. 2025;203(10):4974-82. [PubMed ID: 39939554]. https://doi.org/10.1007/s12011-025-04545-w.
  • 78.
    Bahadoran Z, Azizi F, Ghasemi A. Sex-Specific Association Between Serum Zinc Concentration and Risk of Developing Type 2 Diabetes in Individuals with Isolated Impaired Fasting Glucose: A Prospective Cohort. Biol Trace Elem Res. 2025;203(11):5873-81. [PubMed ID: 40193001]. https://doi.org/10.1007/s12011-025-04609-x.
  • 79.
    Rukgauer M, Klein J, Kruse-Jarres JD. Reference values for the trace elements copper, manganese, selenium, and zinc in the serum/plasma of children, adolescents, and adults. J Trace Elem Med Biol. 1997;11(2):92-8. [PubMed ID: 9285889]. https://doi.org/10.1016/S0946-672X(97)80032-6.
  • 80.
    Abiaka C, Olusi S, Al-Awadhi A. Reference ranges of copper and zinc and the prevalence of their deficiencies in an Arab population aged 15-80 years. Biol Trace Elem Res. 2003;91(1):33-43. [PubMed ID: 12713027]. https://doi.org/10.1385/BTER:91:1:33.
  • 81.
    Romero CD, Sánchez PH, Blanco FL, Rodríguez ER, Majem LS. Serum copper and zinc concentrations in a representative sample of the Canarian population. J Trace Elem Med and Biol. 2002;16(2):75-81. https://doi.org/10.1016/s0946-672x(02)80032-3.
  • 82.
    Boonsiri P, Pooart J, Tangrassameeprasert R, Hongsprabhas P, Khampitak T, Yongvanit P. Serum vitamin A and zinc levels of healthy people in northeast Thailand. Clin Chim Acta. 2006;373(1-2):132-8. [PubMed ID: 16806137]. https://doi.org/10.1016/j.cca.2006.05.020.
  • 83.
    Kouremenou-Dona E, Dona A, Papoutsis J, Spiliopoulou C. Copper and zinc concentrations in serum of healthy Greek adults. Sci Total Environ. 2006;359(1-3):76-81. [PubMed ID: 15955548]. https://doi.org/10.1016/j.scitotenv.2005.04.009.
  • 84.
    Rahil-Khazen R, Bolann BJ, Ulvik RJ. Trace element reference values in serum determined by inductively coupled plasma atomic emission spectrometry. Clin Chem Lab Med. 2000;38(8):765-72. [PubMed ID: 11071071]. https://doi.org/10.1515/CCLM.2000.109.
  • 85.
    Farzin L, Moassesi ME, Sajadi F, Amiri M, Shams H. Serum levels of antioxidants (Zn, Cu, Se) in healthy volunteers living in Tehran. Biol Trace Elem Res. 2009;129(1-3):36-45. [PubMed ID: 19066735]. https://doi.org/10.1007/s12011-008-8284-7.
  • 86.
    Ahirwar AK, Singh A, Bhattacharjee J. Biological reference interval of nitric oxide in health and disease. Horm Mol Biol Clin Investig. 2022;43(3):315-21. [PubMed ID: 35420263]. https://doi.org/10.1515/hmbci-2021-0066.
  • 87.
    Romitelli F, Santini SA, Chierici E, Pitocco D, Tavazzi B, Amorini AM, et al. Comparison of nitrite/nitrate concentration in human plasma and serum samples measured by the enzymatic batch Griess assay, ion-pairing HPLC and ion-trap GC-MS: the importance of a correct removal of proteins in the Griess assay. J Chromatogr B Analyt Technol Biomed Life Sci. 2007;851(1-2):257-67. [PubMed ID: 17324645]. https://doi.org/10.1016/j.jchromb.2007.02.003.
  • 88.
    Watanabe T, Akishita M, Toba K, Kozaki K, Eto M, Sugimoto N, et al. Influence of sex and age on serum nitrite/nitrate concentration in healthy subjects. Clin Chim Acta. 2000;301(1-2):169-79. [PubMed ID: 11020471]. https://doi.org/10.1016/s0009-8981(00)00340-5.
  • 89.
    Choi JW, Pai SH, Kim SK, Ito M, Park CS, Cha YN. Increases in nitric oxide concentrations correlate strongly with body fat in obese humans. Clin Chem. 2001;47(6):1106-9. [PubMed ID: 11375300].
  • 90.
    Farahani A, Farahani A, Kashfi K, Ghasemi A. Inducible nitric oxide synthase (iNOS): More than an inducible enzyme? Rethinking the classification of NOS isoforms. Pharmacol Res. 2025;216:107781. [PubMed ID: 40389042]. [PubMed Central ID: PMC12161154]. https://doi.org/10.1016/j.phrs.2025.107781.
  • 91.
    Finney H, Newman DJ, Thakkar H, Fell JM, Price CP. Reference ranges for plasma cystatin C and creatinine measurements in premature infants, neonates, and older children. Arch Dis Child. 2000;82(1):71-5. [PubMed ID: 10630919]. [PubMed Central ID: PMC1718178]. https://doi.org/10.1136/adc.82.1.71.
  • 92.
    Colantonio DA, Kyriakopoulou L, Chan MK, Daly CH, Brinc D, Venner AA, et al. Closing the gaps in pediatric laboratory reference intervals: a CALIPER database of 40 biochemical markers in a healthy and multiethnic population of children. Clin Chem. 2012;58(5):854-68. [PubMed ID: 22371482]. https://doi.org/10.1373/clinchem.2011.177741.
  • 93.
    Ghasemi A, Azimzadeh I, Afghan M, Momenan AA, Bagheripour F, Azizi F. Pediatric reference values for serum creatinine and estimated glomerular filtration rate in Iranians: Tehran Lipid and Glucose Study. Arch Iran Med. 2015;18(11):753-9. [PubMed ID: 26497372].
  • 94.
    Ghasemi A, Zahediasl S, Hosseini-Esfahani F, Syedmoradi L, Azizi F. Pediatric reference values for serum zinc concentration in Iranian subjects and an assessment of their dietary zinc intakes. Clin Biochem. 2012;45(15):1254-6. [PubMed ID: 22820430]. https://doi.org/10.1016/j.clinbiochem.2012.07.086.
  • 95.
    Ghasemi A, Syedmoradi L, Zahediasl S, Azizi F. Pediatric reference values for serum magnesium levels in Iranian subjects. Scand J Clin Lab Invest. 2010;70(6):415-20. [PubMed ID: 20653401]. https://doi.org/10.3109/00365513.2010.504280.
  • 96.
    Ghasemi A, Zahediasl S, Azizi F. Reference values for serum nitric oxide metabolites in pediatrics. Nitric Oxide. 2010;23(4):264-8. [PubMed ID: 20667479]. https://doi.org/10.1016/j.niox.2010.07.007.
  • 97.
    Antonescu E, Szakács J, Totan M. Determination of reference intervals for total calcium and magnesium specific for children and adolescents in Sibiu area. Rev Rom Med Lab. 2016;24(3):347-50. https://doi.org/10.1515/rrlm-2016-0030.
  • 98.
    Jagarinec N, Flegar-Mestric Z, Surina B, Vrhovski-Hebrang D, Preden-Kerekovic V. Pediatric reference intervals for 34 biochemical analytes in urban school children and adolescents. Clin Chem Lab Med. 1998;36(5):327-37. [PubMed ID: 9676391]. https://doi.org/10.1515/CCLM.1998.055.
  • 99.
    Round JM. Plasma calcium, magnesium, phosphorus, and alkaline phosphatase levels in normal British schoolchildren. Br Med J. 1973;3(5872):137-40. [PubMed ID: 4720763]. [PubMed Central ID: PMC1586378]. https://doi.org/10.1136/bmj.3.5872.137.
  • 100.
    Toprakçı M, Özmen D, Mutaf I, Turgan N, Parıldar Z, Habif S, et al. Age-associated changes in nitric oxide metabolites nitrite and nitrate. Int J Clin Lab Res. 2000;30(2):83-5. https://doi.org/10.1007/s005990070019.
  • 101.
    Anstey NM, Weinberg JB, Hassanali MY, Mwaikambo ED, Manyenga D, Misukonis MA, et al. Nitric oxide in Tanzanian children with malaria: inverse relationship between malaria severity and nitric oxide production/nitric oxide synthase type 2 expression. J Exp Med. 1996;184(2):557-67. [PubMed ID: 8760809]. [PubMed Central ID: PMC2192721]. https://doi.org/10.1084/jem.184.2.557.
  • 102.
    Ghasemi A, Zahediasl S. Preanalytical and analytical considerations for measuring nitric oxide metabolites in serum or plasma using the Griess method. Clin Lab. 2012;58(7-8):615-24. [PubMed ID: 22997962].
  • 103.
    Plebani M, Sanzari MC, Zardo L. Quality control in coagulation testing. Semin Thromb Hemost. 2008;34(7):642-6. [PubMed ID: 19085764]. https://doi.org/10.1055/s-0028-1104542.
  • 104.
    Prenesti E, Gosmaro F. Trueness, precision and accuracy: a critical overview of the concepts as well as proposals for revision. Accredit Qual Assur. 2014;20(1):33-40. https://doi.org/10.1007/s00769-014-1093-0.
  • 105.
    Armbruster D. Accuracy controls: assessing trueness (bias). Clin Lab Med. 2013;33(1):125-37. [PubMed ID: 23331733]. https://doi.org/10.1016/j.cll.2012.10.002.
  • 106.
    Kruve A, Rebane R, Kipper K, Oldekop ML, Evard H, Herodes K, et al. Tutorial review on validation of liquid chromatography-mass spectrometry methods: part II. Anal Chim Acta. 2015;870:8-28. [PubMed ID: 25819784]. https://doi.org/10.1016/j.aca.2015.02.016.
  • 107.
    Mari L, Wilson M, Maul A. Springer Nature. Springer Nature; 2023. https://doi.org/10.1007/978-3-031-22448-5.
  • 108.
    Azizi F, Madjid M, Rahmani M. Tehran lipid and glucose study (TLGS): Rationale and design. Cardiovasc Dis Prev. 2000;3:242-7.
  • 109.
    McPherson RA, Pincus MR. Henry's clinical diagnosis and management by laboratory methods E-book. Elsevier Health Sciences; 2021.
  • 110.
    Sacks DB, Arnold M, Bakris GL, Bruns DE, Horvath AR, Lernmark A, et al. Guidelines and Recommendations for Laboratory Analysis in the Diagnosis and Management of Diabetes Mellitus. Clin Chem. 2023;69(8):808-68. [PubMed ID: 37473453]. [PubMed Central ID: PMC12376302]. https://doi.org/10.1093/clinchem/hvad080.
  • 111.
    Kim HN, Yoon SY. Simultaneous point-of-care testing of blood lipid profile and glucose: Performance evaluation of the GCare Lipid Analyzer. J Clin Lab Anal. 2021;35(12). e24055. [PubMed ID: 34697832]. [PubMed Central ID: PMC8649338]. https://doi.org/10.1002/jcla.24055.
  • 112.
    Yildiz R, Ozkanay H, Arslan FD, Koseoglu M. Biological variation of thyroid stimulating hormone, free triiodothyronine and free thyroxine in healthy subjects in Turkey. Biochem Med (Zagreb). 2025;35(1):10706. [PubMed ID: 39974197]. [PubMed Central ID: PMC11838713]. https://doi.org/10.11613/BM.2025.010706.
  • 113.
    Bildirici MA, Aliyazıcıoğlu Y, Yaman H, Karahan SC, Örem A. Determination of reference change values for thyroid-related biomarkers: TSH, fT3, fT4, Tg, Anti-Tg, and Anti-TPO. Turk J Biochem. 2025;50(2):290-6. https://doi.org/10.1515/tjb-2024-0200.
  • 114.
    Peake M, Whiting M. Measurement of serum creatinine--current status and future goals. Clin Biochem Rev. 2006;27(4):173-84. [PubMed ID: 17581641]. [PubMed Central ID: PMC1784008].
  • 115.
    Ryan MF, Barbour H. Magnesium measurement in routine clinical practice. Ann Clin Biochem. 1998;35 ( Pt 4):449-59. [PubMed ID: 9681049]. https://doi.org/10.1177/000456329803500401.
  • 116.
    Zhang C, Yan Y, Zhang C. Evaluation of imprecision in the different detection methods of Zn based on 5 years of data from an external quality assessment program in China. J Trace Elem Med Biol. 2024;84:127451. [PubMed ID: 38636293]. https://doi.org/10.1016/j.jtemb.2024.127451.

Crossmark
Crossmark
Checking
Share on
Cited by
Metrics

Ordering Reprints

Articles are published under the Creative Commons license stated on each article. No permission or royalty fee is required for uses permitted by that license. CCC handles optional bulk and customized reprint orders. Any quotation covers production and delivery services only, not copyright permission. > Request Reprints from CCC 

Search Relations

Author(s):

Related Articles