


1. Background
2. Objectives
3. Methods
3.1. Study Design and Sample Collection
| Variables | Pre-COVID-19 Pandemic (Phase 6) | Post-COVID-19 Pandemic (Phase 7) |
|---|---|---|
| Age, y | 43.42 ± 9.80 | 46.73 ± 10.45 |
| BMI, kg/m2 | 27.66 ± 5.94 | 27.67 ± 6.26 |
| Education | ||
| Illiterate | 8 (61.54) | 6 (46.15) |
| Less than a high school diploma or diploma | 1 (7.69) | 1 (7.69) |
| Above diploma | 4 (30.77) | 6 (46.15) |
a Values are expressed as mean ± SD or No. (%). The mean age increased by approximately 3.3 years between phases, whereas BMI remained essentially unchanged (mean difference, +0.01 kg/m2). Because each participant served as her own control, formal paired significance tests for these variables were not performed.
3.2. Evaluation of SP, NK1R, VEGF, and CXCL5 Expression Levels
3.3. RNA Extraction and Quantitative Polymerase Chain Reaction
3.4. Induction of NETosis
3.4.1. Isolation of Human Neutrophils
3.4.2. Stimulation of Neutrophils
3.4.3. NETosis Formation Assay
| Genes | Forward | Reverse |
|---|---|---|
| VEGFA | CCCATGGCAGAAGGAGGAG | GATGGCTTGAAGATGTACTCG |
| TACR1 | CCACATCTGTGTGACTGTGC | TCATCATTTTGACCACCTTGCG |
| TAC1 | GACCAGATCAAGGAGGAACTGC | CATGTCCAGCATCCCGTTTG |
| CXCL5 | TGTGCAATTAACAAAGCTACTGC | AGGCATCTAAAAAGCTCAGCA |
| GAPDH | CCACTCCTCCACCTTTGACG | CCACCACCCTGTTGCTGTAG |
| PAD4 | CCATCCTGCTGGTGAACTGT | GTCCTTGGGGGTCTTCGTG |
| MMP9 | GCCACTACTGTGCCTTTGAGTC | CCCTCAGAGAATCGCCAGTACT |
a Abbreviations: VEGFA, vascular endothelial growth factor A; TACR1, tachykinin receptor 1; TAC1, tachykinin precursor 1; CXCL5, C-X-C motif chemokine 5; GAPDH, glyceraldehyde-3-phosphate dehydrogenase; PAD4, peptidyl arginine deiminase 4; MMP9, matrix metallopeptidase 9; NE, neutrophil elastase; MPO, myeloperoxidase.
3.5. IL-6 Concentrations
3.6. Ethical Approval
3.7. Statistical Analysis
4. Results
4.1. Demographic Characteristics
4.2. Expression Levels of SP, NK1R, VEGF, and CXCL5
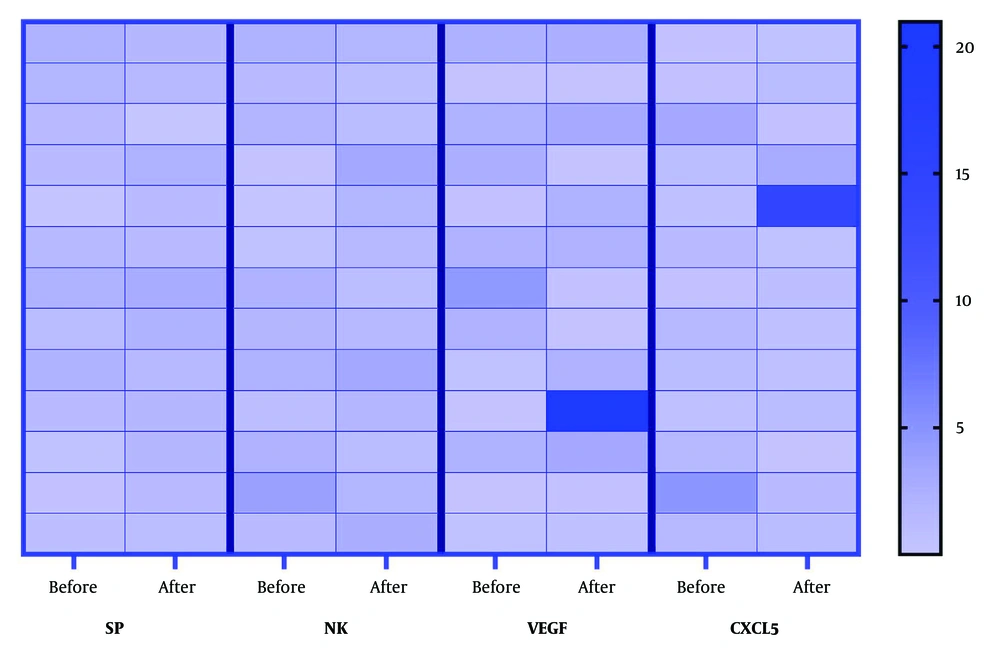
Relative expression of TAC1, TACR1, VEGFA, and CXCL5 genes in peripheral blood samples collected before (Phase 6, pre-pandemic) and after (Phase 7, post-pandemic) the COVID-19 pandemic. Gene expression was quantified by real-time PCR; values are normalized relative expression values (2-ΔCt, scaled per gene). No statistically significant differences were observed: TAC1 (fold change = 1.12; 95% CI, 0.81 - 1.55; P = 0.375), TACR1 (fold change = 1.02; 95% CI, 0.75 - 1.39; P = 0.786), VEGFA (fold change = 1.03; 95% CI, 0.72 - 1.48; P = 0.414), and CXCL5 (fold change = 0.74; 95% CI, 0.45 - 1.20; P = 0.635). Because of the small sample size, these results do not rule out true differences. Each row represents an individual sample; paired samples are not linked in this display.
4.3. NETosis-Related Gene Expression
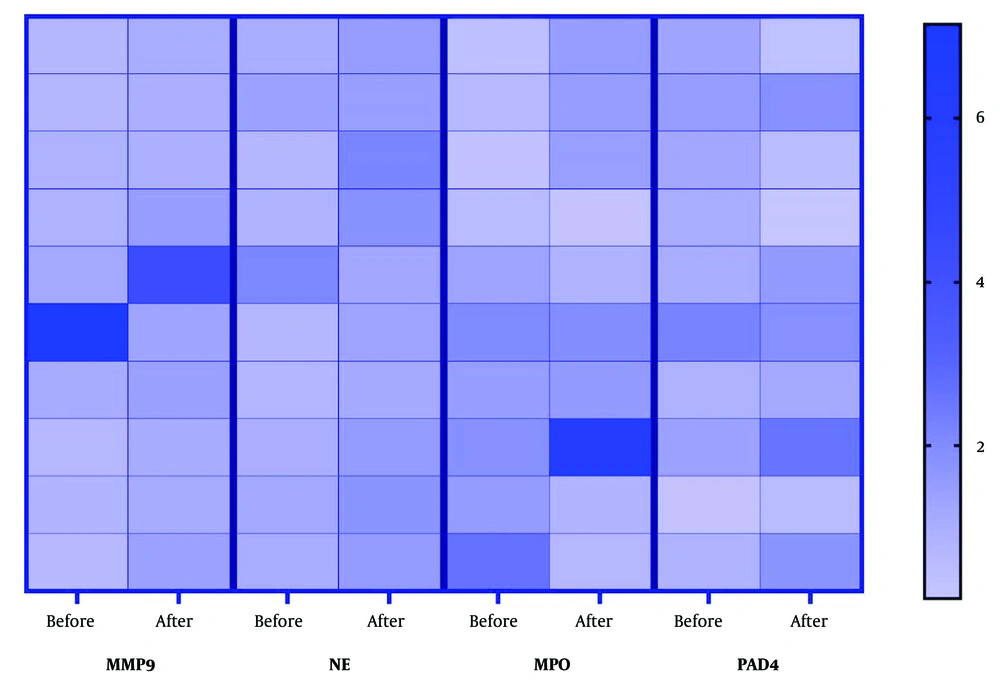
Expression of NETosis-related genes in neutrophils stimulated with sera from individuals with endometriosis before (Phase 6, pre-pandemic) and after (Phase 7, post-pandemic) the COVID-19 pandemic. Values are normalized relative expression values (2-ΔCt, scaled per gene). PAD4 (fold change = 1.23; 95% CI, 0.76 - 2.00; P = 0.921), MMP9 (fold change = 1.40; 95% CI, 0.93 - 2.12; P = 0.084), and MPO (fold change = 1.02; 95% CI, 0.68 - 1.53; P = 0.695) did not differ significantly; however, the study had low power for changes < 2.0. NE was significantly elevated (fold change = 1.50; 95% CI, 1.01 - 2.25; P = 0.048), but borderline significance warrants caution. Each row represents an individual sample; paired samples are not linked.
4.4. Serum IL-6 Levels
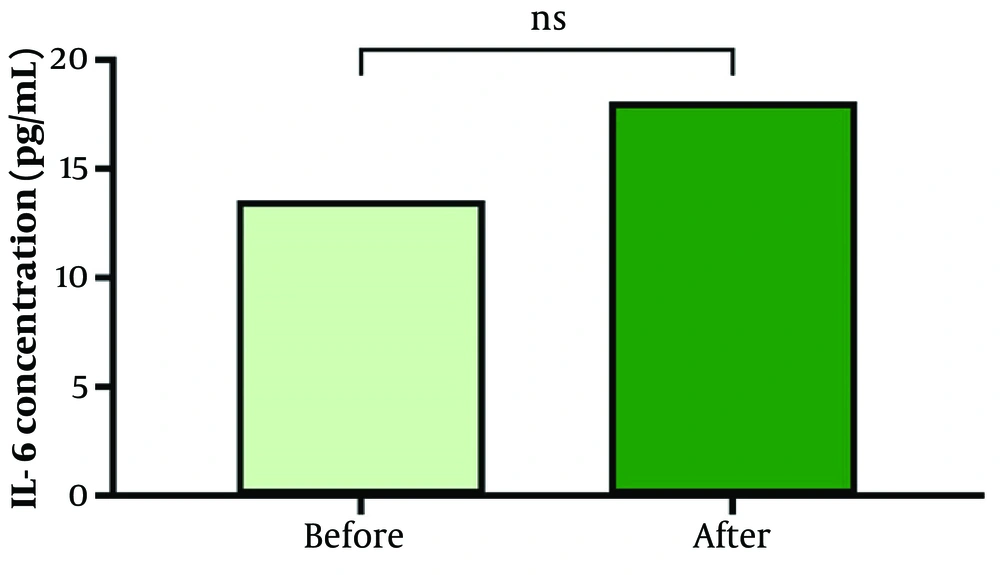
IL-6 concentrations (pg/mL) in serum samples collected before and after the COVID-19 pandemic. The median paired increase was +0.58 pg/mL (95% CI, -0.89 to +2.34 pg/mL; P = 0.750). The difference was not statistically significant, but the confidence interval does not rule out a meaningful change. ns, not significant.
