
1. Background
Substance abuse (long and short-term) has turned into an emerging problem in many societies, with severe negative effects on the quality of life. Globally, millions of people are addicted to morphine, the first well-distinguished alkaloid with high analgesic properties extracted from opium in 1803 (1). Some new substances such as Paan Masala and Nass are currently in use, other than morphine and heroin (2). Unfortunately, due to technological advancement, uncommon addiction behaviors may emerge, such as internet use and its effects on sexual performance (3). Through influencing the central nervous system, morphine alleviates pain. However, despite the high analgesic potential, it has the potential to be highly addictive if used regularly, in which drug tolerance, physical and psychological dependence are rapidly evolved (4). Long-term use of morphine can change hypothalamus-pituitary-gonads (HPG) axis, which affects the hormones secreted by the anterior pituitary gland, including luteinizing hormone (LH) (5). Decreased libido is one of the most common symptoms of regular use of morphine in young and elderly people, especially males (6).
Some researchers have indicated that, in males, opioids use may be associated with sexual dreams, delayed ejaculation, anorgasmia, impotence, and in female addicts, is associated with the elimination of sexual dreams, amenorrhea, anorgasmia, and in some cases, infertility (7). Morphine agonists, including buprenorphine and methadone, are commonly used for the management of morphine dependence, which most often leads to sexual dysfunction (8, 9).
Methadone, a μ-opioid receptor agonist, which is approved by the Food and Drug Administration (FDA) to treat drug dependence, is frequently used for managing drug dependence (10). Methadone maintenance therapy prevents opium withdrawal symptoms and reduces or eliminates opium demand. However, regular consumption reduces the levels of estradiol, dihydrotestosterone, luteinizing hormone, and follicle-stimulating hormone, and also results in hypogonadism (11).
Buprenorphine is an opioid medication to treat opioid dependence, acute pain, and chronic pain. Depending on the type of receptor, it may be an agonist, partial agonist, or antagonist. Pharmacologically, buprenorphine causes morphine-like subjective effects and is occasionally used instead of heroin (12), and also for the management of morphine dependence (13, 14).
Although the results reported by previously conducted studies are inconsistent, it is well-documented that several factors affect the concentration of serum sex hormone and sexual behaviors in detoxified subjects undergoing maintenance therapy. As any change in age (15), medicine intake dose (16), duration of drug use before detoxification, duration of detoxification, and type of maintenance therapy (9), cultural and socio-economic status of individuals (17), the subjectivity of the self-reports and etc., would result in different outcomes. Thus, this controlled animal study intended to investigate the effects of long-term (40 days) morphine dependence on sexual behaviors and sex hormones.
2. Objectives
The morphine-dependent animals underwent detoxification with methadone and/or buprenorphine for another 40 days, and similar parameters were assessed in the different groups.
3. Materials and Methods
3.1. Animals
The present study is confirmed by the Ethics Committee of the Kerman University of Medical Sciences. We studied 75 male rats with proven fertility and 60 old female NMIRI mice (aged 8 weeks). All mice were kept under standard conditions. Nine male mice were used in the pilot study. Female mice were used to conduct behavioral tests. Sixty-six male mice were divided into 6 groups (each with 11 subjects): (1) Control group 40 days maintenance without any intervention (Ctrl40); (2) morphine-dependent group 40 days treatment with 0.4 mg/mL morphine in drinking water (Mrph40); (3) control group 80 days maintenance without any intervention (Ctrl80); (4) morphine-dependent group 80 days treatment with 0.4 mg/mL morphine (Mrph80); (5) methadone group (see below for methadone detoxification, Mtdn); and (6) buprenorphine group (see below for buprenorphine detoxification, Bprn).
3.2. Experimental Design
We dissolved 0.1 mg/mL morphine in drinking water and a small amount of sucrose to induce morphine dependence in the animals. Morphine concentration increased step-wise to 0.4 mg / mL in 15 days (18) and continued to the end of the dependence period (40 days for Mrph40 and 80 days for Mrph80). Three mice were used to examine and confirm the morphine dependence protocol by injection of 2 mg/kg naloxone, followed by the assessment of withdrawal symptoms, which was attributed to the others.
The animals in the Ctrl40 and Mrph40 groups were used to exclude any possible effect of the age and morphine-dependence for 80 days (Ctrl80 and Mrph80, respectively) on sexual behavior and sex hormones. The animals in the Mtdn group underwent a detoxification protocol registered by the Ministry of Health and Medical Education for the human model of detoxification by methadone; we started with a daily subcutaneous dose of 0.05 mg methadone (Daroupaksh, Tehran, Iran) in normal saline followed by 0.135 mg at the 2nd day for five consecutive days. It, then, decreased 20% each other 5 days to the end of the detoxification period (40 days).
Animals in the Bprn group underwent a detoxification protocol as follows; the animals received a subcutaneous injection of 0.018 mg buprenorphine in normal saline followed by 0.036 mg on day 2, for the next 4 days. It then decreased 20% each other 5 days to the end of the detoxification period (40 days).
3.3. Preparation of Female Mice for Mating
As the female mice should be in the estrus phase to allow successful mating; therefore, adult female mice were forced into the estrus phase by injection of 10 IU hMG followed 48 h later by 10 IU hCG.
3.4. Behavioral Test
In a nearly dark room, a female mouse at the estrus phase was introduced into the male cage, and the sexual behavior of the male mouse was carefully observed and recorded. Mount frequency, intromission frequency, intromission latency, ejaculation latency, sexual activity duration, number of the long mount, number of the longer mount, mating type, separation type, and also any successful pregnancy were then recorded for each male in the different groups (19).
3.5. Weight Measurement and Blood Sampling
The animals were regularly weighted by digital calibrated scales with 0.01 g precision. For blood sampling (at 8 to 9 a.m.), the animals were anesthetized with ketamine and xylazine (80 mg/kg + 15 mg/kg, respectively), and the blood was taken from the heart into the clean test tubes. Afterward, test tubes were centrifuged at 2000 - 2500 rpm for 10 minutes, the serum was isolated and stored in microtubes at -20°C for further use.
3.6. Hormone Analysis
ELISA kits were used to measure serum testosterone (IBL, Germany), LH, and follicle-stimulating hormone (FSH) (Eastbiopharm Company, China) following the manufacturer protocols.
3.7. Statistical Analysis
Data were analyzed by SPSS software (SPSS software version 16 for Windows). The Kolmogorov-Smirnov test was applied to test for a normal distribution. Data were examined by one-way analysis of variance (ANOVA) and chi-squared test, followed by Tuckey’s post hoc test. The findings are presented as mean ± SEM. Statistical significance was considered when P-Value < 0.05.
4. Results
4.1. Morphine Dependence Confirmation
After naloxone administration, significant behavioral changes, such as jumping, exploring, escape attempts, and irritability to handling, were observed in the morphine-dependent mice but not in the intact animals; confirming the successfulness of the dependence induction protocol.
4.2. Serum Sex Hormone Levels
Testosterone level in the Mrph40 group (2.83 ± 0.83) was significantly (P < 0.01) lower than the Ctrl40 group (11.73 ± 1.44), and it was also significantly (P < 0.05) lower in Mrph80, Mtdn, and Bprn groups compared to the Ctrl80 group. The LH level was significantly (P < 0.01) decreased in Mrph40, Mtdn, and Bprn groups compared with the Ctrl40 group. A similar scenario was detected for the FSH level, except for the Bprn group, which was significantly (P < 0.05) higher than the Mrph40, Mrph80, and Mtdn groups (Table 1).
Table 1.
| Variables | Groups | |||||
|---|---|---|---|---|---|---|
| Control (40 Days) | Morphine (40 Days) | Control (80 Days) | Morphine (80 Days) | Methadone | Buprenorphine | |
| Testosterone (ng/mL) | 11.73 ± 1.44 | 2.83 ± 0.83 A** | 8.96 ± 2.19b* | 2.59 ± 0.98A** C * | 1.31 ± 0.63A** C * | 1.5 ± 0.55 A** C* |
| LH (mIU/mL) | 14.32 ± 0.79 | 7.82 ± 1.48 A** | 11.42 ± 1.31 B* | 7.06 ± 2.54 | 7.8 ± 0.86 A** | 7.57 ± 0.7 A** C* |
| FSH (mIU/mL) | 11.09 ± 0.92 | 5.11 ± 0.73 A*** | 9.34 ± 2.2 B** | 6.5 ± 0.64 A*** C** | 6.7 ± 1.1 A** | 11.08 ± 1.72 B*** D ** E * |
a Data were presented as mean ± SEM. Compared with A: control (40 days), B: morphine (40 days), C: control (80 days), D: morphine (80 days), E: methadone group.
b*, ** and *** Show significant difference at P < 0.05, P < 0.01 and P < 0.001 respectively.
4.3. Sexual Behavior Parameters
4.3.1. Mount Frequency
The data obtained from the different groups were not significantly different, but the least and highest attempts to mount the female mice were recorded in the Mrph80 group (7.4 ± 1.6) and the Ctrl40 groups (19.2 ± 6.3), respectively. Interestingly, in the Bprn group (17.1 ± 4.1), the attempt to mount the female mice was high (Figure 1).
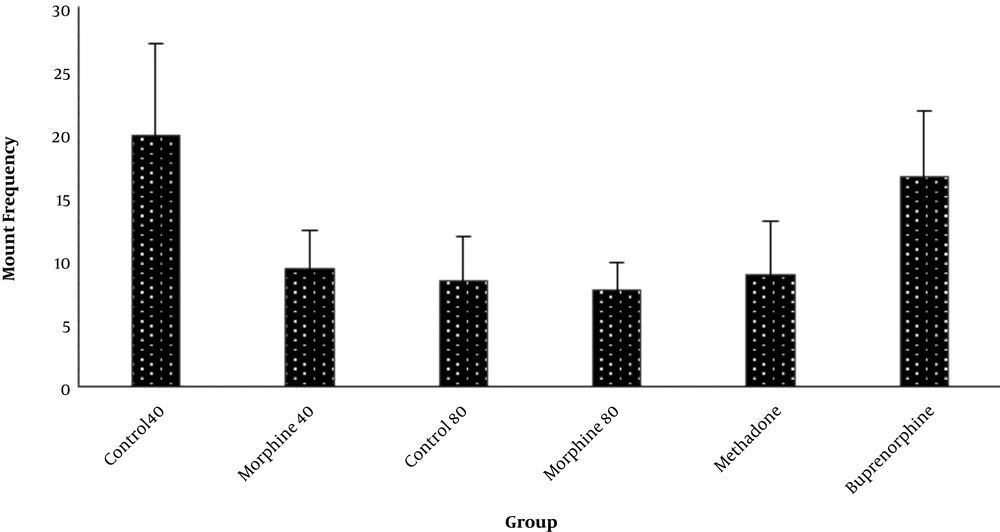
Figure 1.
Mount frequency in the morphine-dependent and methadone/buprenorphine detoxified mice
4.3.2. Intromission Frequency
Intromission frequency was also much higher (14.3 ± 5.7) in the Ctrl40 and Bprn (11 ± 3.7) groups and lower in the Mrph80 (2.6 ± 1.2) group (Figure 2), with no significant difference between the groups.
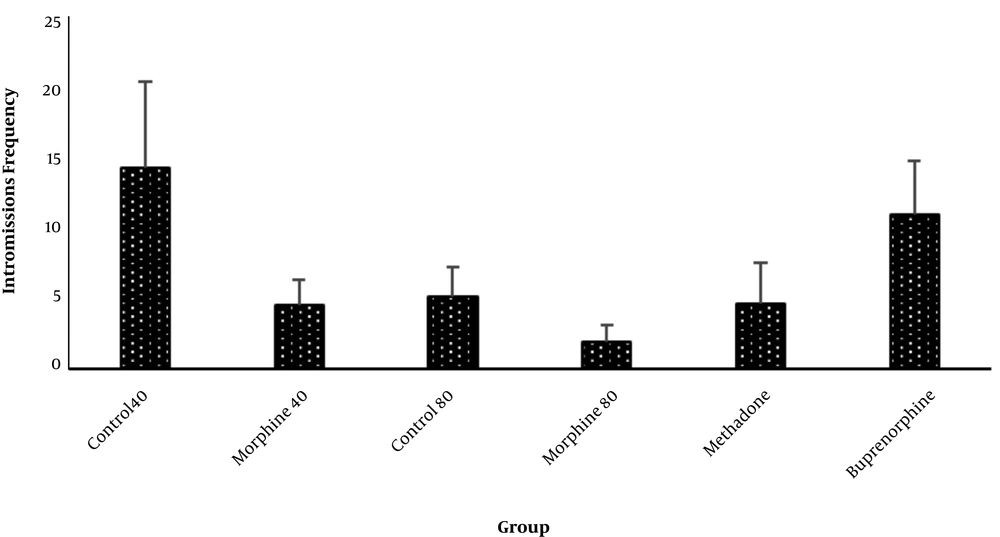
Figure 2.
Intromission frequency in the morphine-dependent and methadone/buprenorphine detoxified mice
4.3.3. Mount Latency, Intromission Latency, Ejaculation Latency, and Sexual Activity Duration
Morphine dependence and buprenorphine detoxification were associated with increased mount latency (8.33 ± 1.89, 10.5 ± 5.89, and 9.5 ± 2.18 for Mrph40, Mrph80, and Bprn groups, respectively) compared to the control (5.43 ± 1.18) groups. Intromission latency was increased in the morphine-dependent groups (19 ± 3.7 and 29 ± 9.49 for Mrph40 and Mrph80 groups, respectively) compared to their controls. It was significantly higher (P < 0.05) in the Mrph80 group than those in the Ctrl80. Detoxification with methadone and buprenorphine resulted in an intromission latency time close to the Ctrl40 group. Ejaculation latency decreased in the morphine-dependent mice (17.33 ± 5.49 and 21.33 ± 10.67 for Mrph40 and Mrph80 groups, respectively) compared to their controls (23.2 ± 8. 3 and 28.4 ± 5.99 for Ctrl40 and Ctrl80 groups, respectively). Detoxification with buprenorphine also increased this parameter (27.33 ± 4.33), while detoxification with methadone decreased (12.75 ± 6.21) that activity. Sexual activity duration was higher in the Bprn group (34.3 ± 3.2) than that in the Mtdn group (19 ± 6.5) (Table 2).
Table 2.
| Variables | Groups | |||||
|---|---|---|---|---|---|---|
| Control (40 Days) | Morphine (40 Days) | Control (80 Days) | Morphine (80 Days) | Methadone | Buprenorphine | |
| Mount latency (min) | 5.43 ± 1.18 | 8.33 ± 1.89 | 3.8 ± 1.65 B * | 10.5 ± 5.89 | 4.6 ± 1.43 | 9.5 ± 2.18 |
| Intromission latency (min) | 16.43 ± 6.4 | 19 ± 3.7 | 5.8 ± 2.85 B * | 29 ± 9.49 C * | 17.6 ± 8.9 | 15.17 ± 1.89 C * |
| Ejaculation latency (min) | 23.2 ± 8. 3 | 17.33 ± 5.49 | 28.4 ± 5.99 | 21.33 ± 10.67 | 12.75 ± 6.21 | 27.33 ± 4.33 |
| Sexual activity duration (min) | 30 ± 7 | 30 ± 4.1 | 30 ± 5.4 | 37 ± 5.2 | 19 ± 6.5 | 34.3 ± 3.2 |
a Values represent the mean ± SEM. Compared with A: control (40 days), B: morphine (40 days), C: control (80 days), D: morphine (80 days), E: methadone.
b * Show significantly different (P < 0.05).
4.3.4. Number of Long Intromission and Number of Longer Intromissions
The number of long intromissions in the buprenorphine treated animals was significantly (P < 0.05) higher (2.5 ± 1.21) than that in the Mrpn40 (0.3 ± 0.21) and Mtdn (0.2 ± 0.13) groups. Longer intromission was also greater in the Bprn group than that of the other groups (Table 3).
| Variables | Groups | |||||
|---|---|---|---|---|---|---|
| Control (40 Days) | Morphine (40 days) | Control (80 Days) | Morphine (80 Days) | Methadone | Buprenorphine | |
| Number of long intromissions | 0.7 ± 0.3 | 0.3 ± 0.21 | 1 ± 0.39 | 0.6 ± 0.4 | 0.2 ± 0.13 | 2.5 ± 1.21 BE * |
| Number of long intromissions | 0.3 ± 0.21 | 0 | 0.2 ± 0.2 | 0 | 0.1 ± 0.1 | 0.4 ± 0.22 |
aValues represent the mean ± SEM. Compared with A: control (40 days), B: morphine (40 days), C: control (80 days), D: morphine (80 days), E: methadone.
b* Show significantly different (P < 0.05).
4.4. Mating
The highest mating rate was recorded in the Ctrl40 (70%) and Bprn (60%) groups. The Mrpn80 group had the worst mating type; however, it did not reach a significant level compared with the other groups (Table 4).
Table 4.
Mating Type in the Morphine-Dependent and Detoxified Animals
| Variables | Groups (%) | |||||
|---|---|---|---|---|---|---|
| Control (40 Days) | Morphine (40 Days) | Control (80 Days) | Morphine (80 Days) | Methadone | Buprenorphine | |
| Mating | 70 | 50 | 50 | 40 | 50 | 60 |
| Complete | 71.43 | 60 | 100 | 75 | 80 | 50 |
| Incomplete | 28.57 | 40 | 0 | 25 | 20 | 50 |
4.5. Separation Type
The separation type parameter in the Ctrl40, Ctrl80, and Bprn groups was 100% of side by side type. In the Mrph40 group, it was 100% slowly, and in the Mrph80 and Mtdn groups, it was a mixed type (Table 5).
Table 5.
| Separation Type | Groups | |||||
|---|---|---|---|---|---|---|
| Control (40 Days) | Morphine (40 Days) | Control (80 Days) | Morphine (80 Days) | Methadone | Buprenorphine | |
| Side by side | 100 | 0 A** | 100 B** | 66.67 ± 33.33 | 75 ± 25 | 100 B** |
| Slowly | 0 | 100 A ** | 0 B ** | 33.33 ± 33.33 | 25 ± 25 | 0 B * |
a Values represent the mean ± SEM. Compared with A: control (40 days), B: morphine (40 days)
b *, ** Show significantly different at P < 0.05 and P < 0.01, respectively.
4.6. Pregnancy Rate
No pregnancy happened in the Mrph80 and Bprn groups, but animals in the other groups successfully got pregnant (Table 6).
Table 6.
Pregnancy Rate in the Different Groups a
| Variables | Groups | |||||
|---|---|---|---|---|---|---|
| Control (40 Days) | Morphine (40 Days) | Control (80 Days) | Morphine (80 Days) | Methadone | Buprenorphine | |
| Pregnancy rate (%) | 80 | 33.33 | 60 | 0 A * | 75 | 0 A * |
a * P < 0.05 compared with the control40, control80 and methadone groups (A).
5. Discussion
In this study, the effects of long-term dependence of male mice to morphine and detoxification with methadone and buprenorphine on sexual behaviors and sex hormones were investigated. Testosterone and LH levels were reduced considerably following 40 days of morphine dependence and 40 days of detoxification by methadone and/or buprenorphine, with no significant difference among either of the treatment. Sexual behaviors were also altered in the morphine-dependent animals and detoxified animals, as well. As in the present study, we investigated different aspects of sexual activities, there were differences among the morphine-dependent, methadone-detoxified, and buprenorphine-detoxified animals, which requires closer attention.
Lower short-term doses of opium and opioid family were associated with increased levels of arousal and libido, but at higher doses and long-term use, it caused sexual dysfunction and decreased libido (20). Sexual dysfunction caused by opiate-use can occur at all stages of the sexual response cycle, including sexual anesthesia (erection), Plato (arousal stage), and orgasm (ejaculation) (21). According to the findings, the duration of the first mount, which indicates the time of sexual stimulation, as well as the duration of the first entry, which indicates the time of erection, were significantly higher in the Mrph40 group compared to the Ctrl80 group. The first entry time in the Mrph80 and Bprn groups was also significantly higher than the Ctrl80 group. In addition, the duration of sexual activity was longer in the buprenorphine-detoxified animals compared with the methadone-detoxified ones. The number of long intromissions was also significantly higher in the buprenorphine-detoxified animals. The Separation type in the Mrph40 group showed a relatively high clearance compared with Ctrl40, Ctrl80, and Bprn groups; indicating some type of sexual dysfunction. There are studies that reported erection level in the methadone-treated subjects was significantly impaired when compared with the buprenorphine-treated subjects, which can be attributed to the hypogonadism and depression that is common in the addicted subjects (22). Comparison of sexual dysfunctions among the male treated with buprenorphine and naltrexone revealed that buprenorphine-treated individuals had premature ejaculation and erectile dysfunction. They also had a lower or decreased libido than the men treated with naltrexone; 83% of male rats treated with buprenorphine, and 90% of male rats treated with naltrexone reported at least one symptom of sexual dysfunction (12).
Males addicted to opioids, experience dysfunction, decreased libido, fatigue, and depression (23). Reduced libido and erectile dysfunction may be attributed to the unusual serum testosterone levels; considering the pivotal role of testosterone in male sexual function (24). Hypothalamus releases luteinizing hormone-releasing hormone (LHRH), which in turn causes secondary changes in LH and testosterone levels. This assumption has been confirmed and indicated that the pituitary or gonads were not directly affected by opioids. The endogenous opioid peptides affect the testicular function via two mechanisms: (1) HPG axis, for example preventing the secretion of GnRH, which in turn influences LH secretion: and (2) opioid receptors of the testicular epithelium (25). In addition, the end-product of the axis; the gonadal sex steroid hormones, regulates opioid actions. Studies in the male rats suggested that morphine exposure does not directly affect LH but it intensifies the responsiveness of the hypothalamus to negative feedback by testosterone (26).
In general, appropriate pharmacological intervention for treating and maintenance of dependence on opioids (e.g. methadone and buprenorphine) should include the following features: (1) an induction method that reduces harvesting, (2) reducing the treatment duration for the preservation of addicts and elimination of drug abuse behaviors, and (3) minimum production or no withdrawal symptoms when the treatment is discontinued (27). Because methadone and buprenorphine are opioid agonists, it is important that elimination of the abused opiates be matched with an increasing dose of buprenorphine to provide an acceptable transition with minimum effects on the subject (27, 28). Testosterone level in the Mtdn and Mrph80 groups was significantly lower than the Ctrl40 and Ctrl80 groups. Lower serum testosterone levels can be attributed to the decreased function of Leydig cells or decreased secretion of LH, which is consistent with the presumption that changes in the testosterone level are secondary to the changes in the LH level (29). These findings are in line with another study showing that 40 days of heroin, an opioid combination, administration in mice was associated with decreased testosterone level (30). In the present study, LH level was significantly decreased in the Mrph40 and Mrph80 groups compared with the Ctrl40 and Ctrl80 groups. These results are in agreement with another study reporting that morphine and other opioid compounds, in both sexes, could decrease LH hormone secretion, the reduced testosterone level in the male rats, and disrupted ovulation in female rats. FSH level decreased in all experimental groups, except for the buprenorphine treated animals (25). Moreover, buprenorphine treatment has been much less associated with sexual dysfunction; the degree of libido damage in the methadone-treated group was also higher than that of the buprenorphine-treated patients (31). Hejazian et al. (2007) examined the effects of opium on serum level of LH, FSH, and testosterone in addicts and found that: serum testosterone level in opiate addicts was significantly decreased compared with the control group, and this decrease was directly related to the course of consumption. LH and FSH hormones level also significantly decreased in the addicted subjects (6). Although we showed alteration of sexual activities following morphine-dependence and detoxification with methadone/buprenorphine in the mice, the contribution of these findings to the human being requires a precise investigation in the human subjects. In addition, maintenance therapy by methadone/buprenorphine in the male subjects should carefully be applied on an individual-based regimen, considering the different effects of morphine agonists on sexual activities (31).
5.1. Conclusions
In conclusion, this study demonstrated that long-term use of morphine significantly affects the secretion of sexual hormones and sexual activities. Detoxification with methadone and buprenorphine can change these impairments differently. Generally speaking, buprenorphine detoxification exerts less adverse effects on sexual hormones, sexual activities, and libido than what happens after methadone detoxification. Nevertheless, the findings of the present study should be confirmed by clinical trials using individual-based protocols. Our findings also can help clinicians in designing long-term detoxification programs, which most probably would impact sexual activities in morphine-dependent individuals.