


1. Background
| Lipid Indices | Formula | Normal Values a |
|---|---|---|
| CRI-I | TC/HDL | ≥ 4 |
| CRI-II | LDL/HDL | ≥ 3 |
| Non-HDL cholesterol (NHC) | TC - HDL | ≥ 130 |
| Atherogenic coefficient (AC) | Non-HDL/HDL | ≥ 2 |
| AIP | Log (TG/HDL) | ≥ 0.1 |
| TyG Index | Ln [TG × FBS/2] | ≥ 9.04 |
Abbreviations: TC, total cholesterol; NHC, Non-HDL cholesterol; AC, atherogenic coefficient; TyG Index, Triglyceride-Glucose Index; LDL, low-density lipoprotein; HDL, high-density lipoprotein; AIP, Atherogenic Index of Plasma; CRI-I, Castelli’s Risk Index I; CRI-II, Castelli’s Risk Index II.
a Regarded as high risk.
2. Objectives
3. Patients and Methods
3.1. Setting
3.2. Study Design
3.2.1. Inclusion Criteria
3.2.2. Exclusion Criteria
3.3. Variables
3.4. Data Sources and Measurement
3.5. Handling Quantitative Variables
3.6. Statistical Analysis
4. Results
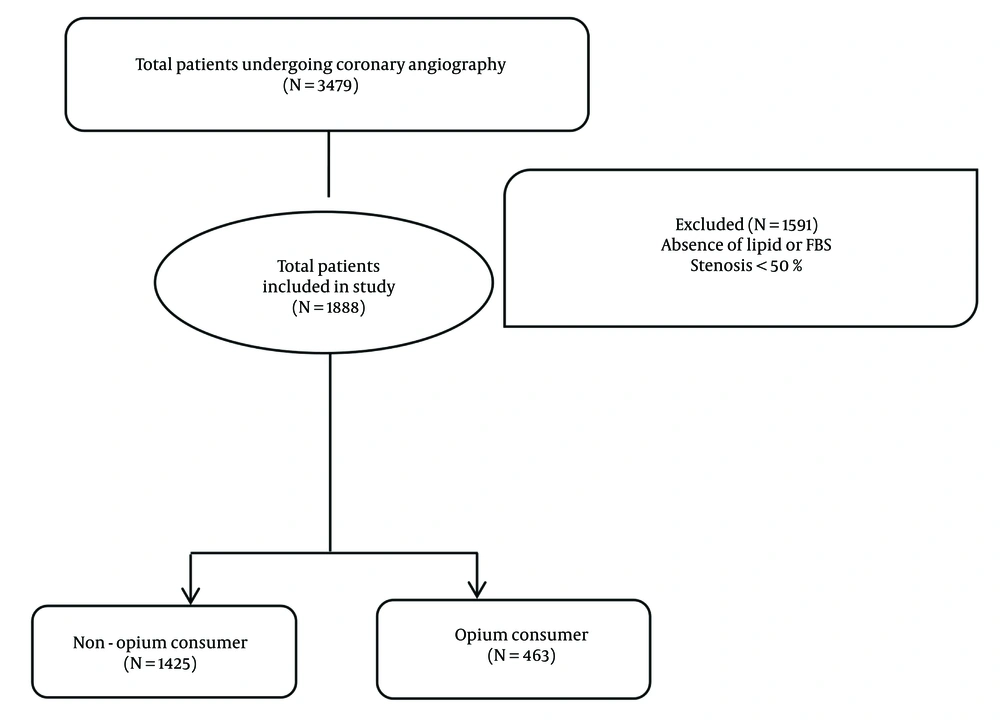
Flowchart of study patients
| Variables | Total (N = 1888) | Non-opium (N = 1425) | Opium (N = 463) | P-Value |
|---|---|---|---|---|
| Age (y) | 63.46 ± 11.43 | 64.38 ± 11.74 | 60.14 ± 11.64 | 0.001 c |
| BMI | 25.12 ± 4.73 | 25.46 ± 4.77 | 24.67 ± 4.04 | 0.001 c |
| Gender | 0.001 c | |||
| Male | 1293 (68.5) | 928 (65.1) | 365 (78.8) | |
| Female | 595 (31.5) | 497 (34.9) | 98 (21.2) | |
| Risk factors | ||||
| Hypertension | 977 (52.0) | 780 (55.0) | 197 (42.8) | 0.001 c |
| DM | 532 (28.3) | 441 (31.0) | 91 (19.6) | 0.001 c |
| Dyslipidemia | 515 (27.5) | 410 (28.8) | 105 (22.9) | 0.009 c |
| Family history of CAD | 352 (18.8) | 267 (18.9) | 85 (18.4) | 0.822 |
| History of CABG | 92 (4.8) | 69 (4.8) | 23 (4.9) | 0.974 |
| History of PCI | 271 (14.3) | 191 (13.4) | 80 (17.3) | 0.049 c |
| Smoking status | 0.001 c | |||
| No smoker | 1605 (85.3) | 1303 (91.7) | 302 (65.5) | |
| Current smoker | 204 (10.8) | 83 (5.8) | 121 (26.2) | |
| Recent smoker | 73 (3.9) | 35 (2.5) | 38 (8.2) |
Abbreviations: CAD, coronary artery diseases; CABG, coronary artery bypass graft; PCI, percutaneous coronary intervention; BMI, Body Mass Index; DM, diabetes mellitus.
a Values are expressed as mean ± SD or No. (%).
b Statistical tests used in the table are Mann-Whitney test and 2 chi-square.
c P < 0.05 was considered statistically significant.
| Variables | Total | Non-opium | Opium | P-Value |
|---|---|---|---|---|
| TG | 127.57 ± 83.56 | 131.53 ± 86.75 | 115.71 ± 59.37 | 0.001c |
| Cholesterol | 165.36 ± 36.81 | 166.14 ± 14.81 | 162.95 ± 100.83 | 0.09 |
| LDL | 100.15 ± 28.42 | 101.14 ± 41.73 | 97.33 ± 10.97 | 0.06 |
| HDL | 43.20 ± 12.31 | 43.38 ± 12.80 | 42.63 ± 10.67 | 0.51 |
| Fasting blood sugar | 129.35 ± 62.19 | 130.65 ± 94.73 | 125.56 ± 36.34 | 0.12 |
| CRI-I | 3.99 ± 1.46 | 4.00 ± 1.28 | 2.97 ± 1.87 | 0.26 |
| CRI-II | 2.45 ± 1.44 | 2.45 ± 1.41 | 2.97 ± 2.39 | 0.35 |
| AIP | 0.41 ± 0.28 | 0.43 ± 0.28 | 0.38 ± 0.20 | 0.02c |
| TyG Index | 8.78 ± 0.72 | 8.81 ± 0.73 | 8.66 ± 0.66 | 0.001c |
| Non-HDL cholesterol | 122.16 ± 62.95 | 122.76 ± 44.97 | 120.73 ± 31.99 | 0.02c |
Abbreviations: TG, triglycerides; LDL, low-density lipoprotein; HDL, high-density lipoprotein; TyG Index, Triglyceride-Glucose Index; AIP, Atherogenic Index of Plasma; CRI-I, Castelli’s Risk Index I; CRI-II, Castelli’s Risk Index II.
a Values are expressed as mean ± SD
b Statistical tests used in the table is Mann-Whitney test.
c P < 0.05 was considered statistically significant.

