
1. Background
The internet and online gaming have shaped how students access information and entertain themselves. While these technologies offer benefits, excessive use can threaten physical and psychological well-being. In 2018, World Health Organization recognized internet gaming disorder as a mental health condition, highlighting the need for ongoing research and prevention (1). Across studies, internet gaming problems consistently linked to higher anxiety, depression, and social difficulties. In this context, “gaming patterns” refers to four dimensions: (1) Frequency (how often gaming episodes occur); (2) duration (length of each session); (3) social context (solitary versus social play); and (4) progression (depth of engagement). These pattern dimensions underpin analyses of how engagement translates into outcomes. Prevalence estimates of online gaming engagement vary by context and measurement. Engagement is widely reported, with participation typically around 75% - 90% across diverse populations. By contrast, estimates of problematic gaming – often defined by internet gaming disorder criteria or related validated scales – range roughly 7% - 11% of youths. These figures depend on the instrument, cutoffs, and sample characteristics (2). In a Tehran-based sample of students, recent work reports an internet gaming disorder prevalence of 5.6% (3). Taken together, these numbers reflect context-specific differences and methodological variation rather than a universal rate, underscoring the importance of clearly specifying definitions, instruments, sampling frames, and temporal context when interpreting prevalence data.
Motivations such as escapism, achievement, competition, and collaboration meaningfully shape gaming patterns and the risk of problematic use. Competitive and recreational motives tend to predict higher gaming frequency, with competitive drive increasing engagement in competitive contexts to satisfy psychological needs (e.g., achievement, status, mastery) (4, 5). Escapism and achievement motivations are associated with deeper emotional and cognitive attachment to games and may contribute to problematic gaming behaviors (6). A body of research has examined personality traits – such as extraversion, neuroticism, agreeableness, and facets of the dark triad (psychopathy, Machiavellianism, and narcissism) – in relation to online gaming dependence. Motivational factors can mediate the relationship between dark triad traits (notably psychopathy) and maladaptive gaming behaviors among students (7). There is also evidence linking gaming time and game type to academic outcomes, suggesting that excessive gaming can negatively affect learning in some contexts, though effects vary by game type and setting (8). Beyond gaming itself, excessive use of digital technology - especially social networks - has been linked to reduced concentration, strained interpersonal relationships, loneliness, and heightened anxiety among students. Motivations such as social approval and stress avoidance drive heavy engagement, with low self-esteem and social anxiety often mediating these relationships (9, 10). These findings highlight the need for educational interventions that raise awareness and foster time-management skills related to technology use among students and young adults.
Despite a growing literature base, a key gap remains: The simultaneous examination of gaming characteristics and psychological motivations within student populations. To illuminate how these factors jointly contribute to problematic use and well-being, this study adopts an integrated approach that measures both game patterns (e.g., frequency, duration, social play, progression) and the underlying psychological motivations (e.g., achievement, affiliation, escapism). Psychological motivations will be assessed with validated self-report instruments grounded in theories such as self-determination theory and achievement motivation, complemented by behavioral indicators and, where feasible, implicit measures to strengthen construct validity. This triangulated strategy enables a more precise analysis of how motivational states interact with game mechanics to influence engagement and well-being, thereby informing a comprehensive theoretical framework for internet gaming behaviors and guiding targeted student-focused interventions.
This study aims to bridge the gap by concurrently examining multiple gaming characteristics and psychological motivations within a student cohort. By integrating these dimensions, the research seeks to identify interaction effects that refine theory on motivation in digital contexts and to develop an analytic framework capable of yielding high-resolution insights into how game mechanics align with motivational states to influence engagement, performance, and well-being. Anticipated contributions include theoretical refinements and practical implications for designing effective student-focused interventions.
2. Objectives
This study fills gaps in the literature by exploring how psychological motivations and gaming genres shape students’ online gaming patterns. Our goal is to analyze these links, identify challenges associated with internet gaming, and propose preventive strategies to protect mental health and social interactions. Specifically, we ask: How do internet gaming use, gaming genres, and psychological motivations contribute to students’ dependence or potential addiction? The results will inform targeted interventions that promote healthier gaming habits among students.
3. Materials and Methods
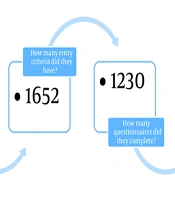
This descriptive cross-sectional study targeted Tehran-based adolescents aged 12 - 18 during the 2023 - 2024 academic year. The Tehran Management and Planning Organization estimated 818,715 students in this age range. Using Cochran’s formula with a 95% confidence level and a 0.05 margin of error, and factoring in a 10% dropout rate (11), the initial target sample was 708 participants. Analyses were performed on both imputed and complete-case data to test robustness. Eligibility included: Ages 12 - 18 years, no intellectual disability or psychiatric disorders, and no history of psychotropic or addictive substance use (self-reported). Exclusion criteria encompassed diagnosed neurological or mental health conditions, current psychotropic medication, or recent substance use that could confound results. Psychiatric status was self-reported and briefly evaluated by an interviewer, with parental/guardian input when feasible. The final sample comprised 708 adolescents (248 girls and 460 boys) from varied regions of Tehran, with a mean age of 15.59 years (SD = 1.83); boys averaged 15.16 years (SD = 1.27) and girls 12.15 years (SD = 1.78). Data were collected from mid-summer to mid-autumn 2023, over about three months, using structured questionnaires. From 1,600 individuals who accessed the survey links, 1,100 completed the questionnaires; analyses ultimately used 708 participants (460 boys and 248 girls). Ethical approval was granted (IR.USWR.REC.1401.112). Recruitment occurred via Instagram, Telegram, LinkedIn, ResearchGate, WhatsApp, and in-person announcements at Tehran high schools. Participants reviewed inclusion criteria, then completed a demographic form and consent (Figure 1).
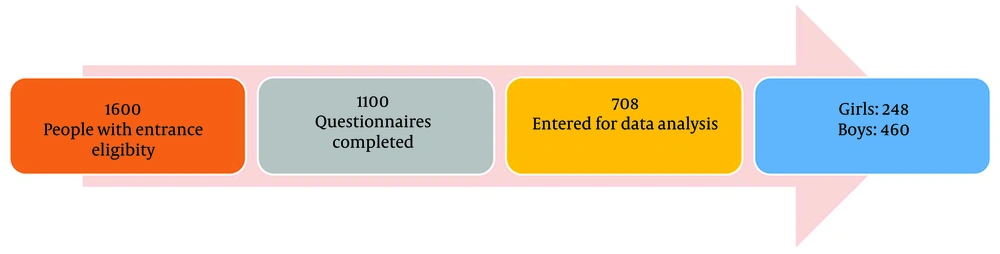
Figure 1.
Consort flowchart
3.1. Demographic Questionnaire
This questionnaire was designed to collect participant characteristics relevant to the study. Variables include age, gender, educational attainment (specifically, whether the participant has completed the first or second year of high school), parental education categorized into three groups: Illiterate, diploma/associate degree, and bachelor’s degree or higher. Family financial status was also categorized into three levels: Lower-middle, middle, and upper-middle. The items are straightforward and intended to capture sociodemographic context that may influence gaming patterns and outcomes.
3.2. Internet Gaming Addiction Questionnaire
The questionnaire adapted from Young’s Internet Addiction Questionnaire, consists of 20 items rated on a 5-point Likert scale (1 = rarely to 5 = always) (12). Total scores range from 20 to 100. Based on these scores, participants are classified as normal game users (20 - 50), those experiencing difficulty stopping gaming (50 - 80), and those exhibiting gaming addiction (80 - 100). Cronbach’s alpha has been reported as α = 0.90 for the Persian version, indicating high internal consistency (12). Additional validation work has reported α = 0.95 in Persian samples, further supporting reliability (13). Convergent validity is demonstrated by a significant correlation with Young’s Internet Addiction Questionnaire (r = 0.71, P < 0.001). The instrument distinguishes two patterns of internet use: Social-emotional and academic-professional. The social-emotional pattern assesses effects on mental health and social functioning (e.g., isolation, anxiety, depression), while the academic-professional pattern assesses effects on academic performance and professional responsibilities. Together, these dimensions provide a comprehensive view of the multifaceted impacts of internet gaming, including potential addictive patterns.
3.3. Internet Gaming Genres Checklist
The present study used a genre checklist aligned with the Iran Computer Games Foundation classifications and prior work (14, 15). Six genres are evaluated, each represented by a single item: (1) Puzzle (intellectual challenges requiring problem-solving); (2) educational (language or skill learning); (3) simulation (real-life replication, e.g., piloting or driving); (4) action (high-energy gameplay with rapid reflexes); (5) adventure (exploration and narrative); and (6) strategic (resource and human-management challenges). Participants selected a single preferred genre, as the checklist prohibits multiple selections. This approach provides a focused capture of genre preference, which may relate to different motivational profiles and outcomes.
3.4. Motives for Online Gaming Questionnaire
It was developed for Persian use by Aminimanesh et al. (16), and draws on prior literature on internet gaming motivations. The instrument contains 27 items across seven subscales: Competition, entertainment, coping, skill development, social interaction, escape, and imagination. Respondents rate agreement on a 4-point scale (1 = strongly disagree to 4 = strongly agree). Confirmatory factor analysis supported a seven-factor model with satisfactory fit, and standardized factor loading exceeded 0.60 for all items. The strongest association observed in the validation sample was between escape and coping motivations. The Persian Motives for Online Gaming Questionnaire (MOGQ) has demonstrated adequate reliability and construct validity in prior work (16).
3.5. Data Analysis
The statistical approaches included: Descriptive statistics; tests of association (chi-square, Pearson correlation); group comparisons (ANOVA with Brown-Forsythe correction when variances were unequal); Tukey’s post-hoc contrasts (Games-Howell); and predictive modeling using stepwise linear regression. Assumption checks included evaluations of normality (Shapiro-Wilk test, and Q-Q plots), homogeneity of variances (Levene’s test; Brown-Forsythe when violated), linearity and independence (scatterplots and Durbin-Watson statistic), and multicollinearity (variance inflation factors, VIFs). When assumptions were violated, robust or nonparametric alternatives were employed to confirm the robustness of the findings (SPSS-26).
4. Results
Table 1 presents the frequencies and percentages of demographic variables by student’s gaming patterns.
Table 1.
Demographic Characteristics by Gaming Pattern Type a
| Variables | Social-Emotional Pattern | Academic-Professional Pattern | Chi-Square |
|---|---|---|---|
| Student | |||
| High school | |||
| First | 304 (46) | 290 (41) | 0.10 |
| Second | 404 (57) | 418 (59) | 0.05 |
| Total | 708 (51) | 708 (50) | 0.05 |
| Parent | |||
| Economic status | |||
| Average low | 290 (41) | 297 (42) | 0.09 |
| Average | 177 (25) | 191 (27) | 0.30 |
| Average high | 241 (34) | 219 (31) | 0.02 |
| Total | 708 (50) | 707 (50) | 0.07 |
| Father | |||
| Education level (y) | |||
| Illiterate | 318 (45) | 304 (43) | 0.07 |
| 12/14 | 248 (35) | 248 (35) | 0.03 |
| ≥ 16 | 142 (20) | 156 (22) | 0.20 |
| Total | 708 (50) | 708 (50) | 0.02 |
| Mother | |||
| Education level (y) | |||
| Illiterate | 283 (40) | 339 (48) | 0.10 |
| 12/14 | 233 (33) | 276 (39) | 0.02 |
| ≥ 16 | 192 (27) | 92 (13) | 0.001 |
| Total | 708 (50) | 708 (50) | < 0.001 |
a Values are expressed as No. (%).
Among first-period high school students, there is no significant difference between social-emotional and academic-professional gaming patterns (P > 0.05). However, when looking at the overall student population and, more specifically, second-period students, differences become statistically significant (P < 0.05). Economic status mattered as well. For families with average low economic status, the two gaming patterns did not differ significantly (P > 0.05). By contrast, among families with higher average economic status, a significant difference emerged (P < 0.05). Parental education also showed notable differences. Students whose mother has an education of 12th grade or higher displayed different patterns compared with others, and students whose father were illiterate were different from those who had an education of more than 16 years (P < 0.05). For fathers with 12 or 14 years of education, the two internet gaming patterns did not differ significantly (P > 0.05).
Beyond Table 1, this study asks how psychological motivations and game genres are related to students’ online gaming patterns, with the aim of identifying factors linked to internet gaming dependence and potential problematic use to inform preventive strategies. The analysis addressed three questions: (1) How gaming use, genres, and motivations are related to social-emotional and academic-professional outcomes; (2) whether psychological motivations predict gaming patterns; and (3) whether genre-specific differences exist in motivation and usage. We use a sequence of analyses: Correlation to explore association, ANOVA to test mean differences across game-genre groups, and regression analyses to model predictive relationships while controlling key covariates.
The study also examined how psychological motivations are related to different internet gaming patterns (social-emotional and academic-professional). Correlations tested associations between motivations and usage patterns, and regression assessed the predictive contribution of each motivation to the identified patterns, aligning with the stated objectives. To ensure rigor, four analytic checks were conducted. We tested normality with the Shapiro-Wilk test and Q-Q plots, applying nonparametric methods when needed. We assessed homogeneity of variances with Levene’s test and used Brown-Forsythe adjustments if violated. We checked linearity and independence via scatterplots and Durbin-Watson statistics, and we evaluated multicollinearity with VIFs. When minor deviations occurred, we cross-validated with nonparametric methods and used robust procedures, supporting the use of parametric tests for primary analyses.
Regarding the first research question — whether social-emotional and academic-professional patterns are related to psychological motivations — we used Pearson correlations (Table 2). Social-emotional gaming correlated positively with all motivations, strongest for escape (r ≈ 0.66) and with coping, imaging, skill, and entertainment (roughly: 0.40 - 0.66). Academic-professional patterns showed similar trends, with robust correlations for escape, coping, and imaging (r ≈ 0.55 - 0.64). All correlations were significant at P < 0.05, with overall values ranging from about 0.36 to 0.66, indicating that higher social-emotional engagement co-occurs with a broad set of psychological motivations.
Table 2.
Pearson Correlation Matrix: Social-Emotional Gaming Pattern with Motivations
| Variables | Social-Emotional Pattern | Escape | Coping | Imaging | Skill | Compete | Social | Entertain |
|---|---|---|---|---|---|---|---|---|
| Social-emotional pattern | 1 | |||||||
| Escape | 0.66 a | 1 | ||||||
| Coping | 0.64 a | 0.82 a | 1 | |||||
| Imaging | 0.59 a | 0.79 a | 0.79 a | 1 | ||||
| Skill | 0.59 a | 0.58 a | 0.73 a | 0.81 a | 1 | |||
| Compete | 0.47 a | 0.64 a | 0.63 a | 0.55 a | 0.51 a | 1 | ||
| Social | 0.46 a | 0.64 a | 0.68 a | 0.68 a | 0.70 a | 0.36 a | 1 | |
| Entertain | 0.36 a | 0.47 a | 0.55 a | 0.57 a | 0.57 a | 0.39 a | 0.73 a | 1 |
a A P-value of ≤ 0.05 is considered statistically significant.
Table 3 shows Pearson correlations between academic-professional gaming patterns and motivations. The associations are positive and significant across the board. The strongest link is with escape (r ≈ 0.64, P < 0.05), while entertainment shows the weakest tie (r ≈ 0.35 - 0.36, P < 0.05). Overall, effect sizes are moderate, ranging from about 0.35 to 0.64, indicating that academic-professional gaming activates multiple psychological motivations. The largest correlation is escape (r = 0.64); the smallest is entertainment (r ≈ 0.35 - 0.36). Across all motivations, correlations span roughly 0.35 - 0.64, with every coefficient reaching statistical significance at P < 0.05. Taken together, the pattern suggests multiple motivations accompany academic-professional gaming, with escape consistently the strongest link. Entertainment-related motivation tends to be weaker, though still significant.
Table 3.
Pearson Correlation Matrix: Academic-Professional Gaming Pattern with Motivations
| Variables | Academic-Professional Pattern | Escape | Coping | Imaging | Skill | Compete | Social | Entertain |
|---|---|---|---|---|---|---|---|---|
| Academic-professional pattern | 1 | |||||||
| Escape | 0.64 a | 1 | ||||||
| Coping | 0.57 a | 0.82 a | 1 | |||||
| Imaging | 0.55 a | 0.80 a | 0.79 a | 1 | ||||
| Skill | 0.54 a | 0.73 a | 0.81 a | 0.76 a | 1 | |||
| Compete | 0.46 a | 0.65 a | 0.68 a | 0.68 a | 0.70 a | 1 | ||
| Social | 0.44 a | 0.64 a | 0.63 a | 0.55 a | 0.51 a | 0.36 a | 1 | |
| Entertain | 0.35 a | 0.47 a | 0.55 a | 0.57 a | 0.57 a | 0.73 a | 0.39 a | 1 |
a A P-value of ≤ 0.05 is considered statistically significant.
Similarly, escape emerges as the strongest and most consistent correlate across both social-emotional and academic-professional patterns, with mid-to-high effect sizes (approximately r = 0.64 - 0.66) and P-values below 0.05. Coping, imaging, and skill also show meaningful associations, typically in the moderate-to-high range (social-emotional about r = 0.40 - 0.66; academic-professional: About r = 0.55 - 0.64). Entertainment remains weaker but significant, usually in the low-to-mid range (academic-professional: r = 0.35 - 0.36; social-emotional: r = 0.36 - 0.66). In short, higher engagement across gaming domains co-occurs with a broad set of motivations, with escape consistently the strongest driver. To test whether psychological motivations and gaming genres differ among students, we ran ANOVA with Brown-Forsythe corrections (Table 4).
Table 4.
ANOVA/Brown-Forsythe Results Comparing Motivations and Genres Based on Gaming Patterns a
| Variables and Levels | Social-Emotional Pattern | F | Academic-Professional Pattern | F |
|---|---|---|---|---|
| Game genre | 5.417 b | 8.526 b | ||
| Puzzle | 18.13 ± 5.79 | 19.63 ± 5.505 | ||
| Action | 25.48 ± 8.82 | 28.04 ± 7.825 | ||
| Strategic | 23.44 ± 5.91 | 27.00 ± 6.256 | ||
| Adventurous | 22.94 ± 5.43 | 25.13 ± 5.313 | ||
| Educational | 23.74 ± 8.43 | 25.42 ± 7.606 | ||
| Simulation | 22.86 ± 6.48 | 26.14 ± 5.131 |
a Values are expressed as mean ± SD.
b P ≤ 0.05.
Action games yielded higher usage scores than other genres for both social-emotional and academic-professional patterns. The analysis showed significant differences across genres — puzzle, action, strategic, adventurous, educational, and simulation — with Games-Howell post hoc tests identifying the key contrasts. Specifically, action and strategic genres showed the highest motivation and engagement overall. Puzzle games differed from several other genres in both patterns.
Tukey’s post hoc tests (Appendix 1 in Supplementary File) highlighted genre differences within social-emotional and academic-professional use. In social-emotional use, puzzle games differed from strategic and educational genres; in academic-professional use, puzzle differed from educational, simulation, and adventure genres. Significance was set at P < 0.05.
We used stepwise linear regression (Table 5) to test whether psychological motivations predict students’ internet gaming usage patterns.
Table 5.
Stepwise Regression: Psychological Motivations Predicting Gaming Patterns
| Step and Variable Added | B | SD | Beta | t | P-Value | Coefficient | R2 |
|---|---|---|---|---|---|---|---|
| 1 | 0.66 | 0.46 | |||||
| Social/emotional pattern | 8.443 | 0.931 | - | 9.067 | 0.001 | ||
| Avoidance | 0.925 | 0.159 | 0.403 | 5.825 | 0.001 | ||
| Coping+motivation | 0.743 | 0.165 | 0.312 | 4.505 | 0.001 | ||
| 2 | 0.65 | 0.42 | |||||
| Academic/professional pattern | 12.74 | 0.904 | - | 14.09 | 0.001 | ||
| Avoidance motivation | 1.128 | 0.126 | 0.527 | 8.945 | 0.001 | ||
| Skill+motivation | 0.344 | 0.124 | 0.163 | 2.766 | 0.006 |
For social-emotional patterns, avoidance and confrontation together explained about 46% of the variance (R2 = 0.46). The strongest predictors were escape (β = 0.66) and coping (β = 0.40), with age and gender included in the model. For academic-professional patterns, escape and related motivations accounted for about 42% of the variance (R2 = 0.42). The top predictor was escape (β = 0.65), followed by coping (β = 0.53) and skill (β = 0.34). All reported predictors were significant at P < 0.05, indicating that psychological motivations meaningfully explain variance in gaming patterns across both domains.
5. Discussion
This study explores how students’ gaming patterns (academic-professional and social-emotional) relate to underlying psychological motivations, and how these motivations align with different game genres and usage. We also examined whether motivations predict engagement across gaming patterns, finding a coherent link between need states and genre choices. Psychological motivations, particularly escape and coping, consistently shaped genre preferences and overall engagement. This supports a framework for targeted interventions that address core motivations behind gaming, rather than only trying to reduce screen time. Demographic factors, including academic year, family economic status, and parental education, significantly influence gaming-related difficulties. Consistent with prior work, second-year high school students showed greater academic and social challenges than first-year students, suggesting heightened vulnerability during this transition. Economic disadvantage and lower parental education were linked to more problematic gaming, underscoring the role of social-contextual conditions and the need for school- and family-centered supports (17-20). The motivation-engagement link aligns with literature revealing that escape and anxiety reduction predict higher engagement, reinforcing gaming as a coping resource for some students. Interventions should address underlying stressors and coping deficits, not just limit screen time (21-24).
Differences in motivations and genres between social-emotional and academic-professional patterns suggest nuanced interventions (20, 25, 26). Distinct genres satisfy different needs: Cognitive/strategic play for intellectual aims, excitement and emotion for action/adventure. This bidirectional dynamic — motivation guiding genre choice and genre reinforcing motivation — supports genre-informed approaches to steer engagement toward constructive outcomes (27). Tailoring content to learning objectives may boost engagement in educational domains. In support of this, one study (28) has explored hand-eye coordination performance among Iranian high school students, which may connect to the cognitive and motor demands of action and strategy-based gaming genres highlighted in our study. The findings imply that cognitive factors influence coordination, potentially explaining why certain genres are more engaging for students.
Motivation-focused interventions should address the escape and coping processes that drive gaming. Schools can integrate resilience-building, stress-management, and adaptive coping skills — such as mindfulness practices and strengthening social supports — into daily life. Pair these with structured breaks, time-management coaching, and guided redirection to constructive activities to reduce gaming as a coping mechanism. For thrill-seeking students, offer high-arousal, educational experiences (e.g., competitive problem-solving and team challenges) that satisfy stimulation needs while lowering risk. This creates a proactive framework that aligns coping strategies with engaging, constructive experiences across diverse motivational profiles. Brief motivational screening can identify primary motivations — escape, coping, achievement, and social connectedness — to tailor supports, with family engagement to offset resource constraints and bolster parental involvement given links between socioeconomic disadvantage and risk. At the policy level, digital well-being curricula should recognize gaming as a coping strategy for some students while fostering healthy boundaries, positive peer connections, and access to supportive resources.
A key limitation is the single-genre focus, which may limit generalizability. Contemporary gaming is often cross-genre, interacting with motivational profiles to yield different risk patterns. Future work should allow reporting across multiple genres and analyze cross-genre interactions for a more ecologically valid portrait of gaming patterns. Methodologically, reliance on a non-random, convenience sample with uneven gender representation could bias observed associations. Balancing gender representation and broad school or regional coverage through stratified random sampling would improve external validity. Practical implications include tailoring interventions to psychological motivations, especially escape and coping. Schools can prioritize resilience and coping skills embedded in daily routines, with breaks and time-management guidance to reduce gaming dependence. For thrill-seekers, provide constructive, high-energy, educational activities. Brief motivational screening can inform individualized supports, while family engagements address resource gaps. Policywide, acknowledge gaming as a coping strategy for some students and promote healthy boundaries and access to support.
5.1. Conclusions
This study clarifies how psychological motivations underlie students’ internet game use across academic-professional and social-emotional domains, and how these motives align with genre preferences and usage patterns. Across analyses, escape, coping, and thrill-seeking consistently predict engagement, underscoring gaming as a coping resource for some students and a potential risk for others. The findings reveal a clear pattern: Psychological motivations shape genre choices and overall engagement, offering a simple lens for interpreting gaming behavior and guiding targeted interventions.
A key practical implication is the need for balanced gaming and prevention strategies that acknowledge individual motivations. Interventions should steer escape- and coping-driven youth toward adaptive coping strategies, resilience-building, and structured, non-gaming activities to reduce reliance on games. For thrill-seekers, provide high-arousal but constructive options — collaborative problem-solving challenges or supervised competitive activities — that satisfy stimulation while reducing risk. Schools and practitioners can use brief motivational screening to identify primary motivations (escape, coping, achievement, social connectedness) and tailor supports accordingly. Engaging families and addressing contextual risk factors, such as economic and educational disadvantage, are essential to prevention. Interpretation should note limitations. The cross-sectional design limits causal claims, and the non-random, convenience sample with uneven gender representation may bias results and limit generalizability. Future work should employ longitudinal designs, more representative sampling, examine platform and cross-genre use, and include moderators (personality traits, cognitive factors) to sharpen causal inferences and interventions. Despite these caveats, the study advances theory and practice by linking motivations to genre preferences and outlining actionable directions for policy and education.