1. Background
Excessive alcohol use remains an important public health concern in the United States because it contributes to injuries, chronic disease, social harm, and premature mortality. In U.S. surveillance systems, heavy drinking is commonly defined as an average of more than two drinks per day for men and more than one drink per day for women, equivalent to more than 14 drinks per week for men and more than 7 drinks per week for women (1, 2). Although alcohol-related harms are well established, the association between alcohol consumption and cardiovascular outcomes has been difficult to interpret because drinking patterns and history, age, sex, comorbidities, and changes in alcohol use after illness can influence observed relationships (3-5).
Coronary heart disease (CHD) continues to impose a substantial burden on population health and health care resources. Because CHD is shaped by behavioral, metabolic, demographic, and social factors, surveillance data can help characterize how self-reported CHD or angina varies across subgroups and how it is associated with modifiable behaviors, including smoking, physical activity, body weight, and alcohol consumption (6-8).
Prior studies have reported mixed findings regarding alcohol use and cardiovascular outcomes. Some cohort and meta-analytic studies have reported lower cardiovascular event rates among light or moderate drinkers than among abstainers, whereas others have emphasized the roles of bias, measurement limitations, misclassification of former drinkers, and heavy drinking episodes (9-20). These concerns are particularly important when interpreting cross-sectional data because the timing of alcohol exposure relative to cardiovascular diagnosis cannot be established.
Recent evidence also supports a broader view of alcohol-related health outcomes that includes mental health, metabolic disease, and vascular pathology. Rafiei et al. (21) reported an association between alcohol use and panic disorder among U.S. adults, emphasizing the behavioral health context of alcohol exposure. Alavian and Zadi (22) described evidence linking non-alcoholic fatty liver disease to CHD risk, underscoring the relevance of cardiometabolic pathways. Dahmardeh et al. (23) found that carotid intima-media thickness was associated with coronary artery stenosis in patients undergoing angiography, supporting the importance of vascular markers in understanding coronary disease.
2. Objectives
The present study used 2016 - 2021 BRFSS data to estimate the association between heavy alcohol consumption and self-reported angina or CHD among U.S. adults. The analysis also examined whether this association varied across subgroups defined by age, sex, race/ethnicity, physical activity, and overweight/obesity status. The objective was descriptive and associational; this study was not designed to determine whether heavy alcohol consumption causes, prevents, or reduces the risk of CHD or angina.
3. Methods
3.1. Study Design and Data Source
This study was a cross-sectional secondary analysis of the 2016 - 2021 Behavioral Risk Factor Surveillance System (BRFSS). The BRFSS is an annual telephone-based surveillance system that collects information on health-related behaviors, chronic conditions, health care access, and preventive practices from noninstitutionalized adults aged 18 years or older in U.S. states and participating territories (2, 23). Public-use BRFSS data files were pooled across survey years for this analysis. The pooled dataset included 2,586,321 respondents with complete information on the outcome, heavy alcohol consumption, and the covariates included in the analytic models.
3.2. Outcome Variable
The primary outcome was self-reported angina or coronary heart disease. The BRFSS variable used was CVDCRHD4. The questionnaire item asks: “Has a doctor, nurse, or other health professional ever told you that you had angina or coronary heart disease?” (24). Response options were coded as 1 = Yes, 2 = No, 7 = Don’t know/Not sure, and 9 = Refused. For this analysis, CVDCRHD4 was recoded as a binary variable (Yes = 1 and No = 0). Respondents with “Don’t know/Not sure,” “Refused,” missing, or otherwise invalid responses were excluded from analyses involving this outcome. This was a single combined BRFSS item and was not an author-created composite of separate CHD and angina questions; therefore, separate sensitivity analyses for CHD and angina were not possible using this BRFSS item.
3.3. Exposure Variable
The exposure of interest was heavy alcohol consumption. We used the year-specific Centers for Disease Control and Prevention (CDC)-calculated heavy-drinking variable available in the BRFSS public-use files: _RFDRHV5 for 2016 - 2017, _RFDRHV6 for 2018 - 2019, and _RFDRHV7 for 2020 - 2021 (1, 25, 26). These variables classify respondents as heavy drinkers when average consumption exceeds 14 drinks per week for men or 7 drinks per week for women. The CDC-calculated variables are derived from alcohol-use frequency and quantity items, including ALCDAY5, average drinks per drinking occasion, the derived drinks-per-week variable (_DRNKWEK or _DRNKWK1 depending on survey year), and the sex variable used by the CDC for that survey year. Heavy alcohol consumption was coded as Yes = 1 and No = 0. Missing, refused, “don’t know/not sure,” and implausible alcohol responses were excluded according to CDC-calculated-variable coding and complete-case analytic rules.
3.4. Covariates
Covariates were selected based on established associations with cardiovascular disease and alcohol-related health behaviors and on availability across all included BRFSS years. The adjusted model included age group, sex, race/ethnicity, smoking status, physical activity/exercise, and overweight/obesity status. Age was categorized as 18 - 24, 25 - 34, 35 - 44, 45 - 54, 55 - 64, and 65 years or older. Sex was analyzed as male or female, consistent with the BRFSS variable available for the survey years. Race/ethnicity was categorized as non-Hispanic White, non-Hispanic Black, non-Hispanic Other race, non-Hispanic Multiracial, and Hispanic. Smoking status was coded as current or former smoking versus no smoking based on the smoking variable available in the analytic dataset. Physical activity was coded as Yes/No based on whether respondents reported participating in physical activity or exercise outside of regular employment during the past 30 days. Overweight/obesity status was coded as Yes/No based on the BRFSS body mass index category indicating overweight or obesity. Socioeconomic status, diet, medication use, health care access, hypertension, diabetes, and other comorbidities were not included in the final model because the primary analysis was designed to match the prespecified covariate set used in the original analysis and to maintain consistent availability across years; their omission is addressed as residual confounding in the Discussion.
3.5. Missing Data and Analytic Denominator
A complete-case approach was used for each analysis. Respondents were excluded from a given model if they had missing, refused, “don’t know/not sure,” or invalid responses for the outcome, heavy alcohol variable, survey design variables, or any covariate required for that model. Consequently, the analytic denominator varied across descriptive, overall adjusted, and stratified analyses depending on variable availability. Weighted counts and percentages are reported for descriptive tables, whereas regression models used BRFSS survey design variables to estimate population-representative odds ratios and 95% confidence intervals.
3.6. Statistical Analysis
Weighted descriptive statistics were used to summarize the prevalence of self-reported angina or CHD and heavy alcohol consumption from 2016 through 2021. Survey-weighted logistic regression was used to estimate crude odds ratios (ORs) and adjusted odds ratios (aORs) with 95% confidence intervals (CIs). The adjusted model included age group, sex, race/ethnicity, smoking status, physical activity, and overweight/obesity status. Subgroup analyses were conducted using separate stratified survey-weighted logistic regression models by age, sex, race/ethnicity, physical activity, and overweight/obesity status. Formal multiplicative interaction tests were not conducted; therefore, comparisons of aORs across subgroups are descriptive and should not be interpreted as statistically tested differences between strata. SAS PROC SURVEYFREQ and PROC SURVEYLOGISTIC were used to account for the BRFSS complex survey design using final weight (_LLCPWT), strata (_STSTR), and primary sampling unit (_PSU). All analyses were performed using SAS version 9.4 (SAS Institute Inc., Cary, NC, USA). Statistical significance was defined using a two-sided alpha level of 0.05.
3.7. Ethical Approval and Informed Consent
This study used publicly available, de-identified BRFSS data provided by the CDC. Because the data are de-identified public-use surveillance data, this secondary analysis did not require institutional review board (IRB) approval. Informed consent was obtained as part of the original BRFSS data collection process, and no additional informed consent was required for this secondary analysis.
4. Results
The pooled analytic sample included 2,586,321 respondents from the 2016 - 2021 BRFSS. Across survey years, the weighted prevalence of self-reported angina or CHD was 4.11%, and the weighted prevalence of heavy alcohol consumption was 6.33%.
In weighted descriptive analyses, respondents classified as heavy drinkers had a lower prevalence of angina or CHD than those not classified as heavy drinkers (2.69% vs. 4.28%; Table 1). In the adjusted survey-weighted logistic regression model, heavy alcohol consumption was associated with lower odds of angina or CHD (aOR = 0.66; 95% CI, 0.62 - 0.71; Table 2). This estimate should be interpreted as a cross-sectional association rather than as evidence of a causal or protective effect.
Table 1.
Weighted Demographic Characteristics by Angina or Coronary Heart Disease Status a
| Variables | Angina/CHD (Yes) | Angina/CHD (No) | Total |
|---|---|---|---|
| Age | |||
| 18 - 24 | 653,094 (0.35) | 185,240,050 (99.65) | 185,893,144 |
| 25 - 34 | 1,432,394 (0.55) | 260,542,515 (99.45) | 261,974,909 |
| 35 - 44 | 2,821,975 (1.15) | 243,373,878 (98.85) | 246,195,853 |
| 45 - 54 | 6,939,254 (2.84) | 237,491,018 (97.16) | 244,430,272 |
| 55 - 64 | 14,607,963 (5.89) | 233,462,496 (94.11) | 248,070,459 |
| ≥ 65 | 35,203,059 (11.16) | 280,109,577 (88.84) | 315,312,636 |
| Gender | |||
| Female | 25,451,490 (3.30) | 745,292,408 (96.70) | 770,743,898 |
| Male | 36,118,838 (4.94) | 694,288,891 (95.06) | 730,407,729 |
| Non-Hispanic | |||
| White | 44,394,635 (4.85) | 870,721,139 (95.15) | 915,115,774 |
| Black | 5,891,464 (3.39) | 167,989,137 (96.61) | 173,880,601 |
| Other | 2,746,382 (2.59) | 103,335,999 (97.41) | 106,082,381 |
| Multiracial | 834,053 (4.15) | 19,257,174 (95.85) | 20,091,227 |
| Hispanic | 6,314,252 (2.47) | 249,691,862 (97.53) | 256,006,114 |
| Smoke | |||
| Yes | 35,586,603 (6.38) | 521,852,823 (93.62) | 557,439,425 |
| No | 23,381,257 (2.71) | 840,117,674 (97.29) | 863,498,930 |
| Heavy alcohol | |||
| Yes | 2,351,325 (2.69) | 84,908,456 (97.31) | 87,259,781 |
| No | 55,217,826 (4.28) | 1,236,268,534 (95.72) | 1,291,486,360 |
| Exercise | |||
| Yes | 36,759,897 (3.35) | 1,061,413,465 (96.65) | 1,098,173,362 |
| No | 23,492,283 (6.50) | 337,852,662 (93.50) | 361,344,945 |
| Overweight/obesity | |||
| Yes | 44,055,493 (4.93) | 849,505,912 (95.07) | 893,561,405 |
| No | 13,309,419 (2.91) | 444,726,817 (97.09) | 458,036,236 |
a Values are expressed as No. (%). Race categories are mutually exclusive; White, Black, Other, and Multiracial refer to non-Hispanic respondents. Overweight/obesity indicates respondents classified as overweight or obese using BRFSS body mass index categories. Abbreviation: CHD, coronary heart disease.
Table 2.
Survey-Weighted Logistic Regression Analysis of Angina or Coronary Heart Disease a
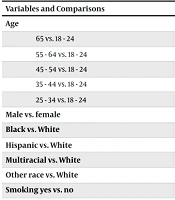
| Variables and Comparisons | Crude OR | Crude P-Value | Crude 95% CI | Adjusted OR | Adjusted P-Value | Adjusted 95% CI |
|---|---|---|---|---|---|---|
| Age | ||||||
| 65 vs. 18 - 24 | 35.64 | < 0.0001 | 30.40 - 41.78 | 31.19 | < 0.0001 | 26.04 - 37.35 |
| 55 - 64 vs. 18 - 24 | 17.74 | < 0.0001 | 15.12 - 20.83 | 15.57 | < 0.0001 | 12.98 - 18.67 |
| 45 - 54 vs. 18 - 24 | 8.29 | < 0.0001 | 7.04 - 9.75 | 7.53 | < 0.0001 | 6.27 - 9.06 |
| 35 - 44 vs. 18 - 24 | 3.29 | < 0.0001 | 2.76 - 3.92 | 2.88 | < 0.0001 | 2.37 - 3.49 |
| 25 - 34 vs. 18 - 24 | 1.56 | < 0.0001 | 1.30 - 1.88 | 1.37 | 0.0029 | 1.12 - 1.69 |
| Male vs. female | 1.52 | < 0.0001 | 1.49 - 1.56 | 1.59 | < 0.0001 | 1.55 - 1.64 |
| Black vs. White | 0.69 | < 0.0001 | 0.66 - 0.72 | 0.87 | < 0.0001 | 0.83 - 0.91 |
| Hispanic vs. White | 0.50 | < 0.0001 | 0.47 - 0.52 | 0.85 | < 0.0001 | 0.80 - 0.90 |
| Multiracial vs. White | 0.85 | 0.0004 | 0.78 - 0.93 | 1.28 | < 0.0001 | 1.15 - 1.41 |
| Other race vs. White | 0.52 | < 0.0001 | 0.48 - 0.56 | 0.95 | 0.28 | 0.87 - 1.04 |
| Smoking yes vs. no | 2.45 | < 0.0001 | 2.39 - 2.51 | 1.74 | < 0.0001 | 1.69 - 1.78 |
| Heavy alcohol yes vs. no | 0.62 | < 0.0001 | 0.58 - 0.66 | 0.66 | < 0.0001 | 0.62 - 0.71 |
| Heavy alcohol among females | 0.49 | < 0.0001 | 0.44 - 0.54 | 0.55 | < 0.0001 | 0.49 - 0.61 |
| Heavy alcohol among males | 0.69 | < 0.0001 | 0.63 - 0.75 | 0.75 | < 0.0001 | 0.68 - 0.82 |
| Heavy alcohol age | ||||||
| 18 - 24 | 2.08 | 0.0015 | 1.32 - 3.26 | 1.64 | 0.06 | 0.97 - 2.77 |
| 25 - 34 | 1.14 | 0.34 | 0.87 - 1.49 | 0.92 | 0.58 | 0.67 - 1.25 |
| 35 - 44 | 1.08 | 0.66 | 0.78 - 1.49 | 0.87 | 0.44 | 0.61 - 1.24 |
| 45 - 54 | 0.94 | 0.50 | 0.77 - 1.14 | 0.77 | 0.01 | 0.63 - 0.94 |
| 55 - 64 | 0.68 | < 0.0001 | 0.59 - 0.78 | 0.60 | < 0.0001 | 0.51 - 0.69 |
| > 65 | 0.66 | < 0.0001 | 0.61 - 0.72 | 0.59 | < 0.0001 | 0.55 - 0.65 |
| Heavy alcohol | ||||||
| White | 0.55 | < 0.0001 | 0.51 - 0.59 | 0.64 | < 0.0001 | 0.59 - 0.68 |
| Black | 0.59 | 0.0005 | 0.44 - 0.79 | 0.65 | 0.0069 | 0.47 - 0.89 |
| Other race | 0.76 | 0.13 | 0.54 - 1.09 | 0.67 | 0.04 | 0.45 - 0.99 |
| Multiracial | 0.48 | 0.0002 | 0.32 - 0.71 | 0.57 | 0.01 | 0.37 - 0.88 |
| Hispanic | 0.96 | 0.81 | 0.71 - 1.31 | 1.05 | 0.76 | 0.75 - 1.49 |
| Among exercisers | 0.63 | < 0.0001 | 0.58 - 0.68 | 0.67 | < 0.0001 | 0.62 - 0.74 |
| Among non-exercisers | 0.65 | < 0.0001 | 0.58 - 0.73 | 0.66 | < 0.0001 | 0.58 - 0.74 |
| Among overweight/obese | 0.63 | < 0.0001 | 0.58 - 0.68 | 0.70 | < 0.0001 | 0.64 - 0.76 |
| Among not overweight/obese | 0.57 | < 0.0001 | 0.51 - 0.64 | 0.59 | < 0.0001 | 0.53 - 0.66 |
| Exercise yes vs. no | 0.50 | < 0.0001 | 0.49 - 0.51 | 0.63 | < 0.0001 | 0.61 - 0.64 |
| Overweight/obesity yes vs. no | 1.73 | < 0.0001 | 1.68 - 1.78 | 1.40 | < 0.0001 | 1.36 - 1.44 |
a Adjusted models included age group, sex, race/ethnicity, smoking status, physical activity, and overweight/obesity unless the stratifying variable was the subgroup under analysis. Subgroup rows represent separate stratified survey-weighted logistic regression models, not formal interaction models. Formal multiplicative interaction tests were not conducted. White, Black, Other race, and Multiracial refer to non-Hispanic respondents. Abbreviations: OR = odds ratio; CI = confidence interval; CHD = coronary heart disease.
The prevalence of angina or CHD increased descriptively with age, from 0.35% among adults aged 18 - 24 years to 11.16% among adults aged 65 years or older. Compared with adults aged 18 - 24 years, the adjusted odds of angina or CHD were higher in each older age group, with the largest estimate among adults aged 65 years or older (aOR = 31.19; 95% CI, 26.04 - 37.35). Male respondents had higher adjusted odds of angina or CHD than female respondents (aOR = 1.59; 95% CI, 1.55 - 1.64).
Race/ethnicity, smoking, physical activity, and overweight/obesity were also associated with angina or CHD. Compared with non-Hispanic White adults, non-Hispanic Black adults (aOR = 0.87; 95% CI, 0.83 - 0.91) and Hispanic adults (aOR = 0.85; 95% CI, 0.80 - 0.90) had lower adjusted odds, whereas non-Hispanic Multiracial adults had higher adjusted odds (aOR = 1.28; 95% CI, 1.15 - 1.41). Smoking was associated with higher adjusted odds (aOR = 1.74; 95% CI, 1.69 - 1.78), whereas physical activity was associated with lower adjusted odds (aOR = 0.63; 95% CI, 0.61 - 0.64). Overweight or obesity was associated with higher adjusted odds of angina or CHD (aOR = 1.40; 95% CI, 1.36 - 1.44).
Exploratory stratified models suggested variation in the association between heavy alcohol consumption and angina or CHD across subgroups (Table 2). Among adults aged 18 - 24 years, the adjusted estimate was elevated but did not reach conventional statistical significance (aOR = 1.64; 95% CI, 0.97 - 2.77). Among older age groups, heavy alcohol consumption was generally associated with lower odds of angina or CHD. Similar inverse associations were observed in male and female strata and in several race/ethnicity strata. Because formal interaction tests were not conducted and confidence intervals varied across subgroups, these findings should be considered exploratory.
5. Discussion
This analysis of 2016 - 2021 BRFSS data found that heavy alcohol consumption was inversely associated with self-reported angina or CHD after adjustment for selected demographic and behavioral covariates. The association varied across exploratory subgroup analyses; however, the overall pattern must be interpreted cautiously because the BRFSS is cross-sectional and the outcome reflects a lifetime history of diagnosis rather than incident disease. This cautious interpretation is consistent with prior literature emphasizing bias, reference-group selection, and temporal ambiguity in alcohol-cardiovascular associations (17-19).
The inverse association observed in this study should not be interpreted as evidence that heavy alcohol use prevents angina or CHD. Several non-causal explanations are plausible. First, reverse causation may occur if adults reduce or stop drinking after receiving a cardiovascular diagnosis, causing people with existing CHD or angina to be classified as non-heavy drinkers at the time of the survey. Second, former-drinker bias may occur if respondents who previously drank heavily are included in the non-heavy or nondrinking comparison group after illness-related behavior change. Third, survivor bias may influence cross-sectional estimates if individuals with both heavy drinking and severe cardiovascular disease are less likely to survive or participate in the survey. Fourth, residual confounding may remain because the final model did not include income, education, diet, medication use, access to care, diabetes, hypertension, or detailed lifetime drinking patterns.
These interpretation issues are important because heavy alcohol consumption has well-established adverse health consequences. Therefore, the lower observed odds in this BRFSS analysis should be framed as an epidemiologic finding that requires further evaluation, not as a public health recommendation or clinical benefit. Cardiovascular risk communication should continue to emphasize evidence-based prevention, including smoking cessation, physical activity, weight management, blood pressure control, diabetes prevention and management, and avoidance of excessive alcohol use. These findings should also be interpreted in light of related evidence on alcohol-linked mental health outcomes, cardiometabolic risk, and vascular disease markers (20-22). Complementary preventive approaches involving cardiovascular health promotion have also been discussed in the literature (27).
The subgroup analyses provide descriptive information about possible heterogeneity. For example, the adjusted association among adults aged 18 - 24 years was elevated but imprecise, whereas inverse associations were observed in several older age groups. However, these subgroup analyses were exploratory, and formal interaction tests were not conducted. Differences in point estimates across strata should therefore be interpreted as hypothesis-generating rather than evidence of statistically distinct subgroup effects.
5.1. Strengths and Limitations
This study has several strengths. It used a very large national surveillance dataset, applied BRFSS survey weights and design variables, and examined several clinically and public-health-relevant subgroups. The analysis also used a standardized CDC-calculated heavy-drinking variable and a consistent BRFSS self-reported angina or CHD item across survey years.
This study also has important limitations. The cross-sectional design precludes determination of temporality. Both alcohol consumption and CHD/angina history were self-reported and may be affected by recall error, social desirability bias, or misclassification. The outcome was a combined BRFSS item; therefore, separate analyses for angina and CHD were not possible. The analysis did not distinguish current abstainers from lifetime abstainers or former drinkers, did not measure lifetime alcohol exposure or heavy drinking episodes, and did not assess changes in drinking after cardiovascular diagnosis. Residual confounding by socioeconomic status, diet, health care access, comorbidities, medications, and clinical risk factors may have influenced the results. Finally, multiple subgroup analyses increase the possibility of chance findings. Dietary patterns may also contribute to cardiovascular disease risk (28).
5.2. Conclusions
Heavy alcohol consumption was associated with lower observed odds of self-reported angina or CHD in this pooled 2016 - 2021 BRFSS analysis. Because the study was cross-sectional and subject to reverse causation, former-drinker bias, survivor bias, and residual confounding, the findings should not be interpreted as evidence that heavy alcohol consumption reduces the risk of CHD or angina. Longitudinal studies with detailed drinking histories and incident cardiovascular outcomes are needed to clarify the temporal and causal relationship between alcohol consumption patterns and cardiovascular disease.