
1. Background
Infections during pregnancy are relatively prevalent, which are a result of alterations in pregnant women’s cell-mediated immunity (1). Puerperal infections along with pre-eclampsia/eclampsia and obstetrical hemorrhage are the main causes of maternal mortality in low-income countries, whereas the numbers of deaths due to indirect and late maternal causes predominate in high-income countries (2).Despite advances in patient care and global progress towards reducing maternal mortality, sepsis remains a leading cause of preventable maternal death. Most postpartum infections take place after hospital discharge, typically 24 hours after delivery (3). Sepsis accounts for approximately 10% of all maternal deaths (1). Puerperal sepsis causes at least 75000 maternal deaths every year, mostly in low-income countries (4). Postpartum infections may also result in maternal morbidities which includes a wide range of maternal complications such as septicemia, endotoxic shock, peritonitis or abscess formation leading to surgery and compromised future fertility (3). For each maternal death associated with puerperal infections, around 50 women experience life-threatening morbidity from sepsis (5). Studies from high-income countries have reported that the incidence of maternal morbidity due to sepsis changed between 0.1 to 0.6 cases per 1000 deliveries (4).
Some of patient factors predisposing to the development of puerperal infection include home birth in unhygienic conditions, prolonged labor with or without rupture of membranes, multiple vaginal examinations in labor, obstetrical maneuvers, retained secundines within the uterus and postpartum hemorrhage (3). In addition, it has been shown that pre-existing medical problems, febrile illness or taking antibiotics during 2 weeks prior to presentation, operative vaginal delivery and cesarean section may be associated with sever puerperal infections (5).
However, to date, little is known about the hospital-related factors that predispose pregnant women to puerperal infection.
The Islamic Republic of Iran has achieved a remarkable decrease in maternal mortality ratio in just over three decades, which has been coupled with a paradigm shift in the most important causes of maternal death from postpartum hemorrhage and infection to indirect causes of maternal mortality (6). However, the maternal mortality ratio in some parts of the country such as Sistan and Balouchetsan province, southeast of Iran is disproportionately higher than the average national rates and puerperal infections remain a major cause of maternal deaths in these under-privileged areas of the country (7). Since the implementation of health system reform in Iran in 2014, which promotes free-of-charge normal vaginal deliveries, hospitals have experienced increased use of health facilities for labor and delivery care. This transition to facility based childbirth can alleviate the risks of infections associated with home deliveries that take place in unhygienic conditions. However, similar to what has been experienced in some developing countries, because of poor infection control (IC) practices in labor and delivery units, with an increase in the use of health facilities, it could be excepted that the rates of puerperal sepsis will be on the rise (8). Therefore, it would be prudent to assess the procedures and practices related to IC in labor and delivery units and to identify factors contributing to the development of puerperal infections. Those information could be used to prevent healthcare associated infections among pregnant women and to protect their health.
2. Objectives
The objective of this study was to investigate infection control program management and related procedures and practices during childbirth as reported by staff and through observation by researchers in labor and delivery units within teaching and non-teaching public hospitals in Zahedan, southeast Iran.
3. Patients and Methods
This cross-sectional study that was conducted between March to September 2014 included IC program management data related to four labor and delivery units in teaching and non-teaching hospitals in Zahedan, southeast Iran.
A 108-item semi-structured questionnaire was used for data collection. The questionnaire was developed based on a comprehensive literature review and after considering the IC checklists and protocols provided by the Iranian ministry of health and medical education (9-11). The questionnaire included 3 main sections. The first section was assessing the IC program management and included questions on human resources (3 questions), IC program system (7 questions), healthcare workers post-exposure measures (12 questions), and medical waste management (14 questions). The second section comprised of 26 questions for assessment of the infrastructures, equipments and supplies related to IC practices at the labor and maternity units. The third section was looking into the IC practices by midwives working in the labor and delivery units. This section included questions on hand hygiene (7 questions), scrub for normal vaginal delivery (11 questions), equipments and supplies hygiene (12 questions), administering prophylactic antibiotics during labor and delivery (3 questions), safe injection (3 questions) and post-partum care (3 questions).
In order to assess the validity of the study questionnaire, the feedback from a panel of 10 experts (including obstetricians, midwives, public health professionals, maternal and child health experts and medical doctors) was used to estimate the content validity ratio (CVR) and content validity index. The questions with a CVR less than 0.62 were either modified or removed (12). The reliability of the questionnaire was established with a Kuder-Richardson 20 coefficient of 0.71.
Data collection was performed by a team of trained midwives not working in the delivery units under investigation. The data for the first section was collected during an interview with the midwives who were head of labor and delivery units. Information for the second section was collected during the visit to the labor and maternity unit. The third section of the questionnaire was completed through observing midwives at the time of services delivery. The midwives practices performed during the different stages of delivery were observed and recorded on an observation sheet and the records related to IC were reviewed. A roster of shifts for midwives from each hospital was obtained. In order to account for workload that is likely to influence the IC practices, the observations took place during day, afternoon, and night shifts both on weekdays and weekends. In each shift two practicing midwives were randomly selected from the roster for observation. Previously observed midwives were replaced by those not observed for assessment. The inspections were continued until the IC practices by all midwives on the roster for each labor and delivery unit were investigated.
For data analysis, a score of one was given for each question related to the items available in the labor units. The score for each section of the questionnaire was calculated by summing up the scores for questions included in that section. Within each section, all questions contributed equally to the final score. Categorical variables were presented as counts and percentages. Mann-Whitney U and Kruskal-Wallis tests were used for comparing the differences in the IC scores between pairs and more than two of groups, respectively. Bonferroni correction was applied for multiple comparisons. A P value < 0.05 was considered significant for all analyses. SPSS version 20 statistical software package (Chicago, IL) was used for data analysis.
The study was approved by Zahedan University of Medical Sciences ethics committee.
4. Results
4.1. Infection Control Program Management and Infrastructures
IC program management system checklist included 21 items. As presented in Table 1, the score for the four labor and maternity units (defined as A, B, C and D) were 11 (52.4%), 8 (38.1%), 15 (71.4%) and 14 (66.7%), respectively. In terms of healthcare workers’ (HCWs) post-exposure measures checklist, out of 41 items only 30 (73.2%), 24 (58.5%), 38 (92.7%) and 35 (85.47%) items were found to be available in the maternity units. Out of 41 items for medical waste management checklist, only 20 (87.0%), 19 (82.6%), 20 (87.0%) and 17 (73.9%) items were routinely performed in the maternity units. Regarding the IC-related standard infrastructures and equipments, out of 28 items included in the checklist only 22 (75.9%), 16 (55.9%), 24 (82.8%), and 23 (79.3%) were available in the four maternity units investigated.
Table 1.
The Comparison of the Proportion of the Overall Evaluation Scores for Different Aspects of Infection Control Program Obtained by Four Labor and Maternity Units, Defined As A, B, C and Da
| Total Score | Labor and Maternity Units | All hospitals | ||||
|---|---|---|---|---|---|---|
| A | B | C | D | |||
| Infection control program management system | 21 | 11 (52.4) | 8 (38.1) | 15 (71.4) | 14 (66.7) | 48 (57.1) |
| Healthcare workers post-exposure measures | 41 | 30 (73.2) | 24 (58.5) | 38 (92.7) | 35 (85.4) | 127 (77.4) |
| Medical waste management | 41 | 20 (48.8) | 19 (46.3) | 20 (48.8) | 17 (41.5) | 76 (46.3) |
| Standard infrastructures and equipments | 28 | 22 (78.6) | 16 (57.1) | 24 (85.7) | 23 (82.1) | 85 (75.9) |
aScores are expressed as No. (%) unless otherwise indicated.
All of the maternity units reported that they had IC committees and IC protocols were in place (Table 2). Only half of hospitals reported that they had an infectious diseases screening protocols for newly employed staff. All maternity units except one screened for hepatitis B, but only one reported screening for hepatitis C, hepatitis A, and tuberculosis. Half of the facilities had a screening for HIV and none checked the new staff immunization status against measles and rubella. Written hepatitis B exposure guidelines were available for only 3 (75%) of maternity units, HIV exposure guidelines for two (50%) and hepatitis C and meningococcal meningitis guidelines for only one (25%) of facilities. Healthcare workers (HCWs) IC trainings were carried out in all maternity units during the previous year that included hand hygiene and universal precaution measures. However, the training courses did not cover more specific subjects such as surgical site infection, prevention of IV catheter infection and chorioamnionitis, etc. Following occupational exposure, all the hospitals carried out source patient testing for HBsAg, but only one tested for HBcAg and HBeAg. Only one hospital checked source patients for hepatitis C and three examined for HIV. In all labor and delivery units only cleaners were in charge of medical waste management, though the clinical staff also received training regarding this subject. Segregation of medical waste was carried out in all but one maternity unit, and safety boxes were available in all hospitals.
Table 2.
The Proportion of the Evaluation Scores for Details of Infection Control Program Obtained by Labor and Maternity Units of All Hospitals
| Type of Activity | Yes, % |
|---|---|
| A: Infection Control Program Management | |
| Infection control program | 100 |
| Infection control team | 100 |
| Medical Assessment | 100 |
| Infections Screening | 75 |
| Lab tests | 75 |
| HCWs vaccination | 100 |
| Nosocomial infection treatment and prevention | 100 |
| Training on counseling | 100 |
| New staff screening for: | |
| Hepatitis A | 25 |
| Hepatitis B | 75 |
| Hepatitis C | 25 |
| HIV | 50 |
| Measles | 0 |
| Rubella | 0 |
| Limiting work by infected HCWs for: | |
| HBsAg | 0 |
| HIV | 0 |
| B: HCWs Post-Exposure Measures | |
| Post-exposure guidelines for: | |
| Hepatitis B | 75 |
| Hepatitis C | 25 |
| HIV | 50 |
| Meningococcal infections | 25 |
| Focal point for post-exposure measures available | 100 |
| Patient source testing for: | |
| HBsAg | 100 |
| HB core Ag | 25 |
| HBeAg | 25 |
| Hepatitis C | 25 |
| HIV | 75 |
| Access to vaccines and immunoglobulin in less than 24 hours for hepatitis B exposure | 100 |
| Access to ARV medication in less than 6 hours for HIV exposure | 75 |
| Medical profile contents | 100 |
| HCWs occupational exposure record taking | 100 |
| Attending IC training courses during last year | 100 |
| Cleaning protocols available | 100 |
| C: Medical Waste Management | |
| Waste management staff | 100 |
| Clinical staff training | 100 |
| Cleaners training | 100 |
| WM performance evaluation | 100 |
| Medical waste segregation | 100 |
| Segregated waste coding | 75 |
| Specific containers for medical waste | 100 |
| standard number of containers for medical waste | 100 |
| Type of personal protective gear used when handling medical waste | |
| Gloves | 100 |
| Eye shields | 0 |
| Boots | 75 |
| Masks | 0 |
| Special containers available for medical waste | 75 |
| Safe disposal of medical waste | 100 |
| Safe collection and transport of medical waste | 100 |
| Safety boxes are available | 100 |
| Safety boxes disposed of when 3/4 full | 50 |
Abbreviations: ARV, anti-retroviral; HCW, healthcare worker; IC, infection control.
4.2. Observed Infection Control Practices
A total of 88 midwives working in labor and delivery units in the four hospitals were observed for IC practices, out of which 48 (54.5%) were from teaching hospitals (Table 3). Almost half of the midwives were in the age group younger than 30 years old, were temporarily employed by hospitals and had a work experience of less than 5 years. A quarter of midwives were observed on the weekends and the rest of assessments took place during Saturday or other weekdays. Nearly half of the assessments were carried out during afternoon shifts and only 13.6% of observations were during night shifts.
Table 3.
Midwives Age Group and Work Schedule Characteristics, Zahedan, 2014
| Variable | Frequency (%) |
|---|---|
| Hospital | |
| Teaching | 48 (54.5) |
| Non-teaching | 40 (45.5) |
| Age group, y | |
| < 30 | 41 (46.6) |
| 30 - 3 | 23 (26.1) |
| > 35 | 24 (27.3) |
| Employment | |
| Permanent | 45 (51.1) |
| Temporary | 43 (48.9) |
| Work experience, y | |
| < 5 | 43 (48.9) |
| 5 - 10 | 24 (27.3) |
| > 10 | 21 (23.9) |
| Day | |
| Saturday | 27(30.7) |
| Week days | 39 (44.3) |
| Weekend | 22 (25.0) |
| Work shift | |
| Morning | 35 (39.8) |
| Afternoon | 41 (46.6) |
| Night | 12 (13.6) |
Across all hospitals that were studied, the lowest proportion for mean IC practices scores were recorded for attending on-service IC training courses and hand hygiene, that were generally less than 40% of the maximum score (Figure 1). The highest proportion of the mean scores (generally above 70%) were attained for normal vaginal deliveries scrub, and equipments and instruments hygiene practices. The mean scores for administering antibiotic prophylaxis ranged from 51% to 67%, and the mean score for safe injection practices varied between 45% and 86%. A great variation was observed for the proportion of postpartum care mean score, ranging from 23% and 91%.
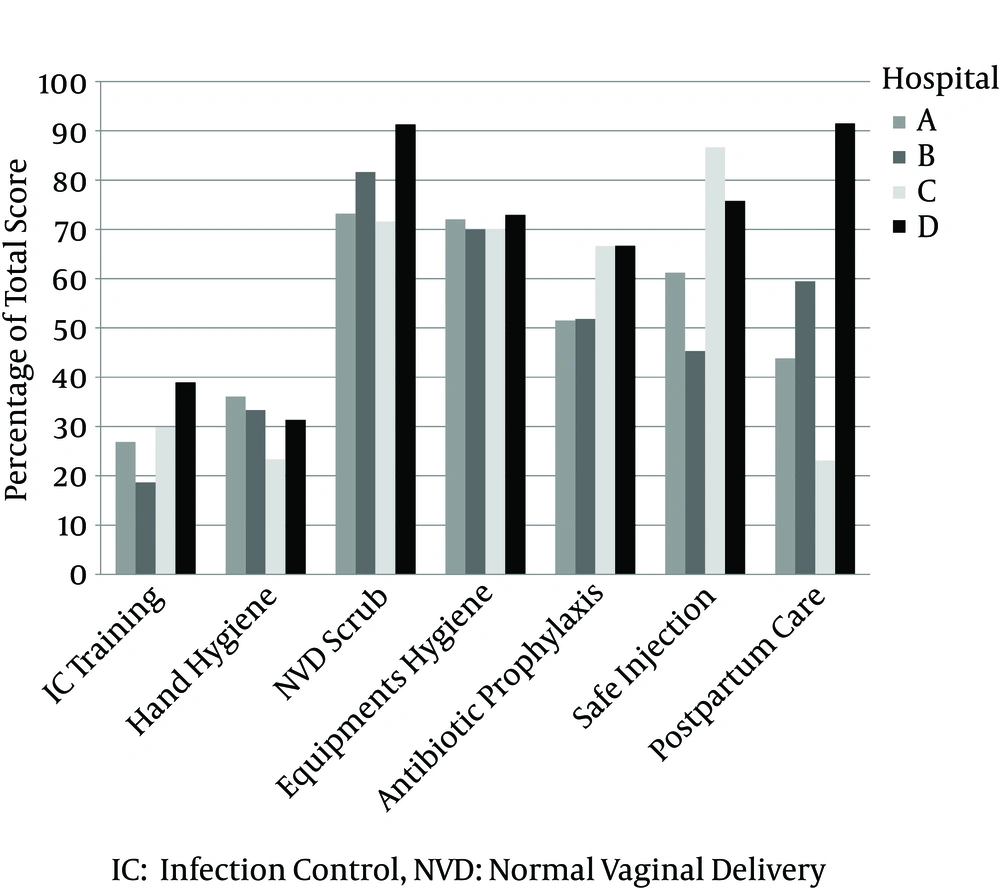
Figure 1.
Comparison of the Proportion of the Midwives Mean Scores for Different Aspects of Infection Control Practice Between Four Hospitals, Zahedan, 2014
The difference in the median total IC score between teaching and non-teaching hospitals were not statistically significant (Table 4). However, in comparison with non-teaching hospitals, the teaching hospitals had a higher median hand hygiene score (8 versus 5, P < 0.001). On the other hand, as compared with non-teaching hospitals lower median scores were recorded for antibiotic prophylaxis and safe injection practices in teaching hospitals, and the differences were statistically significant (P < 0.0001). Midwives permanently employed had a higher median total IC score, as compared with midwives with a temporary job (65 versus 61) and the difference was statistically significant (P < 0.013). The differences in the median scores between the two employment groups were statistically significant for only hand hygiene, normal vaginal delivery (NVD) scrubs and postpartum care practices. We found an overall statistically significant difference in total IC score across three working shift groups (P < 0.001). In pair wise comparisons, the median total IC score for morning and afternoon shifts were higher than night shifts (65 versus 54.5, P < 0.001). Accordingly, the statistically significant differences in working shift median scores were mostly due to differences in the median for hand hygiene, NVD scrub, and postpartum practices scores. No statistically significant difference between median scores were observed across age group, week day and work experience groups (data not shown).
Table 4.
Comparison of Midwives Infection Control Practice Score by Age Group and Work Schedule Characteristics, Zahedan, 2014
| Variables, Statistics | Hand Hygiene | NVD Scrub | Equipments Hygiene | Antibiotic Prophylaxis | Safe Injection | Postpartum Care | Total IC Score |
|---|---|---|---|---|---|---|---|
| Hospital | |||||||
| Teaching (n = 48) | |||||||
| Mean ± SD | 7.8 ± 3.1 | 24.3 ± 3.0 | 15.7 ± 1.1 | 4.6 ± 1.9 | 2.8 ± 1.1 | 6.3 ± 2.0 | 61.5 ± 6.4 |
| Median | 8 | 24.5 | 16 | 4 | 3 | 6 | 63 |
| Non-teaching (n = 40) | |||||||
| Mean ± SD | 6.0 ± 1.8 | 25.9 ± 3.5 | 15.7 ± 1.0 | 6.0 ± 0.1 | 4.1 ± 0.9 | 7.2 ± 4.8 | 64.9 ± 9.1 |
| Median | 5 | 25 | 15 | 6 | 4 | 3 | 60.5 |
| P value a | 0.001 | 0.055 | 0.752 | < 0.001 | < 0.001 | 0.709 | 0.205 |
| Employment | |||||||
| Permanent (n = 45) | |||||||
| Mean ± SD | 7.5 ± 2.6 | 25.7 ± 3.8 | 15.7 ± 1.0 | 5.2 ± 1.5 | 3.2 ± 1.2 | 7.8 ± 3.9 | 65.2 ± 8.3 |
| Median | 7 | 25 | 15 | 6 | 4 | 6 | 65 |
| Temporary (n = 43) | |||||||
| Mean ± SD | 6.3 ± 2.7 | 24.3 ± 2.7 | 15.7 ± 1.1 | 5.4 ± 1.5 | 3.5 ± 1.2 | 5.6 ± 2.7 | 60.8 ± 6.9 |
| Median | 6 | 24 | 16 | 6 | 4 | 5 | 61 |
| P value a | 0.042 | 0.044 | 0.958 | 0.377 | 0.387 | 0.006 | 0.013 |
| Work Shift | |||||||
| Morning (n = 35) | |||||||
| Mean ± SD | 6.5 ± 1.8 | 25.6 ± 3.2 | 15.7 ± 0.9 | 5.8 ± 1.0 | 3.5 ± 1.2 | 7.7 ± 4.0 | 64.8 ± 7.9 |
| Median | 6 | 25 | 16 | 6 | 4 | 9 | 65 |
| Afternoon (n = 41) | |||||||
| Mean ± SD | 7.9 ± 2.8 | 25.4 ± 3.4 | 15.8 ± 1.0 | 5.0 ± 1.8 | 3.1 ± 1.2 | 6.8 ± 3.2 | 63.9 ± 7.1 |
| Median | 8 | 25 | 16 | 5 | 3 | 6 | 65 |
| Night (n = 12) | |||||||
| Mean ± SD | 5.2 ± 3.7 | 22.0 ± 1.7 | 15.3 ± 1.4 | 4.8 ± 1.7 | 4.0 ± 1.0 | 3.9 ± 1.2 | 55.1 ± 6.1 |
| Median | 4.5 | 22 | 15 | 6 | 4 | 3 | 54.5 |
| P value b | 0.006 | 0.001 | 0.416 | 0.026 | 0.065 | 0.004 | 0.001 |
aP value for Mann-Whitney U test.
bP value for Kruskal-Wallis test.
5. Discussion
The results of this study revealed insufficient strategic approach and lack of appropriate infrastructure for preventing and managing infections in labor and maternity units in Zahedan hospitals. We also found that the IC practices among midwives were suboptimal and their behavior was not always in accordance with scientific rationale.
Infection prevention remains a significant public health challenge for healthcare systems, especially in maternity and delivery units. The shortcomings in the IC practices in this study are compatible with the gaps that have been identified in IC practices in low- and middle-income countries (13). The gaps that need to be addressed include inadequacy in hospital IC programs, inconsistent surveillance of healthcare associated infections, lack of antibiotic stewardship, inadequate written and posted IC guidelines and policies, insufficient sterilization and disinfection of equipment, and insufficient hand hygiene (13). This study highlighted the fact that midwives compliance with optimal IC practices was low. Our findings were in agreement with the results from a knowledge, attitudes, and practices survey of healthcare workers (including midwives) in Shiraz, Iran, that reported only one fifth of the participants complied with standard precaution practices and just above half of the participants held positive attitudes toward the IC practices (14). Similarly, the results from a study on IC in labor and delivery units in Gujarat state, India reported significant shortcomings in the current practices and procedures. For example, a standard IC procedure was only available in 5% of facilities. Reuse of surgical gloves for vaginal examinations in the labor room was commonly practiced in over 70% of facilities and in only 15% of facilities cleaning of surfaces was done immediately after each delivery (15). A similar study that investigated the nature and pattern of existing policies and practices relating to IC in maternity care centers in Nigeria showed that only 68% of the health facilities had documented IC procedures but IC committees were available in 13% of facilities. IC training programs for healthcare workers were in place in 33% of facilities. Only half of the facilities had 24-hour running water. Unused sterile gloves were available in only 60% of the facilities, and 11% of the facilities were found to recycle gloves (16).
From a human factors perspective, noncompliance with IC practices may occur as a result of slips, lapses, mistakes and sometimes violations of protocols, which is a function of the healthcare workers’ skills and knowledge levels (17). Some studies have shown that healthcare workers training is one of the strong predictors of compliance with IC standards (18). In this study we found that only one third of the midwives took part in IC training courses. The education of healthcare workers is essential to improve IC practices and should be an integral part of IC promotional strategies.
No significant associations between “clean” versus “sterile” delivery and higher risk for puerperal infection have been reported in the literature and the world health organization also encourages using “clean” and not necessarily “sterile” techniques for low-risk delivery (19). Therefore, in comparison with other forms of exposure such as an infected wound, the delivery for the most part of the process may be considered by midwives to be a clean service. The resulting underestimation of the occupational risk of infection is highly likely to lead to a reduction of the protective behaviors required. Therefore, other than focusing on the scientific knowledge, the IC training programs need to take into account the social construction of dirt and the response that arises from that concept.
We found that midwives had a better IC practice during the morning and afternoon work shifts. The possible reasons for a poor night shift IC performance could be the facts that night shifts were more likely to be short staffed and run by less experienced midwives, which might be coupled with lower levels of supervision. However, our findings were in contrast with a study that found working the a.m. shift was a risk factor for hand hygiene noncompliance in intensive care units (20).
Not only hospital staff noncompliance with guidelines intended to prevent healthcare associated infections but also organizational policies and decisions that encourages effective IC management can greatly contribute to the prevention of infections. Some studies have shown that healthcare workers training along with other factors such as perceptions of safe environment, perception of obstacles to comply with standard precautions and knowledge are strong predictors of compliance with IC standard (18). We found that in comparison with nonteaching hospitals, hand hygiene practices were better in teaching hospitals but antibiotic prophylaxis and safe injection performances were suboptimal. It has been shown that IC performance is generally higher in teaching than non -teaching hospitals (21). The better IC performance by non -teaching hospitals could be partly explained by availability of sufficient human resources, better IC infrastructure, full-time IC teams and more effective infection surveillance, hospital accreditation and hospital size. The conflicting results that we found could be a product of differences in the aspects related to the IC performance by hospitals that were investigated. For example, in comparison with teaching hospitals, nonteaching hospitals in Zahedan have been more recently established with better infrastructure standards. Therefore, they may have more human resources and better equipments related to IC practices. However, the reasons for these differences need further investigation.
Multifaceted IC programs that include hand-hygiene campaigns, antibiotic stewardship and other IC practices, are effective in reducing healthcare associated infections, both in developed and developing countries (22). When developing strategies to improve healthcare workers’ compliance, implementation of important aspects of IC recommended by world health organization (such as the introduction of surveillance activities, continuous practice reinforcing communications and environmental sanitation) should be considered in order to achieve a significant decrease in healthcare associated infections (23). An enabling environment that creates forums for team building, shared decision making and problem solving are necessary for changing healthcare providers’ behavior to reduce the spread of infection (24). The IC programs also need to include social marketing and staff involvement to improve IC compliance in patient care.
In summary, the results of this study suggest that substantial gaps exist in IC program, both in terms of procedures and infrastructures in all labor and maternity units that were investigated. There is a need for the development of appropriate policies, protocols and surveillance for IC, staff training and continuous quality improvement initiatives in labor and delivery units in Zahedan hospitals.