1. Background
Children's congenital heart disease (CHD) occurs 7 - 8 in thousands and is a common cause of heart failure (1). With the promotion of extracorporeal circulation, morbidity and mortality from heart failure have been reduced (2). However, postoperative hemodynamic instability, such as low cardiac output syndrome, still worsens the prognosis of CHD children (3-5). Therefore, acquiring accurate hemodynamic parameters is critical to improving the disease status and prognosis. Invasive technologies, such as the Swan-Ganz thermodilution pulmonary artery catheter, are considered a gold standard (6). However, these technologies may provide deviated data in CHD children presenting cardiac shunt. Other events, like a catheter-vessel mismatch, wound infection, and thrombosis, also limit their wide application in CHD children (7, 8). Therefore, it is essential to find non-invasive, simple, and locally available methods to monitor cardiac function in children.
In recent years, several studies have suggested that both vasoactive-inotropic score (VIS) and left ventricular ejection fraction (LVEF), reflecting cardiac function to some extent, are independently correlated with low cardiac output syndrome following cardiac surgery (2-4, 9), and are readily available at the bedside. As a maker of prognosis, VIS was mainly reported in children following cardiac surgery to treat congenital heart disease, with a high predictive value for mortality or clinical adverse events (1, 5, 9-12). For the past few decades, LVEF has been used as the primary diagnostic parameter in pediatric patients with heart failure, but its use as a prognostic marker has rarely been reported for children (6). Left ventricular ejection fraction has been shown to correlate positively with plasma catecholamine levels and could also indirectly reflect VIS (13). However, none of the available studies guided the selection of non-invasive cardiovascular function monitoring methods that could better reflect the condition and prognosis of children following surgery for congenital heart disease.
2. Objectives
Therefore, this study aimed to compare the predictive value of VIS and LVEF and provide a reference for the diagnosis, treatment, and prognosis of infants following surgery for congenital heart disease.
3. Methods
3.1. Study Population
We reviewed the medical records of a cohort of 104 consecutive infants, aged 0 to 1 year, who underwent cardiac surgery with cardiopulmonary bypass at Chongqing Medical University Affiliated Children's Hospital between January 1, 2022, and May 31, 2022. The type of congenital heart disease was defined by cardiac ultrasonography and cardiovascular reconstruction CT. The study subjects included 44 (42.31%) cases of atrial septal defect (ASD) combined with ventricular septal defect (VSD), 21 (20.19%) cases of atrial septal defect/ventricular septal defect combined with patent ductus arteriosus (PDA), eight (7.69%) cases of ventricular septal defect, seven (6.73%) cases of atrial septal defect, six (5.77%) cases of translocation of great arteries, five (4.81%) cases of tetralogy of Fallot, four (3.85%) cases of total anomalous pulmonary venous connection, three (2.88%) cases of ventricular septal defect combined with patent ductus arteriosus, two (1.92%) cases of complete atrioventricular septal defect, two (1.92%) cases of double outlet of the right ventricle, and two (1.92%) cases of pulmonary valve atresia without ventricular septal defect. They had a similar cardiac function before the surgery, and all modified Ross scores for cardiac function were above seven. The Chongqing Medical University Affiliated Children's Hospital ethics committee reviewed and approved the study.
Exclusion criteria included infants with aortic arch dysplasia, interrupted aortic arch, or simple PDA.
3.2. Statistical Standards
3.2.1. Formula
According to Gaies et al. (10), all vasoactive drugs were integrated and given the same weight, and the integrated value was used as the VIS. The VIS was calculated as follows: Dopamine dose (µg/kg.min) + Dobutamine dose (µg/kg.min) + 10 X milrinone dose (µg/kg.min) + 100 X epinephrine dose (µg/kg.min) + 100 X norepinephrine dose (µg/kg.min) + 10 000 X vasopressin dose (unit/kg.min).
3.3. Statistical Explanation
In this study, VIS was recorded each hour. Mean postoperative vasoactive-inotropic score in the first and second 24 hours and VIS (48MEA) were the mean scores of the first and second 24 hours following surgery, respectively. If the score was greater than other scores in the 24-hour period and could be maintained for ≥ 2 hours, the score was considered the maximum representative score for a 24-hour period. Similarly, VIS (24MAX) and VIS (48MAX) were the maximum representative scores of the first and second 24 hours following surgery, respectively. The highest value of lactic acid detected during the postoperative period in the intensive care unit (ICU) was noted. Duration of mechanical ventilation was defined as the period from the end of surgery to the first successful removal of the endotracheal tube from the ventilator. Duration of ICU stay was defined as the period from the end of surgery to the first successful transfer out of the ICU. The deadline for counting death was 60 days following surgery, and six infants died in this period. Postoperatively, infants with congenital heart disease often suffered from hypoxic-ischemic brain damage, cardiopulmonary resuscitation, or needed hemopurification due to further deterioration of cardiovascular function. Therefore, the above three conditions were considered severe outcomes or clinical adverse events. Under stable circulation, specialist cardiac ultrasonography was routinely performed within 24 hours following surgery, at which LVEF was measured with M-mode.
3.4. Statistical Analysis
Statistical Package for the Social Sciences (SPSS) version 22.0 statistical software was used for the statistical analysis. The chi-square test was used to analyze qualitative data, the t-test was used to analyze quantitative data, the receiver operator curve (ROC) analysis was used to evaluate the tests, and a regression equation was used for regression analysis. Statistical significance was considered at P ≤ 0.05
4. Results
4.1. General Data
Demographic data, clinical data, VIS, and prognostic data are detailed in Table 1.
Table 1.
Demographic and Clinical Data of 104 Infants
| Clinical Characteristics | Values a |
|---|---|
| Age | |
| 0 - 3 months | 24 (23.08) |
| 3 months - 1 year | 80 (76.92) |
| Sex | |
| Male | 55 (52.88) |
| Female | 49 (47.12) |
| Weight (kg) | 5.72 ± 3.12 |
| Cardiopulmonary bypass time (min) | 68 ± 19.63 |
| Aortic cross-clamp time (min) | 44 ± 10.54 |
| VIS b | |
| VIS (24MAX) (value) | 15.75 ± 15.21 |
| VIS (24MEA) (value) | 13.52 ± 11.76 |
| VIS (48MAX) (value) | 13.48 ± 19.46 |
| VIS (48MEA) (value) | 11.52 ± 19.29 |
| LVEF (97 cases) | 63.05 ± 15.19 |
| Death | 6 (5.77) |
| Adverse events | |
| Cardiopulmonary resuscitation | 7 (6.73) |
| Hemopurification | 4 (3.85) |
| Hypoxic-ischemic brain damage | 5 (4.81) |
| Else | |
| Lactic acid value (mmol/L) | 2.06 ± 3.96 |
| Duration of ventilation (h) | 56.21 ± 171.36 |
| Duration of ICU stay (d) | 4.32 ± 9.90 |
Abbreviations: VIS, vasoactive-inotropic score; LVEF, left ventricular ejection fraction; ICU, intensive care unit.
a Values are expressed as No. (%) or arithmetic means ± 1.96 × standard deviation.
b VIS (24MAX) was the maximum representative score of the first 24 hours following surgery. VIS (48MAX) was the maximum representative score of the second 24 hours following surgery; VIS (24MEA) was the mean score of the first 24 hours following surgery; VIS (48MEA) was the mean score of the second 24 hours following surgery.
All infants were treated with corresponding radical surgery with cardiopulmonary bypass. For VIS (48MAX), the highest VIS was 95. Seven (6.73%) infants received delayed sternal closure and did not undergo any cardiac ultrasonography within 24 hours after surgery, and the mean LVEF of the remaining 97 (93.27%) infants was 63.05 ± 15.19%, ranging from 41% to 80%. Among 104 infants, six (5.77%) died, five (4.81%) suffered from hypoxic-ischemic brain damage, seven (6.73%) received cardiopulmonary resuscitation, and four (3.85%) received hemopurification. The mean lactic acid value was 2.06 ± 3.96 mmol/L, ranging from 0.60 mmol/L to 13.70 mmol/L. The mean postoperative ICU stay was 4.32 ± 9.90 days, ranging from one day to 35 days. Similarly, the mean postoperative mechanical ventilation time was 56.21 ± 171.36 hours, ranging from four to 528 hours.
4.2. Vasoactive-Inotropic Score, Left Ventricular Ejection Fraction, and Outcomes
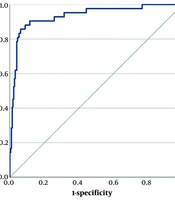
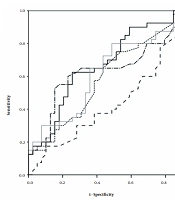
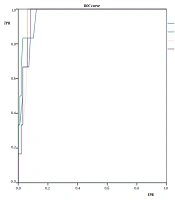
The ROC analyses of VIS (24MAX), VIS (24MEA), VIS (48MAX), VIS (48MEA), and prognosis (death and adverse events) of 104 infants were compared, and the details are shown in Figures 1 and 2, and Tables 2 and 3.
![ROC of VIS on death. The area under the ROC (AUROC) values of VIS (24MAX), VIS (24MEA), VIS (48MAX), and VIS (48MEA) were > 0.90 for death (P < 0.05), indicating that all four VIS analyses had high accuracy for predicting the death in infants following surgery for congenital heart disease [ROC, receiver operator curve; VIS, vasoactive-inotropic score; TPR, true positive rate or sensitivity; FPR, false positive rate; VIS (24MAX) was the maximum representative score of the first 24 hours following surgery. VIS (48MAX) was the maximum representative score of the second 24 hours following surgery; VIS (24MEA) was the mean score of the first 24 hours following surgery; VIS (48MEA) was the mean score of the second 24 hours following surgery].](https://brieflands.com/journals/ijp/articles/131666/figures/ijp-131666-i001-F1-preview.webp "ROC of VIS on death. The area under the ROC (AUROC) values of VIS (24MAX), VIS (24MEA), VIS (48MAX), and VIS (48MEA) were > 0.90 for death (P < 0.05), indicating that all four VIS analyses had high accuracy for predicting the death in infants following surgery for congenital heart disease [ROC, receiver operator curve; VIS, vasoactive-inotropic score; TPR, true positive rate or sensitivity; FPR, false positive rate; VIS (24MAX) was the maximum representative score of the first 24 hours following surgery. VIS (48MAX) was the maximum representative score of the second 24 hours following surgery; VIS (24MEA) was the mean score of the first 24 hours following surgery; VIS (48MEA) was the mean score of the second 24 hours following surgery].")
Figure 1.
ROC of VIS on death. The area under the ROC (AUROC) values of VIS (24MAX), VIS (24MEA), VIS (48MAX), and VIS (48MEA) were > 0.90 for death (P < 0.05), indicating that all four VIS analyses had high accuracy for predicting the death in infants following surgery for congenital heart disease [ROC, receiver operator curve; VIS, vasoactive-inotropic score; TPR, true positive rate or sensitivity; FPR, false positive rate; VIS (24MAX) was the maximum representative score of the first 24 hours following surgery. VIS (48MAX) was the maximum representative score of the second 24 hours following surgery; VIS (24MEA) was the mean score of the first 24 hours following surgery; VIS (48MEA) was the mean score of the second 24 hours following surgery].
![ROC of VIS on adverse events. The area under the ROC (AUROC) values of VIS (24MAX), VIS (24MEA), VIS (48MEA), and VIS (48MEA) were > 0.90 for adverse events (P < 0.05), indicating that all four VIS analyses had high accuracy in predicting adverse events in infants following surgery for congenital heart disease [ROC, receiver operator curve; VIS, vasoactive-inotropic score; TPR, true positive rate or sensitivity; FPR, false positive rate; VIS (24MAX) was the maximum representative score of the first 24 hours following surgery. VIS (48MAX) was the maximum representative score of the second 24 hours following surgery; VIS (24MEA) was the mean score of the first 24 hours following surgery; VIS (48MEA) was the mean score of the second 24 hours following surgery].](https://brieflands.com/journals/ijp/articles/131666/figures/ijp-131666-i002-F2-preview.webp "ROC of VIS on adverse events. The area under the ROC (AUROC) values of VIS (24MAX), VIS (24MEA), VIS (48MEA), and VIS (48MEA) were > 0.90 for adverse events (P < 0.05), indicating that all four VIS analyses had high accuracy in predicting adverse events in infants following surgery for congenital heart disease [ROC, receiver operator curve; VIS, vasoactive-inotropic score; TPR, true positive rate or sensitivity; FPR, false positive rate; VIS (24MAX) was the maximum representative score of the first 24 hours following surgery. VIS (48MAX) was the maximum representative score of the second 24 hours following surgery; VIS (24MEA) was the mean score of the first 24 hours following surgery; VIS (48MEA) was the mean score of the second 24 hours following surgery].")
Figure 2.
ROC of VIS on adverse events. The area under the ROC (AUROC) values of VIS (24MAX), VIS (24MEA), VIS (48MEA), and VIS (48MEA) were > 0.90 for adverse events (P < 0.05), indicating that all four VIS analyses had high accuracy in predicting adverse events in infants following surgery for congenital heart disease [ROC, receiver operator curve; VIS, vasoactive-inotropic score; TPR, true positive rate or sensitivity; FPR, false positive rate; VIS (24MAX) was the maximum representative score of the first 24 hours following surgery. VIS (48MAX) was the maximum representative score of the second 24 hours following surgery; VIS (24MEA) was the mean score of the first 24 hours following surgery; VIS (48MEA) was the mean score of the second 24 hours following surgery].
Table 2.
AUROC and the Optimal Critical Value of VIS for Death
| VIS a | AUROC | SE | P Value | 95% Cl | J Point | SEN (%) | SPE (%) | |
|---|---|---|---|---|---|---|---|---|
| Lower Limit | Upper Limit | |||||||
| VIS (24MAX) | 0.960 | 0.022 | 0.00 | 0.92 | 1.00 | 20.75 | 100 | 87.80 |
| VIS (24MEA) | 0.980 | 0.013 | 0.00 | 0.96 | 1.00 | 19.42 | 100 | 93.90 |
| VIS (48MAX) | 0.961 | 0.019 | 0.00 | 0.92 | 1.00 | 22.00 | 100 | 93.90 |
| VIS (48MEA) | 0.963 | 0.019 | 0.00 | 0.93 | 1.00 | 18.13 | 100 | 91.80 |
Abbrivations: AUROC, area under the receiver operator curve; VIS, vasoactive-inotropic score; SE, standard error; 95% Cl, 95% confidence interval; J point, Youden index; SEN, sensitivity; SPE, specificity.
a VIS (24MAX) was the maximum representative score of the first 24 hours following surgery. VIS (48MAX) was the maximum representative score of the second 24 hours following surgery; VIS (24MEA) was the mean score of the first 24 hours following surgery; VIS (48MEA) was the mean score of the second 24 hours following surgery.
Table 3.
AUROC and the Optimal Critical Value of VIS for Adverse Events
| VIS a | AUROC | SE | P Value | 95% Cl | J Point | SEN (%) | SPE (%) | |
|---|---|---|---|---|---|---|---|---|
| Lower Limit | Upper Limit | |||||||
| VIS (24MAX) | 0.942 | 0.027 | 0.00 | 0.89 | 1.00 | 19.50 | 91.70 | 88 |
| VIS (24MEA) | 0.945 | 0.025 | 0.00 | 0.90 | 0.99 | 18.02 | 91.70 | 89.10 |
| VIS (48MAX) | 0.954 | 0.026 | 0.00 | 0.90 | 1.00 | 17.75 | 91.70 | 90.20 |
| VIS (48MEA) | 0.953 | 0.022 | 0.00 | 0.91 | 1.00 | 12.90 | 100 | 80.40 |
Abbreviations: AUROC, area under the receiver operator curve; VIS, vasoactive-inotropic score; SE, standard error; 95% Cl, 95% confidence interval; J point, Youden index; SEN, sensitivity; SPE, specificity.
aVIS (24MAX) was the maximum representative score of the first 24 hours following surgery. VIS (48MAX) was the maximum representative score of the second 24 hours following surgery; VIS (24MEA) was the mean score of the first 24 hours following surgery; VIS (48MEA) was the mean score of the second 24 hours following surgery.
The area under the ROC (AUROC) values of VIS (24MAX), VIS (24MEA), VIS (48MAX), and VIS (48MEA) were > 0.90 for both outcomes (death and adverse events), indicating that all four VIS analyses had high accuracy for predicting these outcomes in infants following surgery. Figures 3 and 4, and Tables 4 and 5 show that the accuracy of VIS (24MAX), VIS (24MEA), VIS (48MAX), and VIS (48MEA) was significantly higher than the accuracy of LVEF (P < 0.05) for predicting the two outcomes (death and adverse events) in 97 infants with routine thoracic closure.
![Comparison of ROC between VIS and LVEF on death. The accuracy of VIS (24MAX), VIS (24MEA), VIS (48MAX), and VIS (48MEA) was significantly higher than the accuracy of LVEF for predicting the death of 97 infants with routine thoracic closure (P < 0.05). The AUROC values of all four VIS analyses were > 0.90 (P < 0.05), while the AUROC value of LVEF for death was 0.65 (P > 0.05), suggesting no statistical significance in predicting the death [ROC, receiver operator curve; VIS, vasoactive-inotropic score; TPR (VIS), true positive rate for VIS; FPR (VIS), false positive rate for VIS; EF, ejection fraction, it was also left ventricular ejection fraction (LVEF) in the present study; TPR (EF), true positive rate for EF; FPR(EF), false positive rate for EF. VIS (24MAX) was the maximum representative score of the first 24 hours following surgery. VIS (48MAX) was the maximum representative score of the second 24 hours following surgery; VIS (24MEA) was the mean score of the first 24 hours following surgery; VIS (48MEA) was the mean score of the second 24 hours following surgery].](https://brieflands.com/journals/ijp/articles/131666/figures/ijp-131666-i003-F3-preview.webp "Comparison of ROC between VIS and LVEF on death. The accuracy of VIS (24MAX), VIS (24MEA), VIS (48MAX), and VIS (48MEA) was significantly higher than the accuracy of LVEF for predicting the death of 97 infants with routine thoracic closure (P < 0.05). The AUROC values of all four VIS analyses were > 0.90 (P < 0.05), while the AUROC value of LVEF for death was 0.65 (P > 0.05), suggesting no statistical significance in predicting the death [ROC, receiver operator curve; VIS, vasoactive-inotropic score; TPR (VIS), true positive rate for VIS; FPR (VIS), false positive rate for VIS; EF, ejection fraction, it was also left ventricular ejection fraction (LVEF) in the present study; TPR (EF), true positive rate for EF; FPR(EF), false positive rate for EF. VIS (24MAX) was the maximum representative score of the first 24 hours following surgery. VIS (48MAX) was the maximum representative score of the second 24 hours following surgery; VIS (24MEA) was the mean score of the first 24 hours following surgery; VIS (48MEA) was the mean score of the second 24 hours following surgery].")
Figure 3.
Comparison of ROC between VIS and LVEF on death. The accuracy of VIS (24MAX), VIS (24MEA), VIS (48MAX), and VIS (48MEA) was significantly higher than the accuracy of LVEF for predicting the death of 97 infants with routine thoracic closure (P < 0.05). The AUROC values of all four VIS analyses were > 0.90 (P < 0.05), while the AUROC value of LVEF for death was 0.65 (P > 0.05), suggesting no statistical significance in predicting the death [ROC, receiver operator curve; VIS, vasoactive-inotropic score; TPR (VIS), true positive rate for VIS; FPR (VIS), false positive rate for VIS; EF, ejection fraction, it was also left ventricular ejection fraction (LVEF) in the present study; TPR (EF), true positive rate for EF; FPR(EF), false positive rate for EF. VIS (24MAX) was the maximum representative score of the first 24 hours following surgery. VIS (48MAX) was the maximum representative score of the second 24 hours following surgery; VIS (24MEA) was the mean score of the first 24 hours following surgery; VIS (48MEA) was the mean score of the second 24 hours following surgery].
![Comparison of ROC between VIS and LVEF on adverse events. The accuracy of VIS (24MAX), VIS (24MEA), VIS (48MAX), and VIS (48MEA) was significantly higher than the accuracy of LVEF for predicting adverse events in 97 infants with routine thoracic closure (P < 0.05). The AUROC values of all four VIS analyses were > 0.90 (P < 0.05), while the AUROC value of LVEF for adverse events was 0.53 (P > 0.05), suggesting no statistical significance in predicting adverse events [ROC, receiver operator curve; VIS, vasoactive-inotropic score; TPR (VIS), true positive rate for VIS; FPR (VIS), false positive rate for VIS; EF, ejection fraction, it was also left ventricular ejection fraction (LVEF) in the present study; TPR (EF), true positive rate for EF; FPR (EF), false positive rate for EF. VIS (24MAX) was the maximum representative score of the first 24 hours following surgery. VIS (48MAX) was the maximum representative score of the second 24 hours following surgery; VIS (24MEA) was the mean score of the first 24 hours; VIS (48MEA) was the mean score of the second 24 hours following surgery].](https://brieflands.com/journals/ijp/articles/131666/figures/ijp-131666-i004-F4-preview.webp "Comparison of ROC between VIS and LVEF on adverse events. The accuracy of VIS (24MAX), VIS (24MEA), VIS (48MAX), and VIS (48MEA) was significantly higher than the accuracy of LVEF for predicting adverse events in 97 infants with routine thoracic closure (P < 0.05). The AUROC values of all four VIS analyses were > 0.90 (P < 0.05), while the AUROC value of LVEF for adverse events was 0.53 (P > 0.05), suggesting no statistical significance in predicting adverse events [ROC, receiver operator curve; VIS, vasoactive-inotropic score; TPR (VIS), true positive rate for VIS; FPR (VIS), false positive rate for VIS; EF, ejection fraction, it was also left ventricular ejection fraction (LVEF) in the present study; TPR (EF), true positive rate for EF; FPR (EF), false positive rate for EF. VIS (24MAX) was the maximum representative score of the first 24 hours following surgery. VIS (48MAX) was the maximum representative score of the second 24 hours following surgery; VIS (24MEA) was the mean score of the first 24 hours; VIS (48MEA) was the mean score of the second 24 hours following surgery].")
Figure 4.
Comparison of ROC between VIS and LVEF on adverse events. The accuracy of VIS (24MAX), VIS (24MEA), VIS (48MAX), and VIS (48MEA) was significantly higher than the accuracy of LVEF for predicting adverse events in 97 infants with routine thoracic closure (P < 0.05). The AUROC values of all four VIS analyses were > 0.90 (P < 0.05), while the AUROC value of LVEF for adverse events was 0.53 (P > 0.05), suggesting no statistical significance in predicting adverse events [ROC, receiver operator curve; VIS, vasoactive-inotropic score; TPR (VIS), true positive rate for VIS; FPR (VIS), false positive rate for VIS; EF, ejection fraction, it was also left ventricular ejection fraction (LVEF) in the present study; TPR (EF), true positive rate for EF; FPR (EF), false positive rate for EF. VIS (24MAX) was the maximum representative score of the first 24 hours following surgery. VIS (48MAX) was the maximum representative score of the second 24 hours following surgery; VIS (24MEA) was the mean score of the first 24 hours; VIS (48MEA) was the mean score of the second 24 hours following surgery].
Table 4.
Comparison of ROC of Death Between VIS and LVEF
| VIS a and LVEF | AUROC | SE | P Value | 95% Cl | |
|---|---|---|---|---|---|
| Lower Limit | Lower Limit | ||||
| VIS (24MAX) | 0.949 | 0.024 | 0.00 | 0.90 | 1.00 |
| VIS (24MEA) | 0.980 | 0.014 | 0.00 | 0.95 | 1.00 |
| VIS (48MAX) | 0.972 | 0.017 | 0.00 | 0.94 | 1.00 |
| VIS (48MEA) | 0.970 | 0.018 | 0.00 | 0.94 | 1.00 |
| LVEF | 0.65 | 0.16 | 0.33 | 0.33 | 0.96 |
Abbreviations: ROC, receiver operator curve; AUROC, area under the receiver operator curve; VIS, vasoactive-inotropic score; LVEF, left ventricular ejection fraction; SE, standard error; 95% Cl, 95% confidence interval.
aVIS (24MAX) was the maximum representative score of the first 24 hours following surgery. VIS (48MAX) was the maximum representative score of the second 24 hours following surgery; VIS (24MEA) was the mean score of the first 24 hours following surgery; VIS (48MEA) was the mean score of the second 24 hours following surgery.
Table 5.
Comparison of ROC of Adverse Events Between VIS and LVEF
| VIS a and LVEF | AUROC | SE | P Value | 95% Cl | |
|---|---|---|---|---|---|
| Lower Limit | Lower Limit | ||||
| VIS (24MAX) | 0.956 | 0.029 | 0.00 | 0.90 | 1.00 |
| VIS (24MEA) | 0.968 | 0.024 | 0.00 | 0.92 | 1.00 |
| VIS (48MAX) | 0.960 | 0.029 | 0.00 | 0.90 | 1.00 |
| VIS (48MEA) | 0.967 | 0.020 | 0.00 | 0.93 | 1.00 |
| LVEF | 0.53 | 0.12 | 0.81 | 0.29 | 0.76 |
Abbreviations: ROC, receiver operator curve; AUROC, area under the receiver operator curve; VIS, vasoactive-inotropic score; LVEF, left ventricular ejection fraction; SE, Standard error; 95% Cl, 95% confidence interval.
a VIS (24MAX) was the maximum representative score of the first 24 hours following surgery. VIS (48MAX) was the maximum representative score of the second 24 hours following surgery; VIS (24MEA) was the mean score of the first 24 hours following surgery; VIS (48MEA) was the mean score of the second 24 hours following surgery.
In addition, the AUROC values of VIS were > 0.90, while the AUROC values of LVEF for the two outcomes were 0.65 and 0.53, respectively (P > 0.05), suggesting no statistical significance in predicting the two outcomes.
In the present study, the VIS (24MEA) J point (Youden index of 19.42 gave sensitivity = 100% and specificity = 93.90%, and Youden index of 18.02 gave sensitivity = 91.70% and specificity = 89.10%) and VIS (48MAX) J point (Youden index of 22 gave sensitivity = 100% and specificity = 93.90% and Youden index of 17.75 gave sensitivity = 91.70% and specificity = 90.20%) had high sensitivity and specificity for predicting death and severe illness and were therefore considered critical values (as shown in Tables 2 and 3). Based on these critical values, subjects were divided into two groups, respectively: those below and those above these critical values. Mortality, the incidence of adverse events, mean lactic acid level, mean ICU stay duration, and mean mechanical ventilation duration were compared between the two groups (Table 6).
Table 6.
| Critical Value and Comparison Item | Group Below the Critical | Group Above the Critical | χ2 or t-Value | P or Pi Value |
|---|---|---|---|---|
| VIS (24MEA): 19.42 | ||||
| Mortality | 0/92 (0) | 6/12 (50%) | - | Pi = 0.00 |
| Rate of adverse events | 4/92 (4.35%) | 8/12 (66.67%) | 34.52 | P = 0.00 |
| Lactic acid level (mmol/L) | 1.68 ± 2.61 | 5 ± 7.02 | -3.19 | P = 0.01 |
| Duration of ICU stay (d) | 3.43 ± 5.98 | 11.08 ± 20.11 | -2.57 | P = 0.03 |
| Duration of mechanical ventilation (h) | 38.11 ± 86.18 | 195 ± 349.66 | -3.03 | P = 0.01 |
| VIS (24MEA): 18.02 | ||||
| Mortality | 0/83 (0) | 6/21 (28.60) | 20.19 | P = 0.00 |
| Rate of adverse events | 1/83 (1.20) | 11/21 (52.40) | 38.14 | P = 0.00 |
| Lactic acid level (mmol/L) | 1.50 ± 1.90 | 4.27 ± 6.41 | -3.84 | P = 0.00 |
| Duration of ICU stay (d) | 2.93 ± 4.72 | 9.81 ± 16.15 | -3.79 | P = 0.00 |
| Duration of mechanical ventilation (h) | 30.30 ± 63.09 | 158.62 ± 286.18 | -4.00 | P = 0.00 |
| VIS (48MAX): 22 | ||||
| Mortality | 0/92 (0) | 6/12 (50%) | - | Pi = 0.00 |
| Rate of adverse events | 3/92 (3.30%) | 9/12 (75%) | 46.73 | P = 0.00 |
| Lactic acid level (mmol/L) | 1.72 ± 2.90 | 4.66 ± 6.72 | -2.93 | P = 0.01 |
| Duration of ICU stay (d) | 3.40 ± 5.86 | 11.33 ± 19.99 | -2.68 | P = 0.02 |
| Duration of mechanical ventilation (h) | 37.77 ± 85.26 | 197.58 ± 346.61 | -3.12 | P = 0.01 |
| VIS (48MAX): 17.75 | ||||
| Mortality | 0/84 (0) | 6/20 (30) | 21.51 | P = 0.00 |
| Rate of adverse events | 1/84 (1.19) | 11/20 (55) | 40.70 | P = 0.00 |
| Lactic acid level (mmol/L) | 1.42 ± 1.14 | 4.73 ± 6.61 | -4.37 | P = 0.00 |
| Duration of ICU stay (d) | 3 ± 5.25 | 9.85 ± 16.03 | -3.70 | P = 0.00 |
| Duration of mechanical ventilation (h) | 29.87 ± 59.33 | 166.85 ± 287.26 | -4.16 | P = 0.00 |
| LVEF (except delayed sternal closure): 50% | ||||
| Mortality | 0/4 (0) | 4/93 (4.30) | - | Pi = 0.84 |
| Rate of adverse events | 1/4 (25) | 8/93 (8.60) | - | Pi = 0.33 |
| Lactic acid level (mmol/L) | 3.10 ± 7.06 | 1.69 ± 2.84 | -0.78 | P = 0.49 |
| Duration of ICU stay (d) | 4.75±7.04 | 3.74 ± 7.78 | -0.50 | P = 0.62 |
| Duration of mechanical ventilation (h) | 63.50 ± 116.29 | 45.60 ± 140.18 | -0.49 | P = 0.62 |
Abbreviations: VIS, vasoactive-inotropic score; LVEF, left ventricular ejection fraction; ICU, intensive care unit; χ2, chi-square test.
aValues are expressed as No. (%) or arithmetic means ± 1.96 × standard deviation.
b VIS (48MAX) was the maximum representative score of the second 24 hours following surgery; VIS (24MEA) was the mean score of the first 24 hours following surgery.
Compared with the group below the critical value, infants in the group above the critical value had significantly higher mortality, adverse events incidence, and mean lactic acid level (P < 0.05) and significantly longer mean durations of ICU stay and mechanical ventilation (P < 0.05). Moreover, the higher the VIS following surgery, the higher the mortality, incidence of adverse events, and lactic acid level (P < 0.05) and the longer the duration of ICU stay and mechanical ventilation (P < 0.05). Regression analysis was used to calculate the correlation between VIS and prognostic indicators (Tables 7 and 8). Using the same correlation regression method, the LVEF within 24 hours following surgery revealed no significant effect on the prognosis of infants (P > 0.05) (Tables 7 and 8). When considering LVEF, 97 infants were divided into two groups: ≥ 50% group and < 50% group. Statistical analysis revealed no significant difference between the two groups in terms of mortality, incidence of adverse events, mean lactic acid level, mean duration of ICU stay, and mean duration of mechanical ventilation (P > 0.05).
Table 7.
Linear Regression Between VIS and LVEF on Prognosis a
| Independent Variable - Dependent Variable | b | r | F | PF | T | PT |
|---|---|---|---|---|---|---|
| VIS (24MEA) - duration of ICU stay | 0.38 | 0.46 | 26.86 | 0.00 | 5.18 | 0.00 |
| VIS (24MEA) - duration of mechanical ventilation | 7.04 | 0.48 | 31.00 | 0.00 | 5.57 | 0.00 |
| VIS (24MEA) - lactic acid level | 0.18 | 0.54 | 42.87 | 0.00 | 6.55 | 0.00 |
| VIS (48MAX- duration of ICU stay | 0.13 | 0.26 | 7.49 | 0.01 | 2.74 | 0.01 |
| VIS (48MAX) - duration of mechanical ventilation | 2.72 | 0.31 | 10.72 | 0.00 | 3.27 | 0.00 |
| VIS (48MAX) - lactic acid level | 0.10 | 0.47 | 28.14 | 0.00 | 5.31 | 0.00 |
| LVEF - duration of ICU stay | -0.01 | -0.02 | 0.04 | 0.84 | -0.2 | 0.84 |
| LVEF - duration of mechanical ventilation | -0.55 | -0.06 | 0.35 | 0.55 | -0.59 | 0.55 |
| LVEF - lactic acid level | -0.01 | -0.04 | 0.13 | 0.72 | -0.36 | 0.72 |
Abbreviations: VIS, vasoactive-inotropic score; LVEF, left ventricular ejection fraction; ICU, intensive care unit; b, regression coefficient; r, correlation coefficient.
a VIS (48MAX) was the maximum representative score of the second 24 hours following surgery; VIS (24MEA) was the mean score of the first 24 hours following surgery.
Table 8.
Logistic Regression Between VIS and LVEF on Prognosis a
| Independent Variable-Dependent Variable | b | SE (b) | Wald X2 | P | OR |
|---|---|---|---|---|---|
| VIS (24MEA)-death | 0.75 | 0.27 | 7.54 | 0.01 | 2.11 |
| VIS (24MEA)-adverse events | 0.50 | 0.13 | 14.43 | 0.00 | 1.65 |
| VIS (48MAX)-death | 0.40 | 0.14 | 8.16 | 0.00 | 1.50 |
| VIS (48MAX)-adverse events | 0.44 | 0.11 | 16.13 | 0.00 | 1.56 |
| LVEF - death | -0.06 | 0.06 | 0.85 | 0.36 | 0.94 |
| LVEF - adverse events | -0.02 | 0.05 | 0.19 | 0.66 | 0.98 |
Abbreviations: VIS, vasoactive-inotropic score; LVEF, left ventricular ejection fraction; b, regression coefficient; SE, standard error; OR, odds ratio; Wald X2 = [b/SE(b)]2.
a VIS (48MAX) was the maximum representative score of the second 24 hours following surgery; VIS (24MEA) was the mean score of the first 24 hours following surgery.
5. Discussion
Congenital heart disease is commonly observed in infants and young children. Disrupted hemodynamics may occur during the perioperative period of extracorporeal circulation, which further worsens the status and prognosis of patients (3, 4). Therefore, vasoactive drugs are often required to maintain cardiac function after corrective surgery to treat congenital heart disease, and the dosage could reflect the severity of cardiac damage and the prognosis of children (13). Plasma catecholamine levels were positively correlated with cardiac function within a range (13). The VIS could comprehensively reflect doses of various vasoactive drugs (10). Additionally, multiple studies have concluded that a higher VIS correlated with a more severe condition in infants, including multiple organ damage, cardiopulmonary resuscitation, and hemopurification, while a worse prognosis was associated with higher mortality (1, 5, 9, 12, 14-19). The present study supported this view. We found that all vasoactive-inotropic scores observed within 48 hours following surgery had an excellent predictive value of death and adverse events (AUROC > 0.90, and P < 0.05). At the same time, the J point critical value of the VIS revealed high sensitivity and specificity between 17.75 and 22. However, slight differences in the ability to predict clinical adverse events have been reported among the four vasoactive-inotropic scores [VIS (24MAX), VIS (24MEA), VIS (48MAX), and VIS (48MEA)], but which among these four is a better prognostic marker is uncertain. In the present study, VIS (24MEA) and VIS (48MAX) were slightly better than the other two scores. However, Davidson et al. considered VIS (48MEA) more reliable for predicting the prognosis of 70 infants under three months (12). This difference might be related to the sample size, the selection of research subjects, and the statistical point of time.
In the present study, a positive correlation was observed between the VIS and the occurrence of clinical adverse events (Tables 7 and 8).
It has been proposed that a higher VIS results in higher mortality, higher incidence of clinical adverse events, higher lactic acid value, and longer mechanical ventilation and ICU stay. Contrarily, a decrease in VIS or a reduction in the dose of a vasoactive drug can predict improvement in an infant's condition and prognosis. Gaies et al. also reached the same conclusion (10, 11). Although vasoactive agents can improve heart function and prognosis, most of these agents increase either myocardial oxygen consumption or peripheral vascular resistance. Thus, large doses of vasoactive agents could damage the myocardium by increasing myocardial oxygen consumption or the cardiac afterload, leading to poor prognose (20-22). Moreover, it has been documented that the use of vasoactive agents in high doses to maintain cardiovascular function resulted in increased complications and mortality and more harm than good (23). The data indicate that high VIS not only reflects severe disease and poor infant prognosis but may also have an opposite effect that aggravates the condition. Therefore, it is necessary to adjust the treatment plan according to VIS and the state of cardiac function to improve the condition and prognosis of infants.
Left ventricular ejection fraction has been used as the primary diagnostic index in patients with heart failure (6). It has also been considered in the guidelines for the treatment and follow-up of heart failure patients (24, 25). However, in terms of its influence on disease prognosis, most studies have been performed on adult patients, while only a few studies have involved children, which still remains controversial (26). The present study demonstrated that low LVEF within 24 hours following surgery was not associated with a poor prognosis. Thus, we could not predict that infants with lower postoperative LVEF would have higher mortality, higher incidence of clinical adverse events, higher lactic acid value, and longer mechanical ventilation and ICU stay. Although plasma catecholamine levels within a range could reflect a change in LVEF (13), the present study compared the effects of VIS and LVEF on the prognosis of children and found VIS to be a better predictor of postoperative mortality and poor outcomes. The reasons for these differences may be as follow. First, the VIS represents the total cardiac function, while LVEF measured with M-mode represents only the left ventricular systolic function between two points and cannot judge the right cardiac function and the whole left ventricular systolic or diastolic function, so the predictive ability is poor. Second, vasoactive agents are often required to maintain stable cardiovascular function after extracorporeal circulation for congenital heart disease. Therefore, monitoring LVEF within 24 hours following surgery can be conducted only under the maintenance of vasoactive agents, which cannot represent the LVEF in the absence of vasoactive agents. Third, this is a retrospective study, and postoperative monitoring of LVEF was performed at a certain point of time within 24 hours. Thus, it may be more meaningful to continuously monitor changes in LVEF to inform prognosis. Fourth, to some children, even after surgery for congenital heart disease, blood flow to the left ventricle is partly shunted to the right ventricle or reverse flow situation, and thus LVEF cannot completely represent blood flow from the heart into the aorta and cannot completely correspond to the pumping action of the heart. Though LVEF continues to be used as the primary diagnostic index of heart failure, its role needs to be studied further for the diagnosis and prognosis of heart failure in children with congenital heart disease.
To conclude, early VIS following surgery for congenital heart disease in infants had an excellent predictive value of disease severity and prognosis. Higher VIS correlated with more severe disease, worse prognosis, and higher mortality. However, the predictive value of LVEF within 24 hours following surgery was lower. Since this is a retrospective, single-center study with small sample size, multicentric randomized controlled studies involving a larger study population is necessary.
5.1. Conclusions
Vasoactive-inotropic Score at an early stage following surgery was significantly associated with the condition and prognosis of infants with congenital heart disease; however, the predictive value of LVEF within 24 hours following surgery was lower