
1. Background
Epidermolysis bullosa (EB) is a rare, genetically heterogeneous group of skin diseases characterized by epithelial and mucosal fragility, leading to recurrent blisters and erosions even after minimal trauma. Although its incidence is approximately 19.6 per million live births and its prevalence is around 11 per million individuals, EB is associated with significant morbidity and mortality (1) (Figure 1).
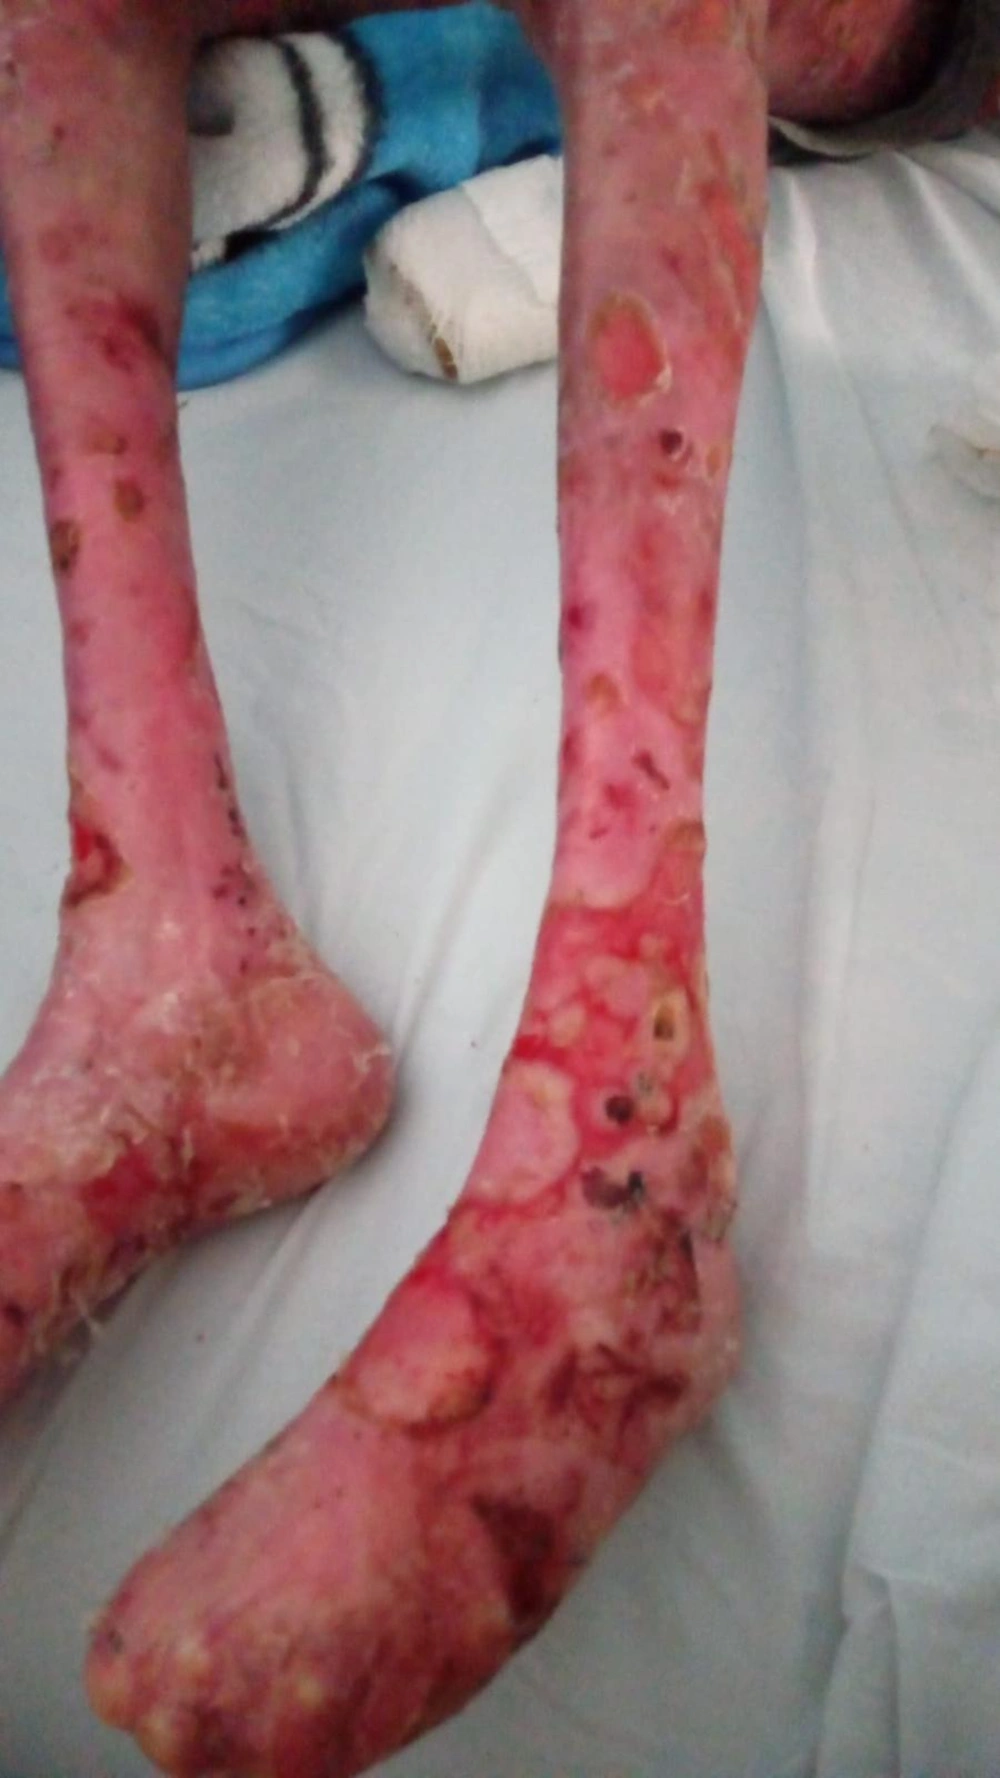
Figure 1.
Clinical presentation of epidermolysis bullosa in a pediatric patient.
EB is classified into three main subtypes based on the degree of tissue cleavage and clinical severity: Simplex, junctional, and dystrophic EB. Mutations in genes expressed within the basement membrane zone (BMZ) account for its phenotypic variability. Dystrophic EB commonly results from COL7A1 mutations, leading to defective type VII collagen, impaired dermal–epidermal adhesion, and severe blister formation (2).
Due to its hereditary nature, genetic counseling plays a critical role in identifying carrier status and assessing the risk of disease transmission. Prenatal diagnosis and preimplantation genetic testing are available reproductive options that genetic counselors should guide. Advances in molecular genetics have improved understanding of EB and supported emerging therapeutic strategies, including gene therapy (2, 3).
Reliable assessment of disease severity is essential for clinical management and evaluation of treatment outcomes. Among disease-specific scoring systems, the Epidermolysis Bullosa Disease Activity and Scarring Index (EBDASI), validated in 2014, is the most comprehensive tool, uniquely distinguishing disease activity from cumulative damage. The EBDASI evaluates five domains, including skin, mucous membranes, nails, and other epithelial surfaces, with a maximum total score of 506 (4).
Malnutrition is a significant complication in EB, with many affected children being malnourished or at risk (5, 6). Its etiology is multifactorial, including reduced oral intake due to oral and esophageal lesions, increased metabolic demands from continuous wound healing and chronic inflammation, nutrient loss from extensive wounds, and gastrointestinal problems such as reflux, malabsorption, and constipation (3, 5).
Epidermolysis bullosa-associated wounds also contribute to chronic blood loss and heightened infection risk. Common laboratory abnormalities include hypoalbuminemia, elevated C-reactive protein (CRP), and anemia, reflecting inflammation and poor nutritional status (7-9). Low hemoglobin levels are linked to chronic blood loss and iron deficiency and represent a significant management challenge (10). The STRONGkids tool is a simple and validated instrument for assessing nutritional status in pediatric patients. It evaluates clinical appearance, presence of high-risk disease, nutritional intake, and weight loss, enabling early identification and timely intervention for children at risk of malnutrition (11).
2. Methods
This cross-sectional study included 16 EB patients registered with the Home Healthcare Services Unit of the Istanbul Prof. Dr. Cemil Taşçıoğlu City Hospital. The study was conducted between January 2023 and October 2024. All patients were already receiving regular follow-up and treatment through the Home Healthcare Services Unit. During their routine home visits over a one-year period, patients were observed and assessed for this study. All EB patients aged 0 - 18 years who were actively registered and followed by the Home Healthcare Services Unit during the study period were eligible for inclusion. Patients with incomplete medical records or those whose legal guardians did not provide informed consent were excluded. All 16 eligible patients meeting the inclusion criteria were enrolled consecutively.
2.1. Study Design and Sample
This cross-sectional study included 16 EB patients registered with the Home Healthcare Services Unit of the Istanbul Prof. Dr. Cemil Taşçıoğlu City Hospital. The sample size was calculated using GPower software. Based on 80% statistical power, a 5% type I error rate, and a medium effect size (r = 0.50) for correlation analyses, the minimum required sample size was n = 15. Given that previous EB studies typically included 10 - 30 participants (4-6), the sample size of this study (n = 16) was deemed sufficient for rare disease research.
2.2. Data Collection
Patients were examined during routine home visits. Sociodemographic, genetic, and family history data were recorded. Disease severity was assessed using the EBDASI and categorized as mild, moderate, or severe (12). Nutritional risk was evaluated with STRONGkids (11). Anthropometric measurements were converted to WHO Z-scores (13, 14), with HAZ used for chronic and BMI-for-age SD for acute malnutrition. Serum albumin, hemoglobin, and CRP levels were analyzed as biochemical indicators. The EBDASI is a validated, disease-specific instrument that evaluates five anatomical domains (skin activity, skin damage, scalp and nails, mucous membrane activity, and mucous membrane damage), with a maximum total score of 506. Each domain is scored by a trained clinician based on findings from physical examinations during home visits. Severity categories were defined according to Jain et al. (12): Mild (0 - 42), moderate (43 - 106), and severe (≥ 107). The STRONGkids screening tool consists of four items—subjective clinical assessment, high-risk disease status, nutritional intake and losses, and weight loss or poor weight gain—yielding a total score of 0 - 5, with higher scores indicating greater nutritional risk (11). Body weight and height were measured using calibrated portable scales and stadiometers during home visits. Anthropometric data were entered into the WHO AnthroPlus software (version 1.0.4) to calculate BMI-for-age, height-for-age, and weight-for-age Z-scores. Laboratory samples were obtained from venous blood drawn during the same visit and analyzed at the hospital’s central laboratory. Serum albumin was measured by the bromocresol green method, hemoglobin by automated complete blood count analysis, and CRP by immunoturbidimetric assay.
2.3. Ethical Approval
Ethical approval was obtained from the Istanbul Prof. Dr. Cemil Taşcıoğlu City Hospital Clinical Research Ethics Committee (Decision No: 261, Date: November 6, 2023). Written informed consent was collected from all participants and their parents/legal guardians. Written informed consent was obtained from the patient’s parents for publication of the clinical photograph.
2.4. Statistical Analysis
Data were analyzed using SPSS 25.0 and GraphPad Prism 9.0. Normality was assessed with the Shapiro–Wilk test. Descriptive statistics were presented as mean ± SD or median (min–max). Pearson’s or Spearman’s tests were used for correlations, and the independent samples t-test or the Mann-Whitney U test was used for group comparisons. Linear regression was applied for multivariate analyses. A P-value < 0.05 was considered statistically significant. All quantitative variables (EBDASI, BMI SD, HAZ, WAZ, STRONGkids score, serum albumin, hemoglobin, CRP, and serum iron) were treated as continuous variables in regression analyses. The EBDASI was analyzed both as a continuous predictor and as a categorical variable (mild, moderate, severe) for group comparisons. In univariate linear regression, each predictor was entered individually against the dependent variable (BMI SD score). Variables reaching P < 0.05 in univariate analysis were subsequently entered into a multivariate linear regression model. Categorical variables (EB subtype, sex, consanguinity, enteral nutrition status, and lesion distribution) were coded as binary (0/1) for regression analyses. Cohen’s f² was calculated to estimate effect sizes, with thresholds of 0.02 (small), 0.15 (medium), and 0.35 (large).
4. Result
The study included 16 EB patients aged 3 - 17 years (mean: 10.3), with an equal gender distribution (8 female, 8 male). Diagnosis was confirmed histopathologically and genetically. One patient had osteogenesis imperfecta.
Two patients (12.5%) were preterm dizygotic twins; the others were born at term. Ten (62.5%) were delivered vaginally and six (37.5%) by caesarean section. Parental consanguinity was present in 11 patients (68.8%), and 10 (62.5%) had a family history of EB. None had received prenatal genetic counseling.
Enteral nutrition was administered to six patients (37.5%). The mean STRONGkids score was 2.4 ± 1.4, with 2 patients (12.5%) at low risk, 8 (50%) at moderate risk, and 6 (37.5%) at high risk.
Cutaneous lesions were widespread in 9 patients (56.3%), limited to hands and feet in 4 (25%), involved multiple extremities in 2 (12.5%), and localized in 1 (6.3%).
The EBDASI scores for disease severity ranged from 14 to 292, with a mean score of 129.4 ± 99.5. According to the interpretation framework proposed by Jain et al. (12), 3 patients (18.8%) were classified as having mild disease, 4 patients (25.0%) as moderate, and 9 patients (56.3%) as severe (Table 1).
Table 1.
EBDASI Severity Categories
| EBDASI Category | EBDASI Range | Patients (EBDASI Scores) | No. (%) |
|---|---|---|---|
| Mild | 0 - 42 | 14, 36, 39 | 3 (18.8) |
| Moderate | 43 - 106 | 53, 60, 80, 95 | 4 (25.0) |
| Severe | ≥ 107 | 140, 152, 231, 245, 245, 292 | 9 (56.3) |
| Total | 14 - 292 | - | 16 (100) |
Among the 16 patients, 10 (62.5%) had dystrophic EB (DEB) and 6 (37.5%) had simplex EB (EBS). The mean EBDASI score was significantly higher in DEB than in EBS (P = 0.004), ranging from 60 - 292 vs. 14 - 95, respectively.
Nutritional status differed markedly between groups. The BMI SD score was lower in DEB (-4.27 ± 3.57) than in EBS (0.10 ± 1.14) (P = 0.002). Acute malnutrition (BMI SD < -2) was present in 80% of DEB patients but absent in EBS (P = 0.007). Enteral nutrition was required more often in DEB (60% vs. 0%, P = 0.034).
Biochemical findings also indicated greater nutritional impairment and inflammation in DEB, including lower serum albumin (P = 0.017) and higher CRP (P = 0.011). Hemoglobin levels were lower but not statistically significant (P = 0.114).
Widespread lesions were more common in DEB (70% vs. 16.7%, P = 0.119), while consanguinity rates were similar between groups.
To further evaluate malnutrition, WHO-based Z-scores showed substantial nutritional deficits. Among 15 patients older than 5 years, the mean BMI SD was -2.93 ± 3.38 (median -2.04; range -12.76 to 0.63).
According to WHO criteria, 7 patients (46.7%) had severe acute malnutrition, 1 (6.7%) had moderate acute malnutrition, and 7 (46.7%) were within the normal range. Overall, 53.3% demonstrated acute malnutrition, indicating a high nutritional burden in EB patients (Figure 2).
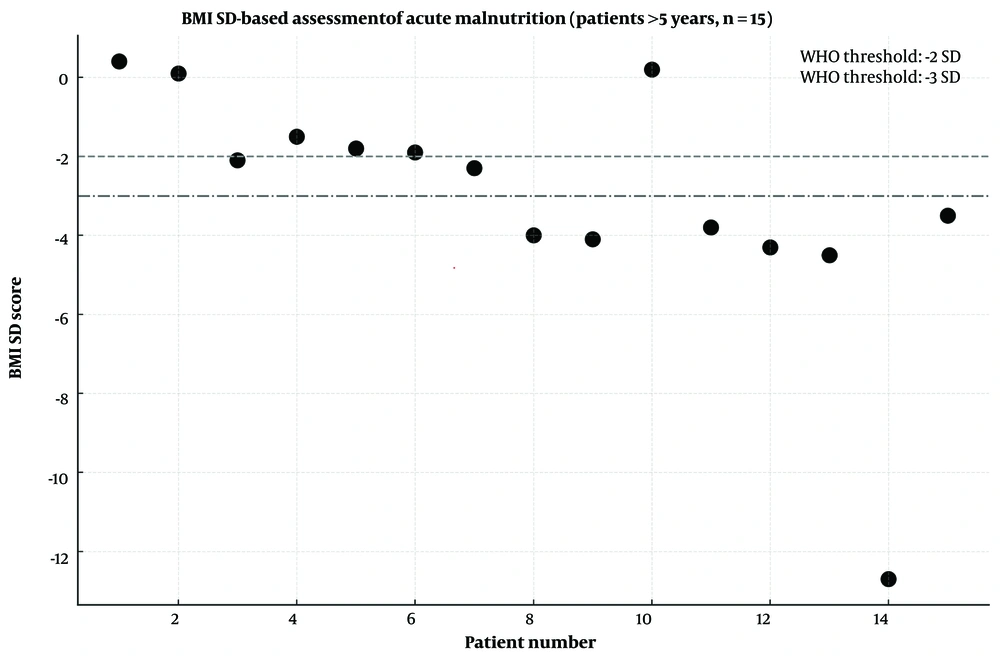
Figure 2.
The BMI SD-based assessment of acute malnutrition in patients over 5 years of age (n = 15).
Based on Height-for-Age Z-scores (HAZ), 11 patients (68.8%) had chronic malnutrition (HAZ < -2 SD), including 6 (37.5%) with severe chronic malnutrition (HAZ < -3 SD). The lowest HAZ was -9.36, indicating significant long-term growth impairment.
According to Weight-for-Age Z-scores (WAZ), 8 patients (50%) were underweight, and 5 (31.3%) had severe underweight (WAZ < -3 SD).
Similarly, BMI-for-age Z-scores (BAZ) showed that 8 patients (50%) were underweight (BAZ < -2 SD) and 7 (43.8%) had severe wasting (BAZ < -3 SD), confirming the high prevalence of acute and chronic malnutrition in EB patients (Figure 3).
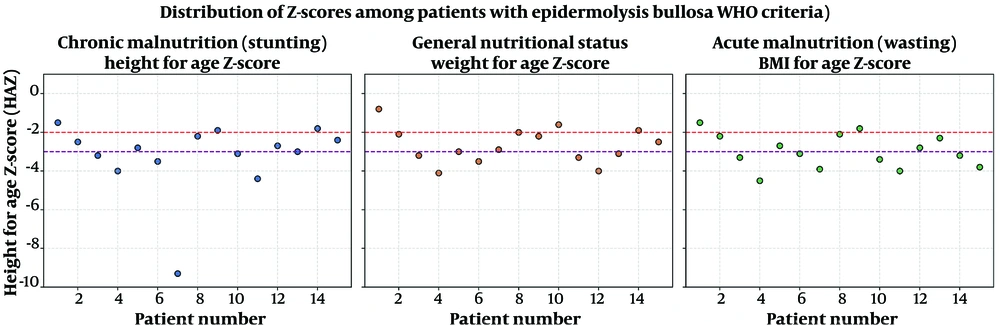
Figure 3.
Distribution of Z-scores among patients with epidermolysis bullosa (EB) according to WHO growth standards.
These findings indicate that both chronic and acute malnutrition rates are high in EB patients.
Socioeconomic status significantly affected disease severity and nutritional status. Lower household income was associated with reduced BMI SD (P = 0.023) and weight-for-age SD (P = 0.030), with mean BMI SD scores of -4.88 ± 1.09 in the low-income group versus 0.30 ± 1.25 in the moderate-income group, indicating an increased risk of malnutrition.
A near-significant association was observed between EBDASI and income level (P = 0.07). Patients from low-income households had a notably higher mean EBDASI score (218.25 vs. 124.50), suggesting a clinically relevant increase in disease burden.
Univariate regression identified disease severity (EBDASI) as the strongest predictor of malnutrition (P < 0.001), explaining 57.8% of the variance in BMI SD scores.
In addition to EBDASI, STRONGkids score, enteral nutritional support, and age were evaluated as predictors. The STRONGkids score showed a significant negative association with BMI SD (P = 0.013), indicating that higher nutritional risk is linked to poorer nutritional status and supporting its validity in EB patients (Table 2).
Table 2.
Results of Univariate Regression Analysis for Malnutrition (Ordered by P-Values)
| Variables | n | β Coefficient a | P-Value | Cohen’s f² b |
|---|---|---|---|---|
| EBDASI | 16 | -0.0274 c | 0.0006 | 1.3682 |
| CRP | 16 | -0.0646 d | 0.0092 | 0.6516 |
| STRONGkids | 16 | -1.5469 e | 0.013 | 0.5862 |
| Extensive Lesions | 16 | -4.1113 e | 0.0156 | 0.5408 |
| Iron | 16 | 0.1003 e | 0.0379 | 0.3751 |
| Hemoglobin (HGB) | 16 | 0.8604 e | 0.0401 | 0.3656 |
| Albumin | 16 | 0.2133 e | 0.0478 | 0.3361 |
| Consanguinity | 15 | -3.5730 f | 0.0996 | 0.2419 |
| Family History | 13 | -4.1495 f | 0.1817 | 0.1848 |
| Enteral Nutrition | 16 | -2.3550 f | 0.2140 | 0.1210 |
| Income Level | 16 | 0.6419 f | 0.5808 | 0.023 |
a β coefficient represents the expected change in BMI SD score per unit increase in the independent variable.
b Cohen’s f² effect size: f² ≥ 0.35 = Large; f² ≥ 0.15 = Medium; f² ≥ 0.02 = Small.
c P < 0.001: Very highly significant
d P < 0.01: Highly significant
e P < 0.05: Significant
f Not significant (P ≥ 0.05).
In the regression analyses, 32 variables were evaluated for associations with EBDASI. Total damage and total activity scores showed the strongest correlations, each explaining > 96% of the variance (P < 0.001).
Nutritional and growth indicators were also significantly associated with severity: Lower weight-for-age SD and higher STRONGkids scores were associated with higher EBDASI scores (both P < 0.001). Among laboratory markers, CRP showed a strong positive correlation, whereas serum albumin and hemoglobin showed negative correlations (all P < 0.001). Serum iron demonstrated a moderate negative correlation (P = 0.003).
Higher EBDASI scores were additionally associated with enteral nutritional support (P = 0.002), parental consanguinity (P = 0.013), and male sex (P = 0.025). No significant associations were found with ferritin, income, gestational age, lymphocyte or neutrophil counts, folate, family history, other anomalies, education level, or age at diagnosis (all P > 0.05) (Table 3).
Table 3.
Significant Predictors of Epidermolysis Bullosa Disease Activity and Scarring Index Severity Based on Regression Analysis
| Variables | β Coefficient | P-Value | R² a | Pearson r b |
|---|---|---|---|---|
| Total Damage Score | 1.8210 | 0.0000 c | 0.975 | 0.988 |
| Total Activity Score | 2.0912 | 0.0000 c | 0.968 | 0.984 |
| Weight-for-Age SD Score | -24.6935 | 0.0000 c | 0.767 | -0.876 |
| STRONGkids Score | 61.4370 | 0.0000 c | 0.756 | 0.869 |
| Serum Albumin | -9.9885 | 0.0000 c | 0.715 | -0.846 |
| C-reactive Protein (CRP) | 2.3090 | 0.0002 c | 0.654 | 0.808 |
| Hemoglobin (HGB) | -34.5739 | 0.0008 c | 0.561 | -0.749 |
| Enteral Nutrition Support | -141.0000 | 0.002 d | 0.502 | -0.708 |
| Serum Iron | -3.7277 | 0.003 d | 0.489 | -0.699 |
| Parental Consanguinity | -111.1268 | 0.013 e | 0.369 | -0.607 |
| Sex | -107.5000 | 0.025 e | 0.311 | -0.558 |
a R² indicates the proportion of EBDASI variance explained by each variable.
b Pearson r represents the strength and direction of linear correlation between each independent variable and EBDASI score.
c P < 0.001: Very highly significant
d P < 0.01: Highly significant
e P < 0.05: Significant
The findings of this study indicate that malnutrition in EB is multifactorial, with disease severity (EBDASI) being a significant determinant. In univariate analysis, EBDASI showed a large effect size (Cohen’s f² = 1.368) and high explanatory power (R² = 0.578), highlighting its key role in nutritional status.
In the multivariate model, STRONGkids score and enteral nutrition support were additional significant predictors, indicating that nutritional impairment is influenced by disease activity, inflammation, and supportive care factors.
Despite the small sample size (n = 16), narrow confidence intervals and large effect sizes support the robustness and clinical relevance of the results. These findings reinforce the need for a comprehensive, multidisciplinary approach—including disease control, routine nutritional screening, and timely intervention—to prevent and manage malnutrition in EB.
5. Discussion
This study is among the few that evaluate both disease severity and nutritional status in EB patients receiving home-based care, and it is the first such report from Turkey. The results highlight a high prevalence of malnutrition, a strong association between disease severity and nutritional impairment, and the importance of routine nutritional assessment in EB.
Severe malnutrition was identified in 68.8% of patients. Chronic malnutrition was present in 68.7%, consistent with Morales-Olvera et al. (15). Patients with dystrophic EB (DEB) exhibited significantly higher disease severity, increased inflammation, and more pronounced malnutrition than those with simplex EB (EBS), supporting the validity of EBDASI (4, 12). The lower BMI SD values and high rate of acute malnutrition (80%) in DEB are also consistent with previous studies (5, 6, 15).
The prevalence of acute malnutrition was 53.3% among children > 5 years. One patient with a BMI SD of -12.76 demonstrates the severity of nutritional deterioration. The coexistence of acute and chronic malnutrition suggests “concurrent wasting and stunting,” which is associated with markedly increased mortality (16, 17). The significantly lower hemoglobin and iron levels in patients with severe malnutrition support the presence of a chronic inflammatory state (18).
The strong association between nutritional indices and EBDASI supports the impact of malnutrition on disease burden, consistent with prior studies (5, 8). The strong correlation between STRONGkids and EBDASI underscores STRONGkids' utility for early risk detection and timely intervention in EB (11). Inflammation also plays a substantial role: CRP was strongly correlated with severity, consistent with Zeng et al. (7), reinforcing its usefulness as a marker for patient monitoring.
Anemia emerged as a significant comorbidity, strongly associated with disease severity. This finding aligns with international anemia guidelines for EB (10), which emphasize a multifactorial etiology involving chronic blood loss, iron deficiency, inflammation, and inadequate intake. Effective anemia and iron management may improve nutritional status, wound healing, and overall outcomes (10).
Hypoalbuminemia was also closely linked with disease severity, reflecting reduced protein intake and increased catabolism due to inflammation (19). Albumin’s correlation with both EBDASI and HAZ suggests its potential as a dual biomarker for monitoring disease and nutritional status.
Enteral nutrition support was significantly associated with higher severity. Although these patients exhibited poorer nutritional indices, this likely reflects advanced disease rather than treatment failure, supporting the role of enteral support in severe EB (20).
Notably, none of the families had received genetic counseling, indicating a significant gap in preventive care. Expanding access to genetic services, particularly for consanguineous families, could reduce disease incidence (3).
A distinctive strength of this study is its focus on EB within the Home Healthcare Services system. This multidisciplinary model facilitates wound care, nutritional monitoring, and infection control in patients with limited access to hospital-based care, offering a feasible and effective follow-up strategy. Our findings support integrating home-based care into EB management to improve outcomes and reduce the healthcare burden for this vulnerable population.
5.1. Limitations
The primary limitation of this study is the small sample size (n = 16). However, considering the rarity of EB, the sample is acceptable for research on rare disorders. Future studies with larger and more diverse cohorts are needed to validate these associations and enhance generalizability.
5.2. Conclusions
This study demonstrated a strong association between disease severity and nutritional status in EB patients. The EBDASI emerged as the strongest predictor of malnutrition, emphasizing the importance of effective disease activity control. The STRONGkids was a valuable tool for identifying nutritional risk and may support early intervention and improved outcomes when routinely applied. Larger, longitudinal studies are needed to confirm these findings and further evaluate the impact of enteral nutritional support in EB management.