1. Background
Children often experience pain, fear, and emotional distress during medical encounters, particularly when undergoing invasive or unfamiliar procedures (1). These experiences may hinder children’s cooperation, exacerbate anxiety, and adversely affect subsequent healthcare encounters. Growing evidence indicates that inadequately managed procedural distress not only compromises children’s immediate well-being but may also shape caregivers’ perceptions of care quality, underscoring the importance of addressing both the physical and psychological dimensions of discomfort in pediatric healthcare (2).
To address these challenges, Child Life Services (CLS) have been developed as a structured psychosocial care approach to support children and families throughout the medical process (3). CLS commonly include developmentally appropriate preparation, therapeutic play, coping skills support, and emotional guidance tailored to children’s cognitive and emotional needs (4). Empirical studies and practice guidelines indicate that CLS interventions can reduce fear and distress, enhance adaptive coping, and improve caregivers’ care experiences, thereby positioning CLS as an integral component of child-centered and family-centered pediatric care.
Although psychosocial support is increasingly recognized as a core component of high-quality pediatric care, the institutionalization of CLS in China remains relatively recent and heterogeneous (5). The CLS concept was first introduced into clinical practice at the Children’s Hospital, Zhejiang University School of Medicine (ZCH), where a Child Life professional committee was established in March 2014 (6). Subsequently, other major pediatric centers, such as Fudan University Children’s Hospital and its collaborative networks, began to explore localized CLS models, including therapeutic play, procedural preparation, and educational programs (7). However, existing Chinese publications and institutional reports are largely confined to single-center experiences, highlighting persistent gaps in service standardization, workforce development and training pathways, and sustainable institutional and policy support, all of which are critical for the consistent and equitable delivery of CLS across regions.
2. Objectives
This study aimed to conduct a national, multi-institutional assessment to characterize current CLS implementation models, identify key organizational barriers and enabling conditions, and generate empirical evidence to inform scalable management strategies and policy planning for the integration of psychosocial care into routine pediatric practice in China.
3. Methods
3.1. Study Design
In December 2025, a cross-sectional survey was conducted among medical institutions participating in the CLS Collaborative Innovation Network, coordinated by the National Clinical Research Center for Children and Adolescents' Health and Diseases. This network consists primarily of large-scale tertiary pediatric hospitals and regional children’s medical centers across China. Convenience sampling was used within this collaborative network. Eligible institutions were required to meet the following criteria: 1) having established pediatric departments, 2) actively providing child health services, and 3) willingness to participate in the survey.
A total of 36 institutions from 14 provinces and municipalities were invited, and all agreed to participate; no institutions declined participation. These institutions represent major pediatric care providers within the network; however, the sample was primarily composed of tertiary hospitals, which may limit generalizability. All participating institutions provided informed consent before data collection.
3.2. Survey Tools
The questionnaire used to assess the implementation status of CLS was developed by the research team based on a comprehensive review of relevant literature on pediatric psychosocial care and service implementation, as well as expert discussions within the CLS Collaborative Innovation Network. The instrument was designed to capture multiple dimensions of CLS implementation and included the following domains: 1) basic hospital characteristics and organizational support, 2) implementation status of CLS, 3) organizational affiliation and staffing patterns, 4) service content and commonly used formats, 5) perceived effects and professional benefits, 6) facilitating and hindering factors, and 7) future planning and development trends. Representative items included questions such as “Has your institution established a dedicated Child Life team?”, “What types of CLS are currently provided?”, and “What are the main barriers to the implementation of CLS in your institution?” Most items were presented in multiple-choice format, whereas selected items assessing perceived effects and influencing factors were measured using a 5-point Likert scale (1 = no influence, 5 = extremely influential).
To ensure content validity, the questionnaire was reviewed by a panel of 10 experts in pediatric nursing, child life services, and hospital management. The experts evaluated the relevance, clarity, and comprehensiveness of each item, and revisions were made accordingly. The questionnaire underwent pretesting and pilot testing to optimize clarity and feasibility. Internal consistency reliability was assessed using Cronbach’s alpha (α = 0.88). For Likert-scale items, mean scores and standard deviations were calculated, whereas categorical variables were summarized using frequencies and percentages.
3.3. Data Collection and Quality Control
An online questionnaire survey was conducted using the Wenjuanxing platform. Nursing directors from participating institutions were contacted in advance and provided with a detailed explanation of the study purpose, significance, and questionnaire content. Each institution was asked to designate 1 key informant to complete the questionnaire. These respondents were typically nursing directors, department heads, or staff members directly involved in the organization or delivery of CLS. Respondents were instructed to complete the questionnaire based on institution-level information, including administrative data, service implementation status, and organizational arrangements, rather than personal opinions. The unit of analysis in this study was the medical institution. If more than 1 questionnaire was submitted from the same institution, responses were reviewed and consolidated. Any discrepancies or inconsistencies were further verified through telephone follow-up with the respondents to ensure data accuracy and completeness.
A total of 51 questionnaires were initially received. Duplicate responses were identified based on institution names and contact information and consolidated into a single record per institution. Questionnaires with logical inconsistencies were flagged and verified through telephone follow-up. Inconsistencies referred to conflicting responses across related items. Key variables, including CLS implementation status, organizational affiliation, and staffing levels, were selectively verified through follow-up communication. In addition, a subset of institutions underwent further verification to ensure data accuracy. After data cleaning and verification, 36 valid questionnaires were included in the final analysis.
3.4. Statistical Analysis
Data were entered in Microsoft Excel and analyzed using IBM SPSS Statistics software (version 26.0). Categorical variables were described as frequencies and percentages [n (%)], and selected key proportions were supplemented with 95% confidence intervals (95% CI). Continuous variables were tested for normality using the Shapiro-Wilk test. Variables not conforming to a normal distribution were presented as the median and interquartile range [M (P25, P75)]. Items measured on a 5-point Likert scale were summarized as the mean ± standard deviation (x̄ ± s). For multiple-response items, percentages were calculated using the total sample size as the denominator. After data cleaning, no missing data remained. As this was a descriptive study, no inferential statistical analyses were performed.
3.5. Ethical Considerations
Ethical approval was obtained from the Ethics Committee of Children’s Hospital, Zhejiang University School of Medicine (Approval No. KY-2026 - 0085). All procedures were conducted in accordance with the Declaration of Helsinki. Written informed consent was obtained from all participants.
4. Results
4.1. Basic Characteristics
A total of 36 medical institutions were included in this study, most of which were located in East China. Most were tertiary grade A hospitals, with general hospitals and pediatric specialty hospitals accounting for the largest proportions. The median numbers of total authorized beds and pediatric beds were 1415.5 and 234.0, respectively. The median numbers of pediatric outpatient visits and inpatient admissions in 2024 were 405000 and 35000, respectively. In terms of organizational support, more than half of the hospitals had volunteer centers or pediatric psychology departments; however, 16.7% of the hospitals had not established any relevant supportive departments. The basic characteristics and organizational support of participating institutions are presented in Table 1.
Table 1.
Basic Characteristics and Organizational Support of Participating Institutions (N = 36) a
| Categories and Indicators | Values |
|---|---|
| Geographic distribution | |
| East China | 22 (61.1) |
| South China | 5 (13.9) |
| Southwest China | 5 (13.9) |
| Central China | 1 (2.8) |
| Northeast China | 1 (2.8) |
| North China | 1 (2.8) |
| Northwest China | 1 (2.8) |
| Hospital type | |
| General hospital | 14 (38.9) |
| Pediatric specialty hospital | 12 (33.3) |
| Maternal and child health hospital | 8 (22.2) |
| Other, including oncology specialty hospital | 2 (5.6) |
| Tertiary grade A | 31 (86.1) |
| Tertiary grade B | 4 (11.1) |
| Secondary grade A | 1 (2.8) |
| Hospital scale and service volume | |
| Total authorized beds | 1415.5 (600.0 - 2035.0) |
| Pediatric outpatient visits in 2024 (× 104) | 40.5 (9.0 - 207.5) |
| Pediatric inpatient admissions in 2024 (× 104) | 3.5 (1.0 - 10.0) |
| Organizational supportive departments | |
| Volunteer center | 23 (63.9) |
| Pediatric psychology department | 20 (55.6) |
| Social work department | 16 (44.4) |
| Medical humanities department | 7 (19.4) |
| None of the above | 6 (16.7) |
a Values are expressed as No. (%) or median (IQR). Organizational supportive departments was a multiple-response item; percentages were calculated using the total sample size (n = 36) as the denominator, and the sum of percentages may exceed 100%.
4.2. Current Status of Child Life Service Implementation
Among the 36 medical institutions, 19.4% (95% CI, 6.5%-32.3%) had implemented CLS systematically, 63.9% (95% CI, 48.2%-79.6%) provided non-systematic services, and 16.7% (95% CI, 4.5%-28.9%) had not implemented any form of CLS.
Among hospitals that had implemented CLS (n = 30), the earliest initiation of these services dated back to 2014. Overall, 40.0% of hospitals had established a dedicated Child Life team, whereas 60.0% had no specialized team. Regarding service coverage, 56.7% of hospitals reported a coverage rate of less than 25%, 13.3% reported 25%-50% coverage, 6.7% reported 50%-75% coverage, and 23.3% reported coverage exceeding 75%. In terms of service delivery, 53.3% of hospitals provided planned routine services, while 46.7% offered unplanned, needs-based services. With respect to service frequency, 30.0% of hospitals provided services at least once per week, 16.7% once every 2 weeks, 13.3% once per month, and 16.7% once per quarter or less; in 23.3% of hospitals, service frequency varied substantially and could not be averaged.
4.3. Organizational Affiliation and Staffing of Child Life Services
In terms of organizational management and staffing, CLS were primarily affiliated with the nursing department (50.0%), followed by the pediatric department (23.3%) and the social work department (13.3%), whereas only a small proportion of hospitals had established independent departments (10.0%). Most hospitals reported insufficient full-time staffing, with 83.3% employing fewer than 2 full-time staff members. Within Child Life teams, 50.0% included members with a social work background, whereas 33.3% included members with a psychology background and 33.3% with an education background. Only 36.7% of hospitals had established a regular training system. Overall, self-rated resource allocation was moderate to low, and only 30.0% of hospitals reported having dedicated funding or financial support for CLS. Details on organizational affiliation, staffing, training systems, and funding are shown in Table 2.
Table 2.
Organizational Affiliation and Staffing of Child Life Services (N = 30) a
| Indicators and Categories | No. (%) |
|---|---|
| Administrative affiliation | |
| Nursing department | 15 (50.0) |
| Pediatric department | 7 (23.3) |
| Social work department | 4 (13.3) |
| Independent department | 3 (10.0) |
| Other | 1 (3.3) |
| Number of full-time staff | |
| < 2 | 25 (83.3) |
| ≥ 2 | 5 (16.7) |
| Professional background of team members | |
| Psychology background | 10 (33.3) |
| Social work background | 15 (50.0) |
| Education background | 10 (33.3) |
| Establishment of a regular training system | |
| Yes | 11 (36.7) |
| No | 19 (63.3) |
| Self-rated resource allocation | |
| Extremely insufficient | 4 (13.3) |
| Insufficient | 7 (23.3) |
| Moderate | 13 (43.3) |
| Relatively sufficient | 3 (10.0) |
| Sufficient | 3 (10.0) |
| Dedicated funding or grants | |
| Yes | 9 (30.0) |
| No | 16 (53.3) |
| Unclear | 5 (16.7) |
a Only institutions that had implemented any form of CLS were included (n = 30).
4.4. Service Content and Commonly Used Formats
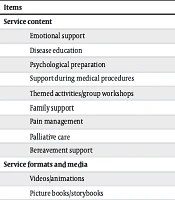
Regarding service content, CLS mainly focused on emotional support (90.0%), disease education (86.7%), psychological preparation (80.0%), and support during medical procedures (80.0%). More than two-thirds of hospitals also provided themed activities or group workshops (76.7%) and family support (63.3%). In contrast, palliative care (46.7%) and bereavement support (30.0%) were provided less frequently.
In terms of service formats and media, videos/animations (93.3%), picture books/storybooks (90.0%), drawing/doodling (90.0%), and handicrafts (90.0%) were the most commonly used approaches, followed by medical equipment models (86.7%) and therapeutic play (73.3%). The use of virtual reality or augmented reality technologies was relatively limited (26.7%). The main service content, formats, and media used in CLS are summarized in Table 3.
Table 3.
Main Service Content, Formats, and Media Used in CLS (N = 30) a
| Items | No. (%) |
|---|---|
| Service content | |
| Emotional support | 27 (90.0) |
| Disease education | 26 (86.7) |
| Psychological preparation | 24 (80.0) |
| Support during medical procedures | 24 (80.0) |
| Themed activities/group workshops | 23 (76.7) |
| Family support | 19 (63.3) |
| Pain management | 17 (56.7) |
| Palliative care | 14 (46.7) |
| Bereavement support | 9 (30.0) |
| Service formats and media | |
| Videos/animations | 28 (93.3) |
| Picture books/storybooks | 27 (90.0) |
| Drawing/doodling | 27 (90.0) |
| Handicrafts | 27 (90.0) |
| Medical equipment models | 26 (86.7) |
| Therapeutic play | 22 (73.3) |
| Storytelling/narrative therapy | 20 (66.7) |
| Anatomical charts/dolls | 20 (66.7) |
| Developmental play | 16 (53.3) |
| Digital interactive apps | 16 (53.3) |
| Music activities | 16 (53.3) |
| Audio-guided interventions | 15 (50.0) |
| Social stories/scripts | 15 (50.0) |
| VR/AR | 8 (26.7) |
a Multiple-response item; percentages were calculated using n = 30 as the denominator and may sum to more than 100%. Abbreviation: VR/AR = virtual reality/augmented reality.
4.5. Perceived Effects and Professional Benefits
Regarding perceived effects, most respondents considered CLS to have a positive impact on children’s pain and emotional status. Specifically, 93.3% of respondents reported that children’s pain was improved or significantly improved. All respondents believed that CLS contributed to improvements in children’s emotional status, parents’ emotional status, and parental satisfaction. Regarding professional benefits, all respondents indicated that Child Life training had a positive impact on their professional development, with 50.0% reporting a very positive impact. Respondents’ evaluations of perceived effects are presented in Table 4.
Table 4.
Respondents' Evaluations of the Effects of Child Life Services (N = 30) a
| Indicator | Significant improvement | Improvement | No change | Uncertain |
|---|---|---|---|---|
| Children's pain level | 9 (30.0) | 19 (63.3) | 1 (3.3) | 1 (3.3) |
| Children's emotional status | 16 (53.3) | 14 (46.7) | 0 | 0 |
| Parents' emotional status | 15 (50.0) | 15 (50.0) | 0 | 0 |
| Parental satisfaction | 18 (60.0) | 12 (40.0) | 0 | 0 |
a Values are expressed as No. (%). Only institutions that had implemented any form of CLS were included (n = 30).
4.6. Facilitating and Hindering Factors
Among the facilitating factors, policy advocacy, managerial support, and social/public welfare resources received relatively high scores, all with mean values above 4.5. Training opportunities and interdepartmental collaboration were also considered important facilitators for the development of CLS. In contrast, insufficient funding, inadequate staffing, and lack of managerial attention were rated as the most prominent hindering factors, indicating that limitations in resources and management support remain major barriers to implementing CLS. Scores for facilitating and hindering factors are shown in Table 5.
Table 5.
Scores of Factors Facilitating and Hindering the Development of CLS (N = 30)
| Factors | Mean ± SD |
|---|---|
| Facilitating factors | |
| Policy advocacy | 4.73 ± 0.83 |
| Managerial support | 4.67 ± 0.88 |
| Hindering factors | |
| Insufficient funding | 3.93 ± 1.08 |
| Inadequate staffing | 3.87 ± 1.28 |
| Lack of managerial attention | 3.87 ± 1.22 |
| Insufficient space | 3.67 ± 1.21 |
| Poor interdepartmental collaboration | 3.53 ± 1.33 |
4.7. Reasons for Nonimplementation of Child Life Services
Among hospitals that had not implemented CLS, all respondents identified insufficient funding and the lack of incorporation into the performance evaluation system as the primary limiting factors. In addition, more than 80% of respondents considered the lack of policy guidance to be an important barrier to initiating such services. Insufficient awareness of the Child Life concept and a shortage of professional personnel were also reported by some hospitals. Reasons for nonimplementation are summarized in Table 6.
Table 6.
Main Reasons for No Implementation of CLS (N = 6) a
| Reasons | No. (%) |
|---|---|
| Insufficient funding | 6 (100.0) |
| Not incorporated into the performance evaluation system | 6 (100.0) |
| Lack of policy guidance | 5 (83.3) |
| Lack of awareness of the Child Life concept | 4 (66.7) |
| Shortage of professional personnel | 3 (50.0) |
| Other | 2 (33.3) |
| Uncertainty about how to initiate the service | 1 (16.7) |
a Only hospitals that had not yet implemented Child Life Services were included.
4.8. Development Prospects
Most hospitals had either planned or were preparing to implement CLS within the next 2 - 3 years, and there was a widespread demand for training or collaborative support. The vast majority of respondents believed that CLS are likely to develop into routine humanistic care services in the future. Institutional and policy support, talent development, and multidisciplinary collaboration were identified as the most urgently needed areas for strengthening. Future planning, support needs, and development prospects are presented in Table 7.
Table 7.
Future Planning, Support Needs, and Development Prospects of CLS (N = 36)
| Modules and Items | No. (%) |
|---|---|
| Implementation plan for the next 2 - 3 (y) | |
| Already planned | 12 (33.3) |
| Under preparation | 11 (30.6) |
| Willing but currently lacking resources | 7 (19.4) |
| No plan at present | 4 (11.1) |
| Unclear | 2 (5.6) |
| Demand for training or collaborative support | |
| Yes | 24 (66.7) |
| Depending on circumstances | 11 (30.6) |
| No | 1 (2.8) |
| Perceived future development trend | |
| Will become a routine humanistic care service | 31 (86.1) |
| Implemented on a limited basis | 3 (8.3) |
| Difficult to sustain | 1 (2.8) |
| Other | 1 (2.8) |
| Priority areas for future strengthening | |
| Institutional/policy support | 33 (91.7) |
| Talent development | 32 (88.9) |
| Multidisciplinary collaboration | 28 (77.8) |
| Facility/space development | 25 (69.4) |
| Research and evaluation system | 24 (66.7) |
| Parent education | 18 (50.0) |
| Other | 1 (2.8) |
5. Discussion
5.1. Implementation Status of Child Life Services
Only 19.4% of the surveyed hospitals had fully implemented CLS, whereas 63.9% provided limited or informal services and 16.7% provided none. These findings indicate that CLS implementation remains limited and heterogeneous across participating institutions and that the institutionalization of CLS in China remains in its infancy (8). Early efforts often rely on short-term projects or volunteer-driven initiatives rather than being formally embedded in hospital systems. By contrast, most pediatric hospitals in the United States have established child life programs, underscoring that Chinese institutions lag in service standardization and policy support for CLS (9). This gap between conceptual endorsement and operational integration highlights the need for national strategies to embed CLS into routine pediatric care.
5.2. Personnel and Training Challenges
The results showed that 50.0% of CLS programs were administratively affiliated with nursing departments, whereas only 10.0% had established independent CLS units, and 83.3% of hospitals reported fewer than 2 full-time CLS staff members. This organizational pattern reflects a substantial workforce shortage and limited institutional recognition of CLS as an independent professional discipline.
Internationally, certified CLS professionals are expected to complete supervised internship training and formal coursework in developmental and family psychology. In contrast, China currently lacks standardized training and credentialing pathways for CLS, consistent with our finding that only 36.7% of hospitals had established a regular training system. Previous studies have similarly identified unclear career pathways and insufficient managerial support as key barriers to professional retention and workforce sustainability (10). Taken together, these findings indicate that systematic reforms in training structures, certification mechanisms, and professional development pathways are essential to support the sustainable development of the CLS workforce.
5.3. Service Scope and Effectiveness
The scope of CLS primarily focused on providing emotional support and illness education to pediatric patients, whereas services such as palliative care preparation or bereavement support were rarely reported. This distribution suggests that current CLS practices in China emphasize preprocedural and emotion-focused interventions but lack comprehensive psychosocial continuity across the full illness trajectory. Similar patterns have been reported in the early stages of CLS development internationally, where play-based preparation and procedural support typically precede the expansion of services to palliative and family-centered end-of-life care (11).
Despite the limited scope, the vast majority of hospitals (over 90%) observed clear benefits from CLS, including reductions in children's pain and anxiety and improved parental satisfaction (12). These outcomes are consistent with international studies showing that developmentally appropriate preparation, therapeutic play, and coping interventions delivered by CLS can significantly reduce children's fear and distress and improve family satisfaction with care. Overall, even under resource constraints, our findings indicate that CLS provides tangible psychosocial benefits, supporting its inclusion as a standard component of pediatric care to enhance patient and family experiences (13).
5.4. Regional and Institutional Variations
Marked disparities were observed across regions and hospital types. Pediatric specialty hospitals exhibited the highest rate of CLS implementation, whereas general and maternal hospitals lagged behind. Geographically, hospitals in East China accounted for over 60% of active CLS programs, whereas those in central and western provinces reported limited progress. These results mirror regional disparities observed in other pediatric healthcare services, including pediatric enhanced recovery after surgery implementation, in which eastern regions showed higher readiness and stronger policy backing. This geographic imbalance reflects broader socioeconomic and policy inequities, emphasizing the need for national coordination to ensure equitable access to psychosocial care for children across regions.
5.5. Facilitators and Barriers
Among facilitating factors, policy advocacy and managerial support received the highest ratings, whereas insufficient funding, inadequate staffing, and lack of managerial attention were identified as the most prominent barriers to the development of CLS. These findings underscore the decisive role of institutional leadership and financial stability in sustaining CLS programs (14). Consistent with international evidence, strong managerial commitment and integration into organizational governance structures have been shown to be critical predictors of the establishment and long-term sustainability of psychosocial care programs in pediatric settings. Notably, all hospitals that had not yet implemented CLS identified funding shortages and the absence of CLS-related indicators in performance evaluation systems as primary barriers. Collectively, these results provide quantitative support for the view that policy integration, stable budgetary mechanisms, and managerial accountability are essential prerequisites for the institutionalization of humanistic care in pediatric healthcare systems.
5.6. Policy and Funding Implications
Only 30.0% of hospitals reported having dedicated funding or grants for CLS, whereas more than half had no specific financial support, and a proportion of respondents were uncertain about funding availability. This finding indicates that most CLS programs currently rely on ad hoc or project-based support rather than being incorporated into structural hospital budgeting frameworks.
Internationally, sustainable CLS programs are typically supported through diversified funding models, including allocations from hospital operating budgets, philanthropic or charitable foundations, and, in some settings, insurance-linked or child-centered funding initiatives (15). Therefore, integrating CLS into hospital strategic planning, establishing earmarked and stable funding mechanisms, and incorporating CLS-related indicators into performance evaluation systems are essential steps to promote long-term sustainability and institutional accountability.
5.7. Child Life Services as an Innovative Care Model
Beyond representing a set of psychosocial interventions, CLS in China reflect an emerging model of service innovation within pediatric healthcare organizations. In a system traditionally dominated by biomedical treatment and a high clinical workload, CLS introduce structured, developmentally appropriate, and family-centered practices that bridge medical care and psychosocial support. Importantly, the findings of this study suggest that CLS function not only at the clinical level but also at the organizational level, influencing care processes, interdisciplinary collaboration, and the institutionalization of humanistic care. Such service innovation is particularly relevant for transitional healthcare systems, where standardized psychosocial services have not yet been fully integrated into routine pediatric practice. The Chinese experience documented in this national survey therefore provides transferable insights for other developing or rapidly evolving pediatric healthcare systems seeking scalable models to embed psychosocial care into hospital-based services.
5.8. Study Limitations
This study has several limitations. First, as a cross-sectional survey, it reflects a static snapshot and cannot assess longitudinal trends in CLS development. Second, self-reported data may introduce reporting bias and overestimate implementation rates. Third, because participating institutions were primarily tertiary hospitals, the findings may not be fully representative of practices in smaller community hospitals. Finally, the study did not collect detailed outcome data for children and families; future research should include mixed-method designs to evaluate both psychosocial and clinical impacts of CLS interventions.
5.9. Conclusions
This multi-institutional study provides the first national evidence on CLS in China. Although 83.3% of hospitals have introduced CLS, implementation remains fragmented, underfunded, and weakly institutionalized. Insufficient staffing, lack of systematic training, and unstable support constrain development; however, reported improvements in pain relief, emotional well-being, and parental satisfaction highlight clear benefits. Future progress depends on professionalization through certification, institutionalization via policy and funding, and standardization through national guidelines. CLS should be recognized as a core component of pediatric humanistic care, integrating psychosocial support into routine healthcare to promote holistic well-being for children and families.