
1. Background
Dental caries in primary teeth is among the most prevalent chronic diseases in children and often progresses to pulpitis, affecting maxillofacial development and permanent tooth eruption. Root canal treatment is the standard approach for preserving affected teeth; however, its success depends critically on coronal seal integrity, and microleakage and secondary caries are primary causes of failure (1). For children requiring GA because of behavioral difficulties, restoration selection poses unique challenges. Parents expect comprehensive single-visit solutions to avoid re-anesthesia, whereas limited GA time necessitates efficient and reliable procedures (2). These patients typically present with multiple carious lesions, rapid disease progression, and poor oral hygiene, necessitating superior long-term stability (3).
Dental rehabilitation under GA (DGA) differs from outpatient care with respect to disease severity and prognosis. Patients undergoing DGA often have a higher caries burden (dmft > 8) and lower compliance (3, 4). Existing evidence is derived mainly from outpatient settings, and extrapolation to DGA may be flawed. Given the irreversible nature of DGA, longevity should be prioritized over short-term success, consistent with the European Academy of Paediatric Dentistry (EAPD) guidelines on treatment sustainability (4).
Current options include stainless steel crowns, with proven durability (5); sonic-activated bulk-fill resin, which enables rapid completion (6); and conventional layered resin, which carries risks of polymerization shrinkage (7). However, existing evidence primarily originates from outpatient studies under local anesthesia (8). Although SSCs are recommended for extensive primary molar defects (9), direct comparisons in GA settings are lacking (10).
2. Objectives
We hypothesized that, under the ideal moisture isolation provided by GA, resin materials might exhibit improved short-term performance; however, their mechanical limitations, including an elastic modulus mismatch and polymerization shrinkage, would still result in inferior long-term success compared with SSCs.
3. Methods
3.1. Study Design, Setting, and Participants
This retrospective cohort study was conducted at the Department of Stomatology, Shanghai Children's Hospital, a tertiary pediatric specialty hospital in China. The study was approved by the Ethics Committee of Shanghai Children's Hospital (reference number 2025R077-E01), and informed consent was waived for anonymized records.
Patients were referred internally because of difficulties with behavioral management and externally because of complex cases requiring GA. The typical treatment pathway comprised outpatient assessment, preoperative GA evaluation, comprehensive treatment under GA, and postoperative follow-up.
Using the hospital's electronic medical record system, we identified 312 children who underwent primary molar RCT under GA performed by the same pediatric dentist between March 2021 and December 2022. Of these, 201 met the preliminary inclusion criteria, and 36 were excluded because of incomplete follow-up (change of contact, n = 20; relocation, n = 10; parental refusal, n = 6), leaving 165 patients with complete records. From these 165 eligible patients, 120 patients (40 per group) were randomly selected using a random number table to equalize group sizes for stable statistical comparisons. This sample size (n = 40/group) was confirmed to be adequate by power calculation (see the Sample Size section). This randomly balanced sampling was performed to enhance statistical efficiency and did not introduce selection bias because baseline characteristics were comparable (Table 1). This study represents a retrospective analysis of a randomly balanced sample drawn from a consecutive eligible cohort.
| Characteristic | SSC Group | SonicFill Group | Layered Resin Group | P-Value |
|---|---|---|---|---|
| Sex (M/F) | 22/18 | 25/15 | 23/17 | 0.787 |
| Age (y) | 4.53 ± 1.09 | 4.67 ± 1.29 | 4.55 ± 1.18 | 0.833 |
| BMI (kg/m) | 21.38 ± 1.62 | 21.25 ± 1.56 | 21.21 ± 1.59 | 0.884 |
| Tooth type (maxillary/mandibular) | 110/120 | 113/107 | 109/108 | 0.745 |
| Caries extent | 0.749 | |||
| Single-surface | 0 (0.0) | 0 (0.0) | 0 (0.0) | |
| Two-surface | 6 (15.0) | 6 (15.0) | 4 (10.0) | |
| Multiple-surface (≥ 3) | 34 (85.0) | 34 (85.0) | 36 (90.0) |
a Values are expressed as No. (%) or mean ± SD unless indicated. Abbreviations: BMI, Body Mass Index; SSC, stainless steel crown; SonicFill, SonicFill bulk-fill resin.
b Fisher exact test or one-way analysis of variance was used. Caries extent was defined as single-surface (1 surface), two-surface (2 surfaces), or multiple-surface (≥ 3 surfaces involving proximal, occlusal, or buccal/lingual surfaces). No significant differences were found among groups in age, sex, BMI, tooth arch, or caries extent (all P > 0.05), confirming baseline comparability despite nonrandom allocation.
Inclusion criteria were as follows: 1) age 3 - 8 years; 2) inability to cooperate under local anesthesia (Frankl scale ≤ 2); 3) parental consent; 4) complete records; 5) American Society of Anesthesiologists physical status I; 6) no periapical pathology or internal resorption greater than one-third of the root length; and 7) no subgingival margins greater than 2 mm.
Exclusion criteria were as follows: 1) parafunctional habits or temporomandibular disorders; 2) severe systemic disease affecting oral care; 3) incomplete follow-up records; 4) periapical pathology or root resorption greater than one-third of the root length; and 5) need for surgical crown lengthening.
3.2. Sample Size
3.3. Operative Procedures
All teeth received standardized pulpectomy, including rubber dam isolation, rotary nickel-titanium instrumentation to size 30#, irrigation with 2.5% NaOCl and saline, and obturation with Vitapex. Permanent restoration was placed immediately.
Caries extent was recorded as single-surface, two-surface, or multiple-surface (≥ 3 surfaces). All procedures were performed by one experienced pediatric dentist (> 500 SSC cases and > 200 SonicFill cases). General anesthesia time was ≤ 90 minutes.
Group A (SSCs): Stainless steel crowns (Shinhing, Korea) were placed after 1.0 ± 0.2 mm occlusal reduction, proximal opening of approximately 1 mm, and cervical adaptation using contouring pliers. The crowns were cemented with glass ionomer (GC Fuji I).
Group B (SonicFill): SonicFill bulk-fill resin (Kerr, USA) was placed after placement of a zinc phosphate base and application of a self-etch adhesive, sonic activation, and 20-second light curing.
Group C (Layered resin): 3M Z250 was placed in 2-mm increments, each light-cured for 20 seconds, using the same adhesive.
3.4. Outcome Assessment
Follow-up: All patients had documented clinical evaluations at 3, 12, and 24 months after treatment (± 2 weeks at 3 months and ± 1 month at 12 and 24 months) to assess longitudinal outcomes. Occlusal function and parental satisfaction were assessed only at 12 months. Because this retrospective study used existing medical records, only patients with complete follow-up documentation at all three time points were included.
Examiner blinding and reliability: Two trained examiners (inter-examiner reliability κ = 0.88 - 0.91) evaluated outcomes using standardized criteria. Examiners were blinded to restoration type via a random coding system. Calibration training was conducted before the examinations.
Longitudinal outcomes (3, 12, and 24 months):
Restoration integrity and marginal adaptation were assessed using APHA criteria (11): Type A, ideal; Type B, acceptable minor defects; and Type C, unacceptable and requiring replacement. “Microleakage” corresponded to the marginal adaptation domain.
Secondary caries was assessed using APHA criteria: A, absent; and B, present.
Cross-sectional outcomes (12 months only):
Occlusal function was measured using a 100-point scale (12) assessing masticatory efficiency, occlusal harmony, patient comfort, and impact on daily life.
Parental satisfaction was assessed using a custom 10-item questionnaire (13) converted to a 100-point scale: ≥ 85, very satisfied; 60 - 84, satisfied; and < 60, dissatisfied.
Worst-tooth principle: For patients with multiple treated teeth, if any tooth showed a non-ideal outcome, the patient was classified accordingly. This approach is clinically justified because failure of any single restoration in the GA setting may necessitate re-anesthesia. This principle may introduce conservative estimation bias, which was addressed through complementary tooth-level GEE analysis. For multiple simultaneous failures, the most severe type was recorded.
Success definitions:
Clinical success (primary outcome): Type A for restoration integrity, Type A for marginal adaptation, and no secondary caries at 24 months.
Clinical failure: Type C in any dimension or Type B for secondary caries.
Success rate = (clinical success cases / total patients) × 100%.
3.5. Statistical Analysis
Given the nonrandom allocation, we addressed confounding through procedural standardization, a restricted study period, and multivariable adjustment for prespecified confounders, including age, sex, caries extent, and tooth arch (3, 5).
Statistical methods by outcome were as follows:
Primary outcome (24-month success): Fisher exact test with Bonferroni correction (α = 0.017) was used for between-group comparisons, and the Cochran Q test was used for temporal trends. Effect estimates included RD, RR, NNT, and 95% CIs.
Longitudinal categorical outcomes (restoration integrity, marginal adaptation, and secondary caries at 3, 12, and 24 months): Fisher exact test was used for between-group comparisons, and the Cochran Q test was used for intragroup time trends.
Cross-sectional continuous outcome (occlusal function score at 12 months): One-way analysis of variance with the Tukey honest significant difference post hoc test was used. Assumptions were verified: normality was confirmed by the Shapiro-Wilk test (P > 0.05), and homogeneity of variance was confirmed by the Levene test (P = 0.123), satisfying the assumptions for analysis of variance.
Parental satisfaction (ordinal 3-level outcome: very satisfied, satisfied, and dissatisfied): The Kruskal-Wallis H test was used as the nonparametric method for ordinal data.
Analyses were performed using SPSS version 26.0. The primary analysis used the patient-level worst-tooth principle. The sensitivity analysis used tooth-level GEE with robust standard errors. Longitudinal categorical outcomes were analyzed using Fisher exact test with Bonferroni correction (α = 0.017) and the Cochran Q test for temporal trends. Cross-sectional outcomes (occlusal function at 12 months) were analyzed using one-way analysis of variance with the Tukey honest significant difference post hoc test. Effect estimates included RD, RR, NNT, and 95% CIs. Multivariable logistic regression reported aORs and 95% CIs after adjustment for prespecified confounders.
Missing data were handled by complete case analysis. All 120 patients had complete follow-up data at all time points. Comparison of included patients (n = 120) and excluded patients (n = 36) supported a missing completely at random assumption (Table S1 in Supplementary File).
Significance was set at P < 0.05, with pairwise significance set at P < 0.017 after Bonferroni correction.
4. Results
The flow of participants through the study is shown in Figure 1.
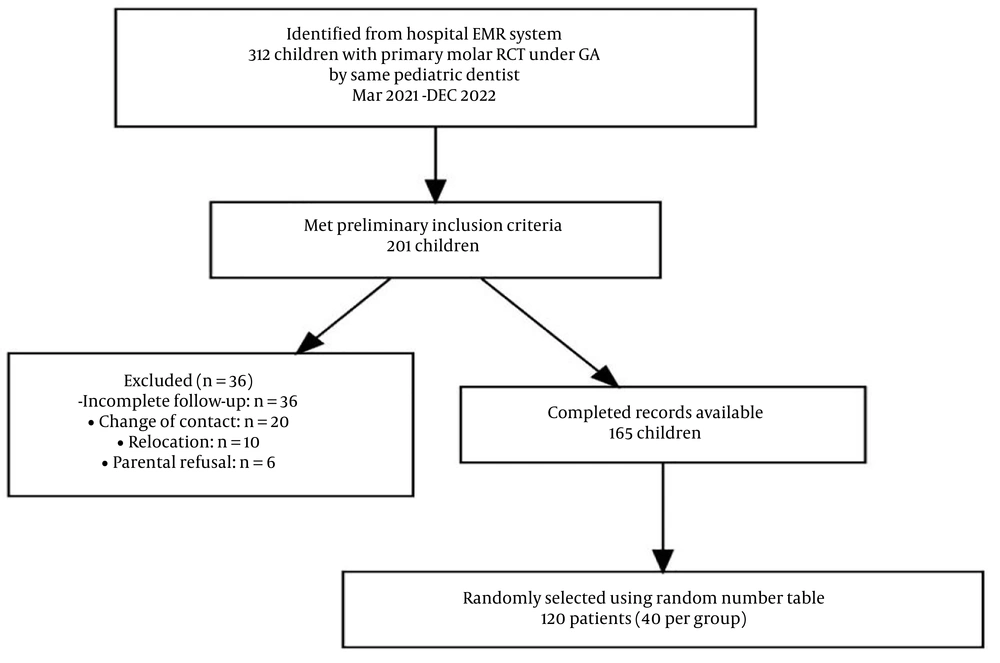
Figure 1.
STROBE flow diagram of participant selection and follow-up. GA, general anesthesia; RCT, root canal treatment.
All 120 included patients completed follow-up at all three time points (3, 12, and 24 months), achieving 100% follow-up completeness with no attrition during the study period. Comparisons between included patients (n = 120) and excluded patients (n = 36) supported the missing completely at random assumption for age (P = 0.812), sex (P = 0.654), caries extent (P = 0.743), tooth arch (P = 0.701), and number of treated teeth (P = 0.688) (Table S1 in Supplementary File) (Tables 2 and 3).
| Time Point and Outcome Measure | Type A (Ideal) SSC | Type A (Ideal) SonicFill | Type A (Ideal) Layered Resin | P-Value c | Intergroup Comparisons (P) |
|---|---|---|---|---|---|
| 3 months | |||||
| Marginal adaptation | 40/40 (100.0) | 40/40 (100.0) | 39/40 (97.5) | 0.365 | A vs B: 1.000; A vs C: 1.000; B vs C: 1.000 |
| Restoration integrity | 40/40 (100.0) | 40/40 (100.0) | 39/40 (97.5) | 0.365 | All: 1.000 |
| Secondary caries (absent) d | 40/40 (100.0) | 40/40 (100.0) | 40/40 (100.0) | 1.000 | All: 1.000 |
| 12 months | |||||
| Marginal adaptation | 40/40 (100.0) | 34/40 (85.0) | 32/40 (80.0) | 0.015 | A vs B: 0.026; A vs C: 0.005; B vs C: 0.770 |
| Restoration integrity | 40/40 (100.0) | 34/40 (85.0) | 32/40 (80.0) | 0.015 | A vs B: 0.026; A vs C: 0.005; B vs C: 0.770 |
| Secondary caries (absent) d | 40/40 (100.0) | 35/40 (87.5) | 34/40 (85.0) | 0.045 | A vs C: 0.026 |
| 24 months | |||||
| Marginal adaptation | 39/40 (97.5) | 32/40 (80.0) | 30/40 (75.0) | 0.015 | A vs B: 0.029; A vs C: 0.007 |
| Restoration integrity | 40/40 (100.0) | 32/40 (80.0) | 31/40 (77.5) | 0.007 | A vs B: 0.005; A vs C: 0.002 |
| Secondary caries (absent) d | 39/40 (97.5) | 33/40 (82.5) | 32/40 (80.0) | 0.045 | A vs C: 0.029 |
a Values are expressed as n/N (%). Abbreviations: N, total number of patients per group; APHA, American Public Health Association; A, SSC group; B, SonicFill group; C, layered resin group.
b Numerator (n) represents patients achieving Type A (ideal) outcome; denominator (N = 40) represents total patients in each group. Type A indicates ideal status per APHA criteria. Clinical success (primary outcome) was defined as simultaneous Type A for restoration integrity, marginal adaptation, and absence of secondary caries.
c Fisher's exact test was used for between-group comparisons. Bold values indicate significance after Bonferroni correction (alpha < 0.017).
d Secondary caries (absent) indicates patients without secondary caries.
Table 3.
Intragroup Time Trends (Cochran Q Test) (N = 40 per Group) a
| Indicator and Group | 3-Month | 12-Month | 24-Month | Cochran Q b | P-Value c |
|---|---|---|---|---|---|
| Clinical success | |||||
| SSC | 40/40 (100.0) | 40/40 (100.0) | 39/40 (97.5) | 2.00 | 0.368 |
| SonicFill | 40/40 (100.0) | 34/40 (85.0) | 32/40 (80.0) | 13.00 | 0.002 |
| Layered resin | 39/40 (97.5) | 32/40 (80.0) | 30/40 (75.0) | 14.89 | 0.001 |
a Values are expressed as n/N (%). Abbreviations: SSC, stainless steel crown; N, total number of patients per group.
b Cochran's Q test was used to compare proportions across three related time points (3, 12, and 24 months) within each group; a significant P value (< 0.05) indicates time-dependent deterioration.
c Clinical success was defined as simultaneous achievement of Type A in all three dimensions (restoration integrity, marginal adaptation, and absence of secondary caries) for the same patient, corresponding to the "worst-tooth principle" applied at the patient level. Numerator (n) represents patients with clinical success; denominator (N = 40) represents the total number of patients in the group.
4.1. Baseline Characteristics
Baseline patient characteristics are shown in Table 1.
4.2. Restoration Performance
At 3 months, outcomes were comparable across groups (P > 0.05). Subsequently, significant divergence emerged. The SSC group maintained superior performance throughout. At 24 months, marginal adaptation was 97.5% (39/40) in the SSC group versus 80.0% (32/40) in the SonicFill group and 75.0% (30/40) in the layered resin group; restoration integrity was 100.0% (40/40) versus 80.0% and 77.5%, respectively; and secondary caries was 2.5% (1/40) versus 17.5% (7/40) and 20.0% (8/40), respectively (all P < 0.05). The resin groups showed progressive deterioration over time (time trends, P < 0.05).
4.3. Effect Estimates at 24 Months
To quantify the magnitude and clinical relevance of between-group differences, effect estimates for the primary outcome at the 24-month follow-up are presented in Table 4.
Table 4.
Effect Estimates for the Primary Outcome at 24 Months (N = 40/group) a
| Comparison | Success Rate n/N (%) | RD (95% CI) | RR (95% CI) | NNT | Fisher P | Bonferroni-Adjusted |
|---|---|---|---|---|---|---|
| SonicFill vs SSC | 32/40 (80.0) | 17.5% (4.2% - 30.8%) | 1.22 (1.04 - 1.43) | 5.7 | 0.029 | Not significant b |
| Layered resin vs SSC | 30/40 (75.0) | 22.5% (8.2% - 36.8%) | 1.30 (1.08 - 1.57) | 4.4 | 0.007 | Significant |
a Abbreviations: CI, confidence interval; NNT, number needed to treat; RD, risk difference; RR, relative risk; SSC, stainless steel crown; vs, versus.
b P = 0.029 did not reach the Bonferroni threshold of 0.017 but represents a clinically meaningful difference.
4.4. Multivariable Regression Analysis
To identify independent predictors of restoration success and adjust for potential confounding factors, a multivariable logistic regression analysis was performed, as shown in Table 5.
Table 5.
Multivariable Logistic Regression Analysis of Restoration Success at 24 Months (N = 120) a
| Variables | Reference Group | aOR (95% CI) | P-Value |
|---|---|---|---|
| Restoration type | |||
| SonicFill | Stainless steel crown | 6.8 (1.4 - 33.2) | 0.017 |
| Layered resin | Stainless steel crown | 9.5 (1.9 - 47.6) | 0.006 |
| Age | Per 1-year increase | 0.92 (0.68 - 1.25) | 0.580 |
| Sex | Female vs male | 1.12 (0.41 - 3.08) | 0.820 |
| Caries extent | |||
| Two-surface | Single-surface | 1.25 (0.28 - 5.62) | 0.770 |
| Multiple-surface | Single-surface | 1.45 (0.35 - 6.02) | 0.610 |
| Tooth position | Mandibular vs maxillary | 1.35 (0.52 - 3.51) | 0.540 |
4.5. Failure Mode Analysis
At 24 months, Group A (SSC) had 1 failure (2.5%), consisting of marginal staining with secondary caries and requiring observation only. Group B (SonicFill) had 8 failures (20.0%), all involving marginal deterioration; 7 of these failures had secondary caries (87.5%). Group C (layered resin) had 10 failures (25.0%); 8 had secondary caries (80.0%), and 2 had structural failures (20.0%). Among resin failures, 83.3% (15/18) required re-restoration.
4.6. Functional Outcomes and Parental Satisfaction at 12 Months
Functional outcomes and parental satisfaction were assessed at the 12-month follow-up to evaluate patient-centered and caregiver-reported aspects of treatment performance, as summarized in Table 6.
| Group | Occlusal Function Score | Satisfaction Rate | Dissatisfaction Rate |
|---|---|---|---|
| SSC | 95.00 ± 2.50 | 38/40 (95.0) | 2/40 (5.0) |
| SonicFill | 90.00 ± 3.50 | 32/40 (80.0) | 8/40 (20.0) |
| Layered resin | 85.00 ± 4.50 | 30/40 (75.0) | 10/40 (25.0) |
| P-value | < 0.001 | 0.089 |
a Values are expressed as n/N (%) or mean ± SD. SSC, stainless steel crown; SD, standard deviation.
b Post hoc (Tukey honest significant difference): SSC vs SonicFill, P < 0.001; SSC vs layered resin, P < 0.001; SonicFill vs layered resin, P < 0.001. Occlusal function was assessed with a 100-point scale evaluating masticatory efficiency, occlusal harmony, patient comfort, and daily life impact (12). Satisfaction was assessed with a 10-item questionnaire converted to a 100-point scale: very satisfied (≥ 85), satisfied (60 - 84), and dissatisfied (< 60) (13). Post hoc comparisons were performed using Tukey honest significant difference for occlusal function (all pairwise P < 0.001), and the Kruskal-Wallis H test was used for satisfaction (H = 4.832; P = 0.089).
4.7. Sensitivity Analyses
Tooth-level GEE analysis (intraclass correlation coefficient = 0.35; exchangeable correlation; robust standard errors) confirmed the patient-level findings. Stainless steel crowns showed significantly higher success than both resin groups (both P < 0.001). The adjusted OR for SSCs versus SonicFill was 9.2 (95% CI, 1.8 - 47.3).
A stratified analysis by caries extent among patients with multi-surface lesions only (n = 104) showed success rates of 97.1% for SSCs, 79.4% for SonicFill, and 73.5% for layered resin (P = 0.003), consistent with the main analysis.
A model sensitivity analysis including BMI showed changes of less than 10% in effect estimates (SonicFill aOR, 6.8 to 7.2; layered resin aOR, 9.5 to 10.1), indicating robustness.
5. Discussion
To our knowledge, this study provides one of the few clinical comparisons of three coronal restorations after RCT in primary molars under GA and represents the first such comparison in a Chinese tertiary pediatric healthcare setting. The main finding was that SSCs achieved 97.5% success at 24 months, significantly outperforming SonicFill (80.0%) and layered resin (75.0%), which is consistent with previous outpatient studies (5, 14).
From a materials science perspective, the approximately 20% absolute risk reduction with SSCs challenges the paradigm that moisture control is the primary determinant of resin restoration failure. Material mechanical properties, including elastic modulus, wear resistance, and compressive strength, are paramount; moisture control is a modifier rather than a determinant (15). SonicFill's early success (100% at 3 months) benefited from the moisture isolation provided by GA, but its decline to 80% at 24 months reflects inherent polymerization shrinkage (1.5% - 2.2%) (16, 17) and elastic mismatch with dentin (18). The poorer performance of layered resin (75.0%) confirms its technique sensitivity under GA time constraints (7, 16). Recent evidence on the fracture resistance of bulk-fill composites supports these mechanical limitations (19).
Outpatient studies emphasize moisture control; however, under the ideal moisture isolation provided by GA, we still observed high resin failure rates, suggesting that material selection in GA should prioritize mechanical durability over ease of handling. Professional attitudes toward the use of local anesthesia in children under GA vary, affecting optimization of GA-based dental care (20). Failure mode analysis showed that resin failures often required re-intervention (83.3%), whereas SSC failures were minor (marginal staining), supporting the use of “low-maintenance” restorations in GA settings (21).
Considering the high costs of GA re-treatment, including re-anesthesia risk, parental work absence, and transportation (22), the “single-visit definitive treatment” advantage of SSCs likely confers superior cost-effectiveness. Parental satisfaction data show that parents prioritize durability over aesthetics (19), supporting SSCs as the default option in GA settings. Layered resin should be used cautiously because of its 25.0% failure rate, whereas SonicFill may serve as a short-term alternative (≤ 1 year) with monitoring (6).
5.1. Limitations
This study has several limitations. Its retrospective design may have introduced selection bias, although this risk was mitigated by consecutive sampling and baseline comparability. The single-center setting and use of a single expert operator limit generalizability. The 2-year follow-up may not capture the full restoration lifecycle. Bonferroni correction placed the SSC-versus-SonicFill comparison at marginal non-significance (P = 0.029 vs the threshold of 0.017), although the effect size remained clinically meaningful. Random balanced sampling from 165 to 120 patients, while ensuring statistical efficiency, may affect generalizability to the full eligible cohort; however, baseline comparability supports validity. Randomized controlled trials with longer follow-up are needed.
5.2. Conclusions
Stainless steel crowns are the preferred restoration for primary molars after RCT under GA, with a 2-year success rate of 97.5%, which was superior to that of resin restorations.
SonicFill may serve as a short-term alternative (≤ 1 year) with close monitoring.
Layered resin should be used cautiously in GA because of its high failure rate and technique sensitivity.
Material mechanical properties, rather than moisture control, determine long-term success under GA.