
1. Background
Celiac disease is a genetic, autoimmune disease caused by the oral intake of gluten, a protein found in wheat, barley and rye. The disease can manifest itself in quite different clinical manifestations at any stage of life. Growth and development retardation is one of the major complications of childhood celiac disease. If the disease presents with typical features of malabsorption and positive celiac serology, the suspicion and diagnosis is not difficult; but in the absence of gastrointestinal or classical symptoms the diagnosis may be tricky. For that reason defining some other clinical characteristics of celiac disease may be helpful at least to suspect the disease and may facilitate the diagnosis (1-9).
Since craniofacial anthropometry and morphometric measurements are affected by genetic, embryogenic and environmental factors, these measurements are used in determination of variations and medical problems associated with the development (7, 10-17). Although growth retardation is a well-known, common finding in children with celiac disease, the extent to which craniofacial development is affected is not known clearly (16). In literature there are only few publications about the craniofacial morphometric features of children with celiac disease, and the parameters investigated in these publications are also limited (7, 16, 18).
2. Objectives
The aim of this study was to examine the craniofacial morphologic features of children with celiac disease and to investigate the presence of specific features in this disease.
3. Methods
Totally 100 celiac patients between the ages of 3 and 17 years who were diagnosed with celiac disease and followed up at the outpatient clinic for at least 6 months and 100 age- and sex-matched healthy children were included in the study. Medical and family histories, physical examination findings and laboratory results of patients were extracted from the patient records. Healthy controls were selected from children without any gastrointestinal system disease or malnutrition who were admitted to the outpatient clinic due to acute illnesses. The study was approved by the Gaziantep University Medical Faculty Ethics Committee (date: 2016, number: 55). Informed consent was obtained from the parents of the children.
Photographs of the children were taken using a SLR digital camera (Nikon 300D, 24.85 mm) by one and the same person. Individuals involved in the study were photographed from the front and side faces at a distance of 150 cm. These photographs were taken at a natural head position with a standardized and reproducible orientation when looking at a distant point at eye level. The photographs were drawn together with the ruler to ensure the calibration. The photographs of the patient and control groups were mixed and the researcher had to perform a single blind study. The parameters specified on the photographs were measured with ImageJ 1.50b software. Twenty eight landmarks were identified on the photos (Figure 1 and Table 1). Using these landmarks, 41 distances were measured, 35 were from the front (Figure 2) and 6 were from the side photos (Figure 3A and Table 2), and 5 angles (Figure 3B and Table 3) were measured from the side photographs. Thirty eight anthropometric ratios were calculated (Table 4). In literature, face height has been studied in two different ways, as physiognomic and morphologic (Table 2). For this reason, in this study both physiognomic and morphologic face heights were evaluated.
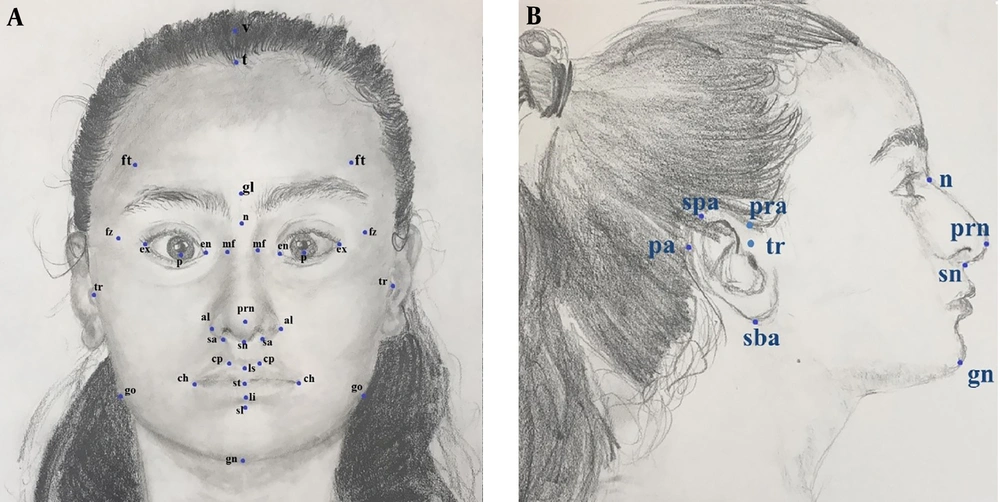
Figure 1.
Reference landmarks of the face from the front (A) and from the side (B) photos
Table 1.
Definition and Abbreviation of Anthropometric Landmarks Used in This Study
| Anthropometric Landmark | Definition |
|---|---|
| Alar, al | The most lateral point of nasal ala |
| Chelion, ch | The point at which outer ends of the upper and lower lip meet, The outer corner of the mouth where the outer edges of the upper and lower vermilions meet |
| Crista philtre, cp | The point on the crest of the philtrum, the vertical groove in the median portion of the upper lip, just above the vermilion border |
| Endocanthion, en | The point at which the inner ends of the upper and the lower eyelid meet |
| Exocantion, ex | The point at which the outer ends of the upper and the lower eyelid meet |
| Frontotemporale, ft | The most medial point on the temporal crest of the frontal bone |
| Frontozygomatic, fz | The most lateral point on the frontozygomatic suture |
| Glabella, gl | Most forward-projecting point of the forehead in the midline of the supraorbital ridges |
| Gnathion, gn | In the midline, the lowest point on the lower border of the chin |
| Gonion, go | The most lateral point at the angle of the mandible |
| Labiale inferior, li | The midpoint of the vermilion border of the lower lip |
| Labiale, ls | The midpoint of the vermilion border of the upper lip |
| Maxillofrontale, mf | The anterior lacrimal crest of the maxilla at the frontomaxillary suture |
| Nasion, n | The midpoint of the nasofrontal suture |
| Postaurel, pa | The most posterior point of the ear |
| Preaurel, pra | The most anterior point of the ear |
| Pronasale, prn | The most prominent anterior point on the nasal tip |
| Pupil, p | Lower point of circumference of pupil |
| Stomion, st | The midpoint of the labial fissure when the lips are closed naturally |
| Subalar, sa | Labial insertion points of the alar base |
| Subaurel, sba | The most inferior point of the ear |
| Sublabial, sl | The midpoint of the labiomental sulcus |
| Subnasale, sn | The midpoint at the base of the columella |
| Superaurel, spa | The most superior point of the ear |
| Tragion, tr | Located just above the tragus of the ear |
| Trichion, t | The midpoint of the hairline |
| Vertex, v | The highest point of the cranium |
| Zygion, z | The most lateral point on the zygomatic arch |
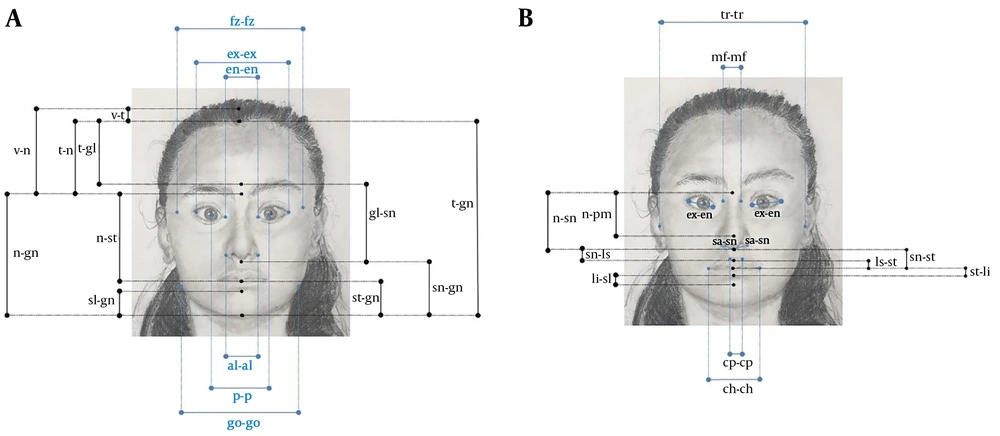
Figure 2.
A and B, Anthropometric measurements of the face from the front.
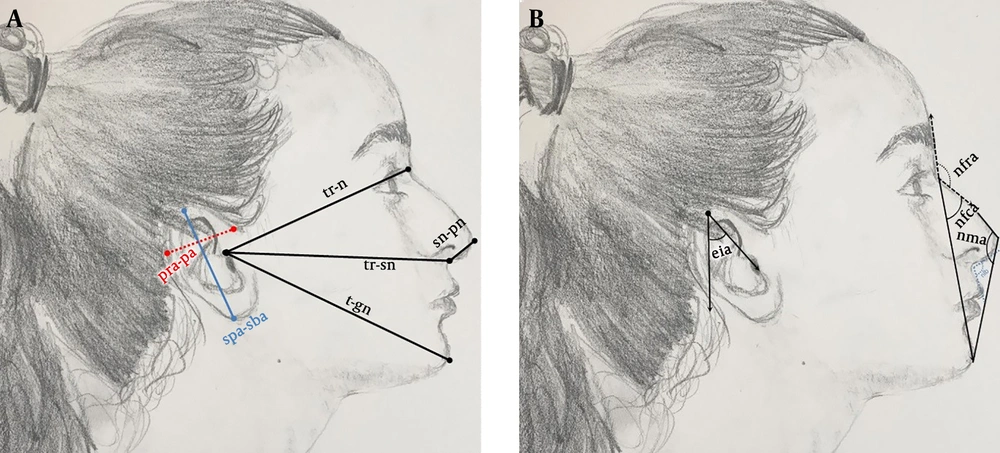
Figure 3.
A, Anthropometric measurements; B, angles of the face from the side photo.
Table 2.
Anthropometric Measurements Used in This Study
| Measurements | |
|---|---|
| Head height (between the highest point of the cranium and nasion) | v-n |
| Between the tragion and nasion | t-n |
| Calva height | v-t |
| Physiognomic face height | t-gn |
| A) Upper face height/forehead height | t-gl |
| B) Middle face height | gl-sn |
| C) Lower face height | sn-gn |
| Morphologic face height | n-gn |
| A) Upper face height | n-st |
| 1. Nose height | n-sn |
| 2. Upper lip height | sn-st |
| a. Philtrum length | sn-ls |
| b. Upper vermilion height | ls-st |
| B) Lower face height | st-gn |
| 1. Lower lip height | st-sl |
| a. Cutaneous lower lip height | li-sl |
| b. Lower vermilion height | li-st |
| 2. Chin height | sl-gn |
| Nasal bridge length | n-prn |
| Minimum frontal breadth | ft-ft |
| Supraorbital breadth | fz-fz |
| Nasal root width | mf-mf |
| Biocular width | ex-ex |
| Eye fissure width | ex-en |
| Interocular distance (intercanthal width) | en-en |
| Distance from the lower point of circumference of pupils | p-p |
| Maximum facial breadth | z-z |
| Bitragal width | tr-tr |
| Nose width | al-al |
| Nostril floor width | sa-sn |
| Philtrum width | cp-cp |
| Mouth width (labial fissure width) | ch-ch |
| Lower face width (mandible width) | go-go |
| Between the subnasale and pronasale | sn-prn |
| Between the tragion and nasion | tr-n |
| Middle face depth (maxillary depth) | tr-sn |
| Lower face depth (mandibular depth) | tr-gn |
| Ear length | spa-sba |
| Ear width | pra-pa |
Table 3.
Definition of Anthropometric Angles Used in This Study
| Angle | Definition |
|---|---|
| Nasofrontal angle, nfra | The glabella through the nasion that intersect a line drawn tangent to nasal dorsum |
| Nasofacial angle, nfca | Formed by drawing a vertical line tangent to the forehead at the glabella and tangent to the chin at pogonion (the most anterior point on the contour of the chin located midway between pogonion and menton) so that a line drawn along the nasal dorsum intersects it |
| Nasomental angle, nma | Formed by a line drawn through the nasal dorsum intersecting a line drawn from the nasal tip to soft tissue chin (pogonion) |
| Nasolabial angle, nla | Corresponds to the angle, whose vertex is the subnasale, lying in a tangent line to the nasal tip and another tangent line to the upper lip |
| Ear incline angle, eia | The angle between vertical axis and the subaurel-superaurel line |
Table 4.
Anthropometric Proportions of Children with Celiac Disease and Control Group (n = 100)a
| Parameter | Celiac Disease | Control Group | Pb | Adjusted Pc |
|---|---|---|---|---|
| t-gl/t-gn | 0.29 ± 0.04 | 0.28 ± 0.03 | 0.001d | 0.001d |
| gl-sn/t-gn | 0.37 ± 0.03 | 0.37 ± 0.02 | 0.581 | 0.375 |
| sn-gn/t-gn | 0.33 ± 0.04 | 0.35 ± 0.03 | 0.001d | 0.001d |
| n-sn/t-gn | 0.31 ± 0.03 | 0.30 ± 0.02 | 0.001d | 0.001d |
| v-t/t-gn | 0.11 ± 0.03 | 0.11 ± 0.03 | 0.832 | 0.993 |
| sn-st/t-gn | 0.12 ± 0.02 | 0.12 ± 0.01 | 0.809 | 0.415 |
| st-sl/t-gn | 0.09 ± 0.01 | 0.10 ± 0.01 | 0.071 | 0.331 |
| ls-st/sn-st | 0.25 ± 0.07 | 0.27 ± 0.06 | 0.101 | 0.221 |
| li-st/st-sl | 0.50 ± 0.13 | 0.45 ± 0.10 | 0.020d | 0.020d |
| en-en/z-z | 0.27 ± 0.02 | 0.27 ± 0.02 | 0.226 | 0.343 |
| en-en/ex-ex | 0.38 ± 0.02 | 0.38 ± 0.02 | 0.388 | 0.434 |
| ft-ft/z-z | 0.80 ± 0.05 | 0.82 ± 0.05 | 0.001d | 0.001d |
| fz-fz/z-z | 0.88 ± 0.03 | 0.86 ± 0.04 | 0.001d | 0.001d |
| go-go/z-z | 0.77 ± 0.04 | 0.77 ± 0.04 | 0.540 | 0.261 |
| ex-en (R)/z-z | 0.23 ± 0.02 | 0.22 ± 0.01 | 0.371 | 0.246 |
| ex-en (L)/z-z | 0.23 ± 0.01 | 0.22 ± 0.01 | 0.749 | 0.741 |
| al-al/z-z | 0.26 ± 0.02 | 0.27 ± 0.02 | 0.003d | 0.026d |
| ch-ch/z-z | 0.36 ± 0.03 | 0.38 ± 0.03 | 0.001d | 0.001d |
| en-en/al-al | 1.03 ± 0.09 | 1.01 ± 0.10 | 0.108 | 0.292 |
| en-en/ex-en (R) | 1.20 ± 0.11 | 1.22 ± 0.12 | 0.122 | 0.125 |
| en-en/ex-en (L) | 1.20 ± 0.11 | 1.22 ± 0.12 | 0.427 | 0.577 |
| al-al/ch-ch | 0.74 ± 0.08 | 0.72 ± 0.06 | 0.037d | 0.054 |
| ch-ch/en-en | 1.33 ± 0.15 | 1.40 ± 0.15 | 0.002d | 0.009d |
| ch-ch/ex-ex | 0.50 ± 0.04 | 0.53 ± 0.04 | 0.001d | 0.001d |
| sa-sn (R)/al-al | 0.47 ± 0.05 | 0.50 ± 0.04 | 0.001d | 0.001d |
| sa-sn (L)/al-al | 0.46 ± 0.05 | 0.50 ± 0.04 | 0.001d | 0.001d |
| cp-cp/al-al | 0.30 ± 0.05 | 0.30 ± 0.05 | 0.348 | 0.355 |
| cp-cp/z-z | 0.08 ± 0.01 | 0.08 ± 0.01 | 0.570 | 0.900 |
| cp-cp/go-go | 0.10 ± 0.02 | 0.11 ± 0.02 | 0.524 | 0.713 |
| t-n/p-p | 1.03 ± 0.15 | 1.00 ± 0.14 | 0.231 | 0.353 |
| al-al/n-sn | 0.60 ± 0.07 | 0.64 ± 0.07 | 0.001d | 0.001d |
| t-n/n-sn | 1.14 ± 0.18 | 1.13 ± 0.15 | 0.758 | 0.845 |
| z-z/t-gn | 0.72 ± 0.04 | 0.70 ± 0.05 | 0.014d | 0.041d |
| n-gn/z-z | 0.33 ± 0.03 | 0.33 ± 0.03 | 0.864 | 0.864 |
| tr-n/tr-sn | 1.06 ± 0.04 | 1.06 ± 0.05 | 0.742 | 0.206 |
| tr-sn/tr-gn | 0.95 ± 0.05 | 0.90 ± 0.05 | 0.001d | 0.001d |
| tr-n/tr-gn | 1.02 ± 0.08 | 0.96 ± 0.07 | 0.001d | 0.001d |
| spa-sba/t-gn | 0.33 ± 0.03 | 0.33 ± 0.03 | 0.864 | 0.787 |
Abbreviations: L, left; R, right.
aValues are expressed as mean ± SD.
bStudent t-test.
cAdjusted P values for age and gender
dSignificant at 0.05 level.
3.1. Statistical Analyses
The normality of distribution of continuous variables was tested by Shaphiro Wilk test. To compare the two independent groups, Student’s t-test (for continuous variables) or chi-squared test (for categorical variables) were used. To adjust the effects of age and gender on measurements, general linear models were built for each outcome. All analyses were performed by SPSS for Windows version 22.0. A two sided P value < 0.05 was defined as statistically significant.
4. Results
A total of 100 patients with celiac disease (47 female and 53 male) with a mean age of 9.29 ± 3.73 years and 100 healthy control cases (45 female and 55 male) with a mean age of 10.43 ± 3.09 years were included in the study. The mean age of the groups were significantly different (P = 0.020), but gender distribution was similar (P = 0.777).
The distances and angles measured in study participants are summarized in Table 5 while some anthropometric ratios calculated using these parameters are shown in Table 4.
| Parameter | Celiac Disease | Control Group | Pc | Adjusted Pd |
|---|---|---|---|---|
| v-n | 77.57 ± 8.49 | 79.90 ± 7.65 | 0.001e | 0.128 |
| v-t | 18.38 ± 4.09 | 19.33 ± 4.38 | 0.115 | 0.178 |
| t-gl | 48.33 ± 7.23 | 48.43 ± 7.39 | 0.922 | 0.734 |
| t-n | 58.02 ± 8.14 | 59.06 ± 8.24 | 0.370 | 0.578 |
| n-st | 70.11 ± 6.82 | 73.61 ± 4.98 | 0.001e | 0.001e |
| gl-sn | 60.82 ± 7.13 | 64.37 ± 5.25 | 0.001e | 0.001e |
| sn-gn | 54.62 ± 6.63 | 61.60 ± 5.79 | 0.001e | 0.001e |
| st-gn | 35.25 ± 5.02 | 40.78 ± 4.73 | 0.001e | 0.001e |
| t-gn | 164.20 ± 13.39 | 175.00 ± 13.06 | 0.001e | 0.001e |
| n-gn | 106.52 ± 10.52 | 114.99 ± 8.31 | 0.001e | 0.001e |
| sl-gn | 20.45 ± 3.77 | 23.60 ± 3.04 | 0.001e | 0.001e |
| ft-ft | 93.63 ± 6.56 | 100.74 ± 6.18 | 0.001e | 0.001e |
| z-z | 117.75 ± 6.59 | 122.71 ± 6.66 | 0.001e | 0.001e |
| p-p | 56.73 ± 4.39 | 59.00 ± 3.66 | 0.001e | 0.003e |
| en-en | 31.74 ± 2.89 | 33.50 ± 3.01 | 0.001e | 0.001e |
| ex-en (R) | 26.58 ± 2.11 | 27.46 ± 1.66 | 0.001e | 0.032e |
| ex-en (L) | 26.47 ± 2.04 | 27.66 ± 1.92 | 0.001e | 0.001e |
| ex-ex | 84.60 ± 5.65 | 88.68 ± 5.11 | 0.001e | 0.001e |
| fz-fz | 103.20 ± 6.23 | 105.54 ± 5.72 | 0.006e | 0.125 |
| go-go | 90.60 ± 7.46 | 93.99 ± 7.76 | 0.002e | 0.034e |
| n-sn | 51.44 ± 6.15 | 52.23 ± 4.40 | 0.297 | 0.827 |
| n-prn | 42.91 ± 5.89 | 42.38 ± 4.52 | 0.473 | 0.054 |
| al-al | 30.81 ± 3.00 | 33.22 ± 3.05 | 0.001e | 0.001e |
| mf-mf | 21.11 ± 2.17 | 18.31 ± 2.18 | 0.001e | 0.001e |
| sa-sn (R) | 14.55 ± 2.13 | 16.73 ± 2.06 | 0.001e | 0.001e |
| sa-sn (L) | 14.21 ± 2.21 | 16.56 ± 2.00 | 0.001e | 0.001e |
| sn-ls | 15.42 ± 2.29 | 15.70 ± 2.17 | 0.366 | 0.519 |
| cp-cp | 9.42 ± 1.56 | 9.95 ± 1.81 | 0.028e | 0.158 |
| ls-st | 4.90 ± 1.61 | 5.52 ± 1.32 | 0.003e | 0.016e |
| li-st | 7.52 ± 2.12 | 7.63 ± 2.01 | 0.688 | 0.639 |
| sn-st | 19.25 ± 2.40 | 20.62 ± 2.52 | 0.001e | 0.001e |
| st-sl | 15.43 ± 2.31 | 16.98 ± 2.46 | 0.001e | 0.001e |
| li-sl | 7.38 ± 2.06 | 8.56 ± 2.21 | 0.001e | 0.002e |
| ch-ch | 42.02 ± 4.43 | 46.59 ± 4.94 | 0.001e | 0.001e |
| tr-tr | 126.64 ± 7.43 | 134.19 ± 7.06 | 0.001e | 0.001e |
| sn-prn | 15.86 ± 2.49 | 17.56 ± 2.28 | 0.001e | 0.001e |
| tr-n | 99.81 ± 7.70 | 98.93 ± 7.58 | 0.428 | 0.020e |
| tr-sn | 93.80 ± 8.70 | 92.83 ± 8.88 | 0.449 | 0.009e |
| tr-gn | 98.87 ± 11.24 | 103.20 ± 9.73 | 0.005e | 0.122 |
| spa-sba | 54.28 ± 4.89 | 57.57 ± 4.32 | 0.001e | 0.001e |
| pra-pa | 36.19 ± 3.32 | 38.41 ± 3.39 | 0.001e | 0.001e |
| nfra | 142.16 ± 7.30 | 138.77 ± 7.73 | 0.002e | 0.001e |
| nfca | 37.44 ± 3.75 | 35.60 ± 3.29 | 0.001e | 0.002e |
| nma | 125.91 ± 4.15 | 127.37 ± 4.33 | 0.017e | 0.030e |
| nla | 111.99 ± 10.02 | 113.19 ± 9.82 | 0.401 | 0.236 |
| eia | 27.31 ± 5.73 | 26.59 ± 4.43 | 0.348 | 0.306 |
Abbreviations: L, left; R, right.
aValues are expressed as mean ± SD.
bThe first 41 parameters are given as millimeter, mm; the last 5 parameters are given as angle, º.
cStudent t-test.
dAdjusted P values for age and gender.
eSignificant at 0.05 level.
Physiognomic face height (t-gn), middle face height of physiognomic face height (gl-sn), lower face height of physiognomic face height (sn-gn), morphologic face height (n-gn), upper face height of morphologic face height (n-st), upper lip height (sn-st), upper vermilion height (ls-st), lower face height of morphologic face height (st-gn), lower lip height (st-sl), cutaneous lower lip height (li-sl), chin height (sl-gn), minimum frontal breadth (ft-ft), binocular width (ex-ex), right eye fissure width (ex-en), left eye fissure width (ex-en), interocular distance (intercanthal width) (en-en), distance from the lower point of circumference of pupils (p-p), maximum facial breadth (z-z), bitragal width (tr-tr), nose width (al-al), right nostril floor width (sa-sn), left nostril floor width (sa-sn), mouth width (labial fissure width) (ch-ch), lower face width (mandible width) (go-go), the distance between the subnasal and pronasal (sn-prn), ear length (spa-sba), ear width (pra-pa) and nasomental angle (nma) were determined to be statistically significantly shorter in patients with celiac disease compared with the healthy individuals (Table 5).
Nasal root width (mf-mf), the distance between the tragion and nasion (tr-n), middle face depth (maxillary depth) (tr-sn), nasofrontal angle (nfra) and nasofacial angle (nfca) were determined to be statistically significantly larger in patients with celiac disease compared with the healthy individuals (Table 5).
Among the ratios investigated, t-gl/t-gn, n-sn/t-gn, li-st/st-sl, fz-fz/z-z, z-z/t-gn, tr-sn/tr-gn, and tr-n/tr-gn were statistically significantly larger, while sn-gn/t-gn, ft-ft/z-z, al-al/z-z, ch-ch/z-z, ch-ch/en-en, ch-ch/ex-ex, right sa-sn/al-al, left sa-sn/al-al, and al-al/n-sn were statistically significantly shorter in patients with celiac disease compared with the healthy individuals (Table 4).
5. Discussion
In this study, we compared the craniofacial measurements of celiac disease patients with the control cases and found significant alterations in children with celiac disease.
Development of craniofacial structures and morphometric measurements and ratios is a complex process affected by many factors (6-8, 10-15). Due to malabsorption most prominently in proximal small intestine, celiac disease is characterized by vitamin and mineral deficiencies including calcium, copper, foliate, and zinc deficiencies (11). The data on the effects of these vitamin deficiencies in craniofacial morphologic features is limited. Arakeri et al. (2) suggested the potential influence of maternal and paternal celiac disease on the etiology of non-syndromic cleft lip and palate as an unfavorable pregnancy outcome which may be associated with folic acid malabsorption.
Standardization with the Frankfort horizontal plane is achieved in many studies with craniofacial anthropometric measurements (3, 4, 17). In profile view, Frankfort horizontal plane is the line connecting the highest point of the opening of the external auditory canal and the lowest point on the infraorbital margin (10). Frankfort horizontal plane is utilized to orient the head. This plane is “unnatural” and difficult to obtain clinically, because it is based on internal skeletal landmarks. Natural head position is of paramount importance in facial analysis due to its reproducibility and, most importantly, because it is extremely simple to obtain (5, 13). Natural head position is the standardized and reproducible position of the head when looking at a distant point at eye level. The simplest way to obtain natural head position is having the patient to look at a point on the eye’s level in the front wall (12, 13).
Both the Student t-test and the adjusted P values were determined by establishing a model to remove the effect of age and sex on the parameters evaluated between celiac disease and healthy cases (Tables 4 and 5). Thus, the results that could be incorrect in the parameters which are statistically significant in Student t-test and are meaningless in adjusted P test (v-n, fz-fz, cp-cp, tr-gn, al-al/ch-ch) and the parameters which are statistically meaningless in student t-test but significant in adjusted P test (tr-n, tr-sn) have been eliminated.
In many diseases, facial appearance is very important in diagnosis such as Cushing syndrome, Addison disease, myasthenia gravis or Horner syndrome. However, there is no generally accepted information about the facial appearance of the celiac disease at the diagnosis or later stages. The number of studies evaluating craniofacial morphometric measurements of cases with celiac disease in childhood is limited in the literature (7, 16, 18). Comparison of celiac disease patients with healthy controls regarding the distances and angles measured for determination of craniofacial morphometric parameters in the literature are shown in Tables 6 and 7. Zanchi et al. (18) stated that although changes in facial ratios attributable to celiac disease are irreversible, the condition can be avoided by early diagnosis of celiac disease. For this reason, it is very important to determine the craniofacial morphological features of celiac disease and to utilize these properties. Selimoglu et al. (16) reported that the presence of anemia is one of the factors that may be associated with face growth, and that forehead height to total height of the face ratio (t-gl/t-gn) is lower in anemic children than in others.
Table 6.
Some Anthropometric Measurements of Children with Celiac Disease and control Group Comparison with the Literature
| Children with Celiac Disease, mm | Healthy Children, mm | P Value | |
|---|---|---|---|
| n-sn | |||
| Selimoglu et al. (16) | 45.7 ± 9.0 | 37.5 ± 7.5 | < 0.0001a |
| Zanchi et al. (18) | 47.30 ± 18.0 | 53.0 ± 20.0 | 0.130 |
| Present study | 51.44 ± 6.15 | 52.23 ± 4.40 | 0.827 |
| sn-gn | |||
| Selimoglu et al. (16) | 49.0 ± 8.8 | 38.5 ± 9.3 | < 0.0001a |
| Zanchi et al. (18) | 59.0 ± 21.2 | 67.2 ± 27.0 | 0.068 |
| Present study | 54.62 ± 6.63 | 61.60 ± 5.79 | 0.001a |
| t-gn | |||
| Selimoglu et al. (16) | 154.6 ± 27.2 | 125.7 ± 23.3 | < 0.0001a |
| Zanchi et al. (18) | 168.9 ± 60.0 | 190.7 ± 74.3 | 0.080 |
| Present study | 164.20 ± 13.39 | 175.00 ± 13.06 | 0.001a |
| t-gl | |||
| Selimoglu et al. (16) | 47.5 ± 11.1 | 38.5 ± 7.7 | < 0.0001a |
| Present study | 48.33 ± 7.23 | 48.43 ± 7.39 | 0.734 |
| n-prn | |||
| Selimoglu et al. (16) | 35.1 ± 7.7 | 30.2 ± 6.4 | < 0.0001a |
| Present study | 42.91 ± 5.89 | 42.38 ± 4.52 | 0.054 |
| v-t | |||
| Selimoglu et al. (16) | 27.8 ± 8.5 | 19.2 ± 5.2 | < 0.0001a |
| Present study | 18.38 ± 4.09 | 19.33 ± 4.38 | 0.178 |
| gl-sn | |||
| Selimoglu et al. (16) | 58.0 ± 11.6 | 48.7 ± 10.2 | < 0.0001a |
| Present study | 60.82 ± 7.13 | 64.37 ± 5.25 | 0.001a |
| spa-sba | |||
| Selimoglu et al. (16) | 46.2 ± 7.5 | 36.7 ± 10.4 | < 0.0001a |
| Present study | 54.28 ± 4.89 | 57.57 ± 4.32 | 0.001a |
| ch-ch | |||
| Selimoglu et al. (16) | 39.9 ± 6.9 | 35.1 ± 7.7 | < 0.0001a |
| Present study | 42.02 ± 4.43 | 46.59 ± 4.94 | 0.001a |
| z-z | |||
| Selimoglu et al. (16) | 111.2 ± 17.5 | 88.0 ± 17.81 | < 0.0001a |
| Present study | 117.75 ± 6.59 | 122.71 ± 6.66 | 0.001a |
| al-al | |||
| Selimoglu et al. (16) | 27.6 ± 4.8 | 23.2 ± 4.9 | < 0.0001a |
| Present study | 30.81 ± 3.00 | 33.22 ± 3.05 | 0.001a |
| nfra | |||
| Selimoglu et al. (16) | 144.6 ± 10.0 | 146.0 ± 13.6 | 0.134 |
| Present study | 142.16 ± 7.30 | 138.77 ± 7.73 | 0.001a |
| nla | |||
| Selimoglu et al. (16) | 105.3 ± 15.8 | 107.0 ± 11.3 | 0.308 |
| Present study | 111.99 ± 10.02 | 113.19 ± 9.82 | 0.236 |
| en-en | |||
| Selimoglu et al. (16) | 29.8 ± 5.2 | 24.8 ± 5.4 | < 0.0001a |
| Present study | 31.74 ± 2.89 | 33.50 ± 3.01 | 0.001a |
| ex-ex | |||
| Selimoglu et al. (16) | 82.5 ± 14.4 | 70.0 ± 13.2 | < 0.0001a |
| Present study | 84.60 ± 5.65 | 88.68 ± 5.11 | 0.001a |
| ex-en | |||
| Selimoglu et al. (16) | 27.6 ± 4.7 | 23.3 ± 4.7 | < 0.0001a |
| Present study, right | 26.58 ± 2.11 | 27.46 ± 1.66 | 0.032a |
| Present study, left | 26.47 ± 2.04 | 27.66 ± 1.92 | 0.001a |
aSignificance level = 0.05
Table 7.
Some Proportions Measurements of Children with Celiac Disease and control Group Comparison with the Literature
| Children with Celiac Disease | Healthy Children | P Value | |
|---|---|---|---|
| t-gl/t-gn | |||
| Selimoglu et al. (16) | 0.31 ± 0.04 | 0.31 ± 0.04 | 0.710 |
| Present study | 0.29 ± 0.04 | 0.28 ± 0.03 | 0.001a |
| gl-sn/t-gn | |||
| Selimoglu et al. (16) | 0.37 ± 0.03 | 0.39 ± 0.04 | 0.002a |
| Present study | 0.37 ± 0.03 | 0.37 ± 0.02 | 0.375 |
| sn-gn/t-gn | |||
| Selimoglu et al. (16) | 0.32 ± 0.03 | 0.31 ± 0.04 | 0.045a |
| Zanchi et al. (18) | 0.35 ± 0.02 | 0.35 ± 0.03 | 0.760 |
| Present study | 0.33 ± 0.04 | 0.35 ± 0.03 | 0.001a |
| n-sn/t-gn | |||
| Selimoglu et al. (16) | 0.30 ± 0.02 | 0.30 ± 0.03 | 0.359 |
| Zanchi et al. (18) | 0.28 ± 0.02 | 0.28 ± 0.02 | 0.880 |
| Present study | 0.31 ± 0.03 | 0.30 ± 0.02 | 0.001a |
| spa-sba/t-gn | |||
| Selimoglu et al. (16) | 0.30 ± 0.03 | 0.29 ± 0.06 | 0.001a |
| Present study | 0.33 ± 0.03 | 0.33 ± 0.03 | 0.787 |
| v-t/t-gn | |||
| Selimoglu et al. (16) | 0.19 ± 0.07 | 0.15 ± 0.04 | 0.001a |
| Present study | 0.11 ± 0.03 | 0.11 ± 0.03 | 0.993 |
| z-z/t-gn | |||
| Selimoglu et al. (16) | 0.72 ± 0.09 | 0.70 ± 0.07 | 0.014a |
| Present study | 0.72 ± 0.04 | 0.70 ± 0.05 | 0.041a |
| en-en/z-z | |||
| Selimoglu et al. (16) | 0.27 ± 0.07 | 0.28 ± 0.05 | < 0.0001a |
| Present study | 0.27 ± 0.02 | 0.27 ± 0.02 | 0.343 |
| ex-en/z-z | |||
| Selimoglu et al. (16) | 0.25 ± 0.05 | 0.27 ± 0.04 | < 0.0001a |
| Present study, right | 0.23 ± 0.02 | 0.22 ± 0.01 | 0.246 |
| Present study, left | 0.23 ± 0.01 | 0.22 ± 0.01 | 0.741 |
| al-al/z-z | |||
| Selimoglu et al. (16) | 0.25 ± 0.06 | 0.27 ± 0.05 | < 0.0001a |
| Present study | 0.26 ± 0.02 | 0.27 ± 0.02 | 0.026a |
| ch-ch/z-z | |||
| Selimoglu et al. (16) | 0.36 ± 0.08 | 0.40 ± 0.08 | < 0.0001a |
| Present study | 0.36 ± 0.03 | 0.38 ± 0.03 | 0.001a |
| t-n/n-sn | |||
| Zanchi et al. (18) | 1.35 ± 0.19 | 1.34 ± 0.19 | 0.920 |
| Present study | 1.14 ± 0.18 | 1.13 ± 0.15 | 0.845 |
aSignificant at 0.05 level
There are differences in the definition of forehead height in the literature. In some studies forehead height is defined as t-n/n-sn while it is defined as t-gl/t-gn in some others (7, 16, 18). In order to compare the measurements with different forehead height definitions, in present study forehead height measurements were made according to both definitions. Finizio et al. (7) reported that adult celiac disease patients had larger forehead height than the normal population and this is the first craniofacial morphological alteration that occurs in celiac disease (t-n/n-sn). For this reason, it has been suggested that scanning the forehead width through the finger. Along with other findings of celiac disease, presence of wide forehead has been suggested as a sign for diagnosis. Zanchi et al. (18) reported that the t-n/n-sn parameter in childhood celiac disease was not different from the normal population (P = 0.92). In adults, celiac patients have been reported to have a tendency for wide foreheads, but this is not regarded as a strong clinical sign for celiac disease (P = 0.083 for t-n/n-sn). Selimoglu et al. (16) reported that there was no wide forehead height in childhood celiac disease. However, unlike other studies, Selimoglu et al. (16) considered the forehead height as t-gl/t-gn. In the study of Finizio et al. (7), in which the forehead height is assessed by the t-n/n-sn parameter, a significant difference between celiac patients and healthy subjects was shown, while there was no significant difference in the study of Zanchi et al. (18) and in the present study. Selimoglu et al. (16), who defined forehead height as t-gl/t-gn reported that there was no significant difference between celiac patients and healthy individuals, while there was a significant difference in our study in this ratio. Regarding the data in previous literature and the results of this study, it is thought that large forehead height cannot be regarded as a symptom in celiac disease. Although there was no statistically significant difference in n-sn value in present study and the study of Zanchi et al. (18), Selimoglu et al. (16) reported statistically significantly larger n-sn values in celiac disease patients. While there was a significant difference regarding the sn-gn and t-gn values in the present study in favor of control group, Selimoglu et al. (16) reported a statistically significant difference in favor of the celiac group but Zanchi et al. (18) did not determine any significant differences between the two groups. In the present study, there was no statistically significant difference in the parameters of t-gl, n-prn, v-t and spa-sba of the two groups. Selimoglu et al. (16) reported a significant difference in favor of celiac disease patients regarding these parameters. In the present study, significant differences were found in the parameters of gl-sn, ch-ch, z-z, al-al, en-en, ex-ex and ex-en in favor of control group. Selimoglu et al. (16) found significant differences in these parameters in favor of celiac group. In the present study, there was a significant difference in nfra measurement in favor of celiac patients, while Selimoglu et al. (16) found no significant difference. There was no significant difference between the two groups regarding nla measurements in the present study and the study of Selimoglu et al. (16) (Table 6).
In the present study, there was no statistically significant difference between the two groups regarding the rate of gl-sn/t-gn while Selimoglu et al. (16) showed a significant difference in favor of control group. In the present study, there was a significant difference regarding the sn-gn/t-gn ratio in favor of control group; Selimoglu et al. (16) found a significant difference in favor of celiac disease group, but Zanchi et al. (18) did not show any significant difference between two groups. In the present study, there was a significant difference regarding the n-sn/t-gn ratio in favor of celiac group; Selimoglu et al. (16) and Zanchi et al. (18) did not show any significant difference between two groups. In the present study, there was no difference between two groups in the ratios of spa-sba/t-gn and v-t/t-gn, while Selimoglu et al. (16) reported a significant difference in favor of celiac patients group. In the present study and in the study of Selimoglu et al. (16) there was a significant difference regarding z-z/t-gn ratio in favor of celiac group while there was significant differences regarding al-al/z-z and ch-ch/z-z ratios in favor of control group. Although there was no statistically significant difference determined in the present study regarding en-en/z-z and ex-en/z-z ratios between two groups, Selimoglu et al. (16) reported a significant difference in favor of control group. In the present study and in the study of Selimoglu et al. (16) there was no significant difference regarding t-n/n-sn ratio between two groups (Table 7).
There are some limitations of this study that should be mentioned. First is the condition of gluten free diet (GFD) in those patients. All of our patients were under GFD for at least 6 months; but we don’t know the adherence of our patients to the GFD. As we don’t clearly know the effects of celiac disease on craniofacial morphological features, we also do not know the effects of GFD on these features. For that reason, prospective studies are warranted investigating the effects of GFD on those features with long follow-up periods. Another limitation of the study is that the measurements were based on two dimensional photographs. However, in recent years, three dimensional imaging modalities have been defined which may provide more data on craniofacial morphological features of participants (14). Although all measurements were performed by one and the same person, possibility of incorrect measurement depending on the measuring person should also be considered as another limitation.
5.1. Conclusions
We analyzed the craniofacial morphometric measurements of children with celiac disease and determined significant alterations in those parameters when compared with healthy controls. However, although there are only a few studies in literature evaluating these parameters in celiac patients, the data reported in those studies are not consistent with each other. For that reason, we cannot conclude whether a morphological feature is directly associated with celiac disease in children. Further prospective studies with longer follow-up periods are warranted to determine the effects of celiac disease on craniofacial morphological measurements.