
1. Background
In genetically susceptible individuals, dietary gluten triggers the immune-mediated small-intestinal injury characteristic of celiac disease (CD) (1). Although gastrointestinal involvement is a central feature of CD, the disease is increasingly recognized as a multisystem disorder, particularly in the pediatric population (2). Its worldwide prevalence is estimated at approximately 1%, with considerable variation according to the population studied, geographic setting, and diagnostic approach (3).
In children, the clinical consequences of CD may extend beyond the gastrointestinal tract to include impaired growth, nutritional deficiencies, impaired bone health, and dermatologic and other extraintestinal manifestations (2, 4, 5). A gluten-free diet (GFD) is the main treatment for CD, and adherence has been associated with better health-related quality of life in affected children (6). Potential cardiovascular involvement has also received increasing attention. Inflammatory activity, oxidative stress, nutritional disturbances, and autoimmune mechanisms have been proposed as possible contributors to cardiac involvement (7, 8), although much of the mechanistic evidence is derived from conditions other than pediatric CD.
Noninvasive electrocardiographic (ECG) assessment may help characterize subtle alterations in cardiac electrical activity in individuals with CD (9). Previous investigations have focused on indices reflecting ventricular repolarization and atrial conduction, including QT-related measures, P-wave dispersion (PWd), and T-wave peak-to-end (Tp-e) parameters (10, 11). Pediatric studies have likewise reported differences in several of these indices among children with CD (12, 13); however, their clinical and prognostic significance remains uncertain.
2. Objectives
We compared measures of cardiac electrical and systolic function between pediatric patients with CD and healthy controls. Within the CD group, we also examined the independent associations of disease duration and current GFD adherence with these measures.
3. Methods
3.1. Study Design and Population
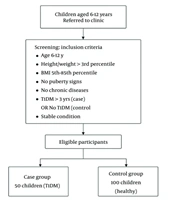
Between September 2024 and August 2025, children with CD and healthy controls were enrolled at a pediatric referral center in southern Iran for this analytical cross-sectional study.
Eligible patients were 4 - 14 years old and had a definitive diagnosis of CD established at the initial diagnostic evaluation on the basis of the relevant clinical presentation, positive celiac-specific serology (anti-tissue transglutaminase immunoglobulin A [IgA] and/or anti-endomysial antibodies), and duodenal histopathology showing Marsh grade 3a or higher. Disease duration was recorded in months and represented the interval between the initial confirmed CD diagnosis and enrollment in the study.
Participants in either group were excluded on the basis of the following criteria: active inflammatory, systemic, and/or chronic disease; congenital or acquired heart disease; treatment with medications that could affect cardiac electrophysiology (e.g., beta-blockers or antiarrhythmic agents); comorbid endocrine or autoimmune conditions (e.g., diabetes mellitus, thyroid disease, or systemic lupus erythematosus); and inability to undergo ECG or echocardiographic evaluation. Given the known effects of anemia and thyroid disorders on heart rate, we treated these conditions as exclusion criteria to minimize their potential influence on cardiac outcomes.
Healthy controls were typically developing children and adolescents who presented for routine well-child visits to the general pediatrics clinic. We randomly selected controls from the daily outpatient registry to match the CD group by age and sex at an approximately 1:1 ratio.
3.2. Operational Definitions
Heart rate (HR), in beats per minute (bpm), was calculated as HR = 60/R-R, with the R-R interval expressed in seconds. The QT interval extended from the onset of the QRS complex to the end of the T wave. For each 12-lead recording, QTmax and QTmin denoted the longest and shortest QT intervals, respectively, and QT dispersion (QTd) was calculated as QTmax minus QTmin.
The heart-rate-corrected QT interval (QTc) was calculated using Bazett’s formula (QTc = QT/√RR). We selected this approach because of its widespread use in pediatric electrophysiological research and its usefulness for comparison with previously published studies. We recognize that Bazett correction may produce higher QTc estimates at faster heart rates, particularly in children; therefore, we obtained recordings under standardized resting conditions and interpreted the results with this limitation in mind.
We quantified Tp-e as the interval from the peak to the end of the T wave. We then derived the corresponding Tp-e/QT and Tp-e/QTc ratios from these measurements.
For P-wave assessment, we measured the duration from the initial departure from the isoelectric baseline to the point at which the waveform returned to baseline. We designated the shortest and longest values across the 12 ECG leads as Pmin and Pmax, respectively. P-wave dispersion was calculated as Pmax minus Pmin.
3.3. Data Sources and Measurement Methods
We used a self-developed checklist to collect demographic and clinical information, including age, sex, Body Mass Index (BMI), ECG findings, medical history, weight, height, and medication use. The Department of Pediatrics reviewed the checklist for appropriateness of its content before data collection.
We assessed GFD adherence by parental self-report (or patient self-report when appropriate) during the study visit and recorded it as a dichotomous variable (adherent/nonadherent) based on adherence at the time of evaluation. For regression analyses, we coded GFD adherence as 1 (adherent) and 2 (nonadherent).
The primary ECG outcomes were QT, QTc, QTd, Tp-e, the Tp-e/QT and Tp-e/QTc ratios, PWd, and HR. Echocardiographic assessment focused on left ventricular systolic function.
All children underwent standard 12-lead ECG recording with a Yasham 635 electrocardiograph (Yasham Medical Equipment Company, Iran). The recording settings included a sampling rate of 500 Hz, a bandpass filter of 0.05 - 150 Hz, calibration of 10 mm/mV, and a paper speed of 25 mm/s. Participants remained supine in a quiet setting free from electrical noise. Electrode placement followed standard American Heart Association recommendations.
A single experienced pediatric cardiologist performed all ECG measurements manually under standardized conditions. We measured each parameter three times and used the mean value for the final analysis to reduce measurement variability. We did not perform a formal intraobserver reliability analysis using an intraclass correlation coefficient (ICC), and raw repeated-measures reliability data were unavailable for retrospective ICC calculation. We acknowledge this limitation in the Discussion.
We performed echocardiography using a Siemens Acuson Juniper echocardiography system (Siemens Healthineers, Germany) with an 8V3 probe. We positioned patients according to age and body size, either in the left lateral decubitus or supine position.
Left ventricular ejection fraction (LVEF) was calculated using both the modified Simpson biplane method and M-mode. The biplane calculation used apical four-chamber and two-chamber views and followed American Society of Echocardiography recommendations. For M-mode, left ventricular end-diastolic and end-systolic dimensions were obtained in the parasternal long-axis view.
The same pediatric cardiologist performed the echocardiographic measurements, and we averaged three consecutive measurements for analysis.
3.4. Risk of Bias
We minimized selection bias by applying uniform eligibility criteria to both groups and matching controls to patients with CD by age and sex. We reduced measurement bias by using standardized ECG and echocardiographic protocols, having a single experienced pediatric cardiologist perform the measurements, and averaging three repeated measurements. We addressed potential confounding by reporting and comparing age, sex, and BMI between groups and by adjusting multivariable regression analyses for age, sex, and BMI.
3.5. Statistical Analysis
Analyses were performed using SPSS version 26. Distributional assumptions were evaluated using the Shapiro–Wilk test and by examining histograms and normal Q-Q plots. Most continuous measures departed from normality; therefore, comparisons between groups primarily used the Mann–Whitney U test, whereas the independent-samples t-test was used for measures with approximately normal distributions. Descriptive summaries included the mean ± SD and/or median (IQR), as appropriate. For outcomes compared using the Mann–Whitney U test, interpretation emphasized the median (IQR), while the mean ± SD was also provided for descriptive completeness.
No data were missing; therefore, no imputation procedures were required.
We performed multivariable linear regression analyses only among patients with CD (N = 52). We constructed two separate sets of adjusted linear regression models. In the first set, disease duration (months) was the exposure of interest; in the second, self-reported GFD adherence was the exposure of interest. Each electrocardiographic or echocardiographic parameter was analyzed as a separate dependent variable. Each model was adjusted for age, sex, and BMI.
Disease duration reflects cumulative disease burden, whereas GFD adherence represents a modifiable therapeutic exposure; therefore, these variables were analyzed in separate models. This approach also reduced model complexity and improved the stability of regression estimates given the relatively modest sample size of the CD subgroup.
Regression results were reported as the unstandardized coefficient (B) with its 95% confidence interval (CI), the standardized coefficient (β), and the P value. Variance inflation factors (VIFs), R2, and adjusted R2 were also reported. Electrocardiographic time measurements were stored in seconds in SPSS and converted to milliseconds for reporting in the text and tables.
A two-sided P value < 0.05 was considered statistically significant.
3.6. Sample Size and Determination Method
An a priori calculation to compare two independent means used parameters from Demircan et al. (13). With an expected mean difference (Δ) of 0.015, group standard deviations of 0.034 and 0.030, a two-sided α of 0.05, and 80% power, the required sample size was approximately 72 participants in each group.
Enrollment was constrained by the number of patients who met the eligibility criteria during the recruitment period. All available eligible participants were included, yielding 52 children with CD and 50 healthy controls. This shortfall relative to the planned sample may have limited the detection of modest group differences and is recognized as a study limitation.
3.7. Ethical Considerations
The relevant institutional ethics committee approved the study (IR.HUMS.REC.1403.189), which was conducted in accordance with the ethical principles of the Declaration of Helsinki. Before enrollment, written informed consent was obtained from each participant’s parent or legal guardian. All participating children and adolescents also provided assent appropriate to their age and level of understanding. Participant information remained confidential and was used only for research.
4. Results
Of the 102 participants, 52 had CD and 50 were healthy controls. Males accounted for 48% of the sample and females for 52%. Neither sex distribution (Pearson’s χ2 = 0.616, P = 0.432) nor age (P = 0.239) differed significantly between the groups.
Body weight was lower in the CD group (P = 0.045). Height and BMI were also lower, although these differences were not statistically significant (P = 0.094 and P = 0.055, respectively; Table 1). Among the 52 children with CD, 47 (90.4%) were classified as adherent to the GFD and 5 (9.6%) as nonadherent.
Table 1.
Demographic and Anthropometric Characteristics of Children with Celiac Disease and Healthy Controls a
| Variables | CD (n = 52) | CD | Controls (n = 50) | Controls | P Value |
|---|---|---|---|---|---|
| Age (y) | 8.10 ± 2.69 | 8.0 (4.0) | 8.60 ± 2.35 | 8.5 (3.0) | 0.239 |
| Weight (kg) | 24.15 ± 8.30 | 21.0 (12.0) | 26.84 ± 7.64 | 25.8 (12.3) | 0.045 |
| Height (cm) | 125.42 ± 14.82 | 120.5 (21.5) | 128.91 ± 9.94 | 126.0 (18.0) | 0.094 |
| BMI (kg/m2) | 14.80 ± 2.07 | 14.7 (3.1) | 15.84 ± 2.52 | 15.4 (3.1) | 0.055 |
| Gender | 0.432 | ||||
| Male | 23 (44.2) | — | 26 (52.0) | — | |
| Female | 29 (55.8) | — | 24 (48.0) | — |
a Values are expressed as mean ± SD, median (IQR) or No. (%). two-sided P < 0.05 was considered significant. Abbreviations: BMI, Body Mass Index; CD, celiac disease; IQR, interquartile range; SD, standard deviation.
Mean heart rate was 94.14 ± 9.83 bpm in the CD group and 85.94 ± 7.52 bpm in controls (P < 0.001). The groups also differed in several ECG measures: QTmin, QTcmin, Tp-e max, Tp-e/QTmax, Tp-e/QTcmax, and PWd were higher in the CD group, whereas QTd, QTcmax, and Pmin were lower; the reduction in QTcmax was slight. No statistically significant differences were found for QTmax, Tp-e min, Tp-e/QTmin, Tp-e/QTcmin, or Pmax (Table 2).
Table 2.
Comparison of Electrocardiographic and Cardiac Functional Parameters Between Children with Celiac Disease and Healthy Controls a
| Variables | CD (n = 52) | Controls (n = 50) | P Value | 95% CI for Mean Difference (CD − Control) |
|---|---|---|---|---|
| QTmin (ms) | 360 ± 20 | 340 ± 20 | < 0.001 | 12 to 28 |
| QTmax (ms) | 390 ± 20 | 390 ± 20 | 0.776 | −8 to 8 |
| QTd (ms) | 30 ± 10 | 50 ± 10 | < 0.001 | −24 to −16 |
| QTcmin (ms) | 380 ± 10 | 360 ± 20 | < 0.001 | 14 to 26 |
| QTcmax (ms) | 400 ± 10 | 410 ± 20 | 0.038 | −16 to −4 |
| Tp-e min (ms) | 60 ± 10 | 60 ± 10 | 0.791 | −4 to 4 |
| Tp-e max (ms) | 80 ± 10 | 70 ± 10 | < 0.001 | 6 to 14 |
| Pmin (ms) | 60 ± 10 | 70 ± 10 | 0.009 | −14 to −6 |
| Pmax (ms) | 90 ± 10 | 90 ± 10 | 0.093 | −4 to 4 |
| PWd (ms) | 30 ± 10 | 20 ± 10 | < 0.001 | 6 to 14 |
| Tp-e/QTmin | 0.16 ± 0.02 | 0.16 ± 0.03 | 0.660 | −0.010 to 0.010 |
| Tp-e/QTmax | 0.20 ± 0.03 | 0.18 ± 0.02 | < 0.001 | 0.010 to 0.030 |
| Tp-e/QTcmin | 0.15 ± 0.02 | 0.15 ± 0.02 | 0.243 | −0.008 to 0.008 |
| Tp-e/QTcmax | 0.19 ± 0.03 | 0.17 ± 0.02 | < 0.001 | 0.010 to 0.030 |
| HR (bpm) | 94.14 ± 9.83 | 85.94 ± 7.52 | < 0.001 | 4.81 to 11.59 |
| LVEF, M-mode (%) | 67.37 ± 3.08 | 69.28 ± 2.58 | 0.002 | −3.01 to −0.81 |
| LVEF, Simpson’s biplane method (%) | 65.61 ± 2.75 | 68.20 ± 2.34 | < 0.001 | −3.60 to −1.58 |
a Values are expressed as mean ± SD unless otherwise indicated. Between-group comparisons used the Mann–Whitney U test; two-sided P < 0.05 was considered significant. Abbreviations: bpm, beats per minute; CD, celiac disease; CI, confidence interval; HR, heart rate; LVEF, left ventricular ejection fraction; Pmin, minimum P-wave duration; Pmax, maximum P-wave duration; PWd, P-wave dispersion; QTc, corrected QT interval; QTd, QT dispersion; SD, standard deviation; Tp-e, T-peak to T-end interval.
Left ventricular ejection fraction was lower in the CD group using both methods: M-mode values were 67.37 ± 3.08% versus 69.28 ± 2.58% (P = 0.002), and Simpson’s biplane values were 65.61 ± 2.75% versus 68.20 ± 2.34% (P < 0.001). These modest differences fell within the physiological range (Table 2).
4.1. Celiac Disease Duration
In the CD subgroup, none of the cardiac outcomes showed a statistically significant association with disease duration in models adjusted for age, sex, and BMI (all P > 0.05). For QTmin, the standardized coefficient was β = 0.329 (P = 0.083). Although the overall models for HR and both LVEF measures were statistically significant, the coefficient for disease duration was not significant in these models (Table 3).
Table 3.
Association Between Celiac Disease Duration and Electrocardiographic and Echocardiographic Parameters in Multivariable Linear Regression Analysis a
| Outcome | B (95% CI) | β | P Value | VIF | R2 | Adjusted R2 |
|---|---|---|---|---|---|---|
| HR (bpm) | 0.081 (−0.124 to 0.286) | 0.068 | 0.432 | 1.740 | 0.801 | 0.784 |
| LVEF, M-mode (%) | 0.029 (−0.077 to 0.135) | 0.078 | 0.585 | 1.740 | 0.455 | 0.409 |
| LVEF, Simpson’s biplane method (%) | 0.037 (−0.061 to 0.134) | 0.110 | 0.454 | 1.740 | 0.426 | 0.377 |
| QTmin (ms) | 0.760 (−0.103 to 1.623) | 0.329 | 0.083 | 1.740 | 0.068 | −0.012 |
| QTmax (ms) | 0.500 (−0.444 to 1.443) | 0.202 | 0.292 | 1.740 | 0.030 | −0.052 |
| QTd (ms) | −0.073 (−0.539 to 0.392) | −0.060 | 0.753 | 1.740 | 0.037 | −0.045 |
| QTcmin (ms) | 0.459 (−0.176 to 1.094) | 0.273 | 0.153 | 1.740 | 0.050 | −0.031 |
| QTcmax (ms) | 0.178 (−0.476 to 0.832) | 0.105 | 0.586 | 1.740 | 0.010 | −0.074 |
| Tp-e min (ms) | −0.006 (−0.365 to 0.353) | −0.007 | 0.972 | 1.740 | 0.028 | −0.055 |
| Tp-e max (ms) | 0.094 (−0.475 to 0.662) | 0.063 | 0.743 | 1.740 | 0.016 | −0.067 |
| Tp-e/QTmin | −0.000325 (−0.001282 to 0.000632) | −0.129 | 0.498 | 1.740 | 0.043 | −0.039 |
| Tp-e/QTmax | −0.000018 (−0.001517 to 0.001481) | −0.005 | 0.981 | 1.740 | 0.008 | −0.077 |
| Tp-e/QTcmin | −0.000153 (−0.001047 to 0.000742) | −0.065 | 0.733 | 1.740 | 0.018 | −0.065 |
| Tp-e/QTcmax | 0.000132 (−0.001357 to 0.001621) | 0.034 | 0.859 | 1.740 | 0.015 | −0.068 |
| Pmin (ms) | −0.065 (−0.328 to 0.198) | −0.094 | 0.620 | 1.740 | 0.038 | −0.044 |
| Pmax (ms) | −0.117 (−0.418 to 0.184) | −0.148 | 0.438 | 1.740 | 0.030 | −0.053 |
| PWd (ms) | −0.078 (−0.381 to 0.226) | −0.096 | 0.609 | 1.740 | 0.054 | −0.026 |
a Models included children with CD and were adjusted for age, sex, and BMI; two-sided P < 0.05 was considered significant. Abbreviations: B, unstandardized regression coefficient; BMI, body mass index; CI, confidence interval; ECG, electrocardiographic; HR, heart rate; LVEF, left ventricular ejection fraction; Pmin, minimum P-wave duration; Pmax, maximum P-wave duration; PWd, P-wave dispersion; QTc, corrected QT interval; QTd, QT dispersion; R2, coefficient of determination; Tp-e, T-peak to T-end interval; VIF, variance inflation factor; β, standardized regression coefficient.
4.2. Gluten-Free Diet Adherence
Separate analyses adjusted for age, sex, and BMI found no statistically significant association between GFD adherence and HR, LVEF, QT/QTc measures, Tp-e-based parameters, or P-wave measures (all P > 0.05). The overall HR and LVEF models were statistically significant, but the adherence coefficient was not significant in any of them (Table 4).
Table 4.
Association Between Gluten-Free Diet Adherence and Electrocardiographic and Echocardiographic Parameters in Multivariable Linear Regression Analysis a
| Outcome | B (95% CI) | β | P Value | VIF | R2 | Adjusted R2 |
|---|---|---|---|---|---|---|
| HR (bpm) | −0.058 (−4.560 to 4.445) | −0.002 | 0.980 | 1.069 | 0.798 | 0.781 |
| LVEF, M-mode (%) | −0.936 (−3.244 to 1.373) | −0.090 | 0.419 | 1.069 | 0.459 | 0.413 |
| LVEF, Simpson’s biplane method (%) | −0.416 (−2.549 to 1.718) | −0.045 | 0.697 | 1.069 | 0.421 | 0.372 |
| QTmin (ms) | 4 (−15 to 24) | 0.065 | 0.669 | 1.069 | 0.009 | −0.075 |
| QTmax (ms) | 7 (−13 to 28) | 0.108 | 0.472 | 1.069 | 0.018 | −0.066 |
| QTd (ms) | 2 (−8 to 12) | 0.052 | 0.726 | 1.069 | 0.038 | −0.044 |
| QTcmin (ms) | −4 (−18 to 10) | −0.078 | 0.606 | 1.069 | 0.013 | −0.071 |
| QTcmax (ms) | 4 (−10 to 18) | 0.088 | 0.558 | 1.069 | 0.011 | −0.073 |
| Tp-e min (ms) | −2 (−10 to 6) | −0.068 | 0.649 | 1.069 | 0.032 | −0.050 |
| Tp-e max (ms) | < 1 (−13 to 12) | −0.010 | 0.947 | 1.069 | 0.014 | −0.070 |
| Tp-e/QTmin | −0.006 (−0.027 to 0.015) | −0.085 | 0.566 | 1.069 | 0.040 | −0.042 |
| Tp-e/QTmax | −0.002 (−0.034 to 0.031) | −0.017 | 0.910 | 1.069 | 0.008 | −0.076 |
| Tp-e/QTcmin | −0.002 (−0.022 to 0.017) | −0.037 | 0.807 | 1.069 | 0.017 | −0.066 |
| Tp-e/QTcmax | −0.003 (−0.036 to 0.029) | −0.030 | 0.841 | 1.069 | 0.016 | −0.068 |
| Pmin (ms) | −2 (−8 to 3) | −0.120 | 0.420 | 1.069 | 0.046 | −0.035 |
| Pmax (ms) | −2 (−9 to 4) | −0.101 | 0.500 | 1.069 | 0.027 | −0.056 |
| PWd (ms) | 1 (−6 to 7) | 0.024 | 0.872 | 1.069 | 0.050 | −0.031 |
a Models included children with CD and were adjusted for age, sex, and BMI; GFD adherence was coded 1 = adherent and 2 = nonadherent; two-sided P < 0.05 was considered significant. Abbreviations: B, unstandardized regression coefficient; BMI, body mass index; CI, confidence interval; ECG, electrocardiogram; GFD, gluten-free diet; HR, heart rate; LVEF, left ventricular ejection fraction; Pmin, minimum P-wave duration; Pmax, maximum P-wave duration; PWd, P-wave dispersion; QTc, corrected QT interval; QTd, QT dispersion; R2, coefficient of determination; Tp-e, T-peak to T-end interval; VIF, variance inflation factor; β, standardized regression coefficient.
Overall, several ECG and systolic functional measures differed between children with CD and healthy controls. However, within the CD group, adjusted analyses identified no statistically significant associations between disease duration or current GFD adherence and the assessed cardiac outcomes.
5. Discussion
Compared with healthy controls, children with CD in this study showed modest differences in cardiac electrical measures and left ventricular systolic performance. This pattern may reflect multiple factors, including the nutritional and immune-mediated pathways proposed in previous research.
Children with CD had lower body weight, along with nonsignificant trends toward lower BMI and height. Although nutritional status was not directly evaluated in this study, these observations are consistent with the nutritional disturbances that may occur in CD. Intestinal mucosal injury can interfere with the absorption of several nutrients involved in normal cellular function and erythropoiesis, including iron, folate, and vitamin B12 (14).
The CD group had a higher heart rate and modestly lower LVEF, although LVEF remained within the physiological range. Thus, these differences do not establish overt left ventricular dysfunction. Studies in non-celiac populations have linked inflammatory processes to myocardial fibrosis (15, 16), providing indirect mechanistic context rather than direct evidence for the present findings. Conventional and tissue Doppler echocardiography have also identified subtle differences in ventricular performance in children with other cardiac or systemic disorders (17, 18); however, those populations are distinct from pediatric CD.
The repolarization findings did not show a uniform direction. QTmin and QTcmin were higher in the CD group, whereas QTd and, to a lesser extent, QTcmax were lower. Tp-e max and the Tp-e/QTmax and Tp-e/QTcmax ratios were higher. These differences describe variation in selected ECG indices; their clinical implications remain unresolved by this cross-sectional study.
The lower QTd observed in children with CD differs from patterns reported in some other clinical populations (19, 20). However, those investigations involved arrhythmogenic right ventricular cardiomyopathy and pediatric subclinical hypothyroidism rather than celiac disease; therefore, they provide indirect rather than disease-specific comparisons.
Differences in participant characteristics, disease stage, dietary behavior, and measurement procedures may help explain the varying results. Manual measurement of QT dispersion also has reproducibility limitations. Therefore, the lower QTd in this study does not establish whether arrhythmic risk is reduced or increased.
Comparisons with earlier pediatric CD studies show both agreement and divergence. Birinci et al. (12) described increases in Tp-e, Tp-e/QT, and Tp-e/QTc, along with lower measures of left ventricular systolic function, a pattern broadly compatible with our higher Tp-e-related indices and modestly lower LVEF. Demircan et al. (13) also found higher PWd and Tp-e-related indices, but their QTd result differed in direction: QTd increased in their study and decreased in ours. Differences in participant characteristics, disease status, dietary adherence, and ECG measurement methods may contribute to this discrepancy. Across these studies, findings for Tp-e-related measures and PWd appear more consistent than those for QTd, although their prognostic relevance remains uncertain (12, 13).
Regarding atrial electrical conduction, PWd was greater in the CD group. This finding may indicate increased heterogeneity of atrial conduction; however, elevated PWd alone cannot establish structural atrial remodeling or predict a future clinically significant arrhythmia. Autoimmune influences on cardiac electrophysiology represent one possible biological pathway (8), but the available mechanistic evidence is indirect and not specific to pediatric CD.
In models that included age, sex, and BMI, disease duration showed no statistically significant association with any assessed ECG or echocardiographic outcome. QTmin had the largest standardized association with duration, but this result was not statistically significant. These analyses therefore provided no evidence of an association between time since diagnosis and the measured cardiac outcomes within the CD group.
Likewise, current GFD adherence showed no independent association with the evaluated cardiac measures in the adjusted analyses. This result should not be interpreted as indicating that dietary treatment has no potential cardiovascular relevance. The lack of an observed association may instead reflect the cross-sectional design, reliance on a dichotomous self-reported measure of adherence, and, in particular, the small number of participants classified as nonadherent. Previous pediatric evidence supports the broader health-related benefits of a GFD, including improved quality of life (6).
Inflammatory, nutritional, and autoimmune processes remain biologically plausible contributors to cardiac alterations in CD, although these pathways were not directly measured in the present investigation and much of the supporting mechanistic evidence is indirect (8, 14, 15).
The systemic nature of CD is also reflected in recent clinical observations. Persistent manifestations have been described in some patients despite long-term adherence to a GFD (21). In addition, researchers have evaluated alterations in aortic elasticity in children with CD, with dietary adherence showing no significant improvement in most aortic stiffness measures except the aortic strain β index (22). Psychological difficulties and impaired quality of life have also been described in pediatric CD (23); however, we did not examine their associations with the cardiac measures assessed here.
Multiple interacting processes may contribute to cardiac findings in pediatric CD, although the present study did not directly test these mechanisms.
5.1. Limitations
The study design limits interpretation in several respects. Cross-sectional measurements cannot establish temporal ordering or causation between CD and the cardiac findings. In addition, the relatively small sample from a single center may have limited sensitivity to modest associations and the generalizability of the results to other pediatric populations.
Although eligibility criteria, group matching, and multivariable adjustment addressed important sources of confounding, unmeasured or incompletely measured factors may still have influenced the results. These include detailed nutritional status, disease duration before diagnosis, and the accuracy of dietary adherence assessment. We classified GFD adherence using a dichotomous self-reported measure, which is susceptible to recall and reporting bias. Furthermore, only five children were categorized as nonadherent; consequently, estimates from the adjusted GFD models have limited precision and should be regarded as exploratory.
Because multiple cardiac outcomes were tested without adjustment for multiplicity, some statistically significant findings may represent type I errors.
Electrocardiographic and echocardiographic measurements were obtained manually by one experienced pediatric cardiologist. We performed three measurements and averaged them to improve precision; however, we did not formally quantify intraobserver reproducibility using an ICC. Because the original repeated-measures data required for a valid retrospective reliability analysis were unavailable, we could not calculate an ICC.
Without follow-up measurements, we could not determine whether the cardiac differences persisted, progressed, or reversed, or whether their course was related to sustained or changing GFD adherence.
5.2. Research Innovation
This study provides additional pediatric data on cardiac assessment in CD, with particular emphasis on disease duration and GFD adherence as potential correlates of cardiac electrical and functional parameters.
Unlike many previous studies, which have focused mainly on adults or isolated electrocardiographic indices, this study simultaneously evaluated atrial and ventricular electrophysiological markers, including PWd and Tp-e-based indices, along with echocardiographic measures of left ventricular systolic function.
The adjusted analyses also examined disease duration and current GFD adherence as separate correlates of cardiac measures within the CD group. Neither showed a statistically significant association with the evaluated outcomes. These findings should be interpreted in light of the sample size and the limitations of the adherence measure.
5.3. Conclusions
Children with CD showed modest differences in selected ECG indices and measures of left ventricular systolic function compared with healthy controls, without evidence of overt cardiac dysfunction. Within the CD group, neither disease duration nor current GFD adherence was significantly associated with the assessed cardiac outcomes after adjustment for age, sex, and BMI. The mechanisms underlying these findings remain uncertain. Larger prospective studies with objective assessment of GFD adherence and repeated cardiac measurements are needed to determine their persistence, reversibility, and clinical significance.