
1. Background
A neurodevelopmental disorder with a multifactorial etiology, autism spectrum disorder (ASD), is characterized by a lack of social interaction and repetitive behaviors. There is currently no known effective medication to treat the primary symptoms of this disorder (1-4). According to earlier research, valproic acid (VPA) is one of the environmental causes of ASD. This medication is used to treat migraine headaches, bipolar disorder, and epilepsy. By interfering with the activity of the gamma-aminobutyric acid (GABA), dopamine, and serotonin neurotransmitter systems and blocking Na channels, it might result in neuronal inactivation (5-7). Gamma-aminobutyric acid is the primary inhibitory transmitter in the brain, and VPA raises its concentration. In addition, glutamatergic signaling is impacted by VPA. It inhibits histone deacetylase (HDAC) in a non-selective manner. Given that HDAC is essential for gene transcription, VPA might raise the risk of ASD through an epigenetic mechanism.
Valproic acid has teratogenic and embryotoxic effects and is a well-known neuroteratogen. One of the proposed mechanisms of VPA teratogenic action on the brain is the induction of epigenetic changes. This epigenetic modifier might affect humans and various animals. Several studies showed that using VPA during pregnancy in humans is related to ASD (8-11). Valproic acid exposure during embryonic development has been linked to an increased risk of ASD, according to numerous studies utilizing various animal models. Animals exposed to VPA develop a variety of neurobehavioral impairments mimicking ASD (12-22). Studies revealed that VPA might cause the canonical β-catenin signaling pathway to become excessively active in VPA-induced animal models of ASD. From lower to higher organisms, the β-catenin wingless (Wnt) signaling is largely conserved. This system is crucial for brain growth, synaptogenesis, and plasticity; as a result, any disruption in the Wnt signaling pathway is regarded as one of the pathophysiologic causes of ASD.
Wnt signaling pathway disruption has been linked to ASD and performs significant and diverse functions in neurodevelopment. Genetic data point to a potential role for gene mutation in the development of ASD in the primary players or regulators of the canonical β-catenin signaling pathway (23-25). Zebrafish are a common animal model for ASD in scientific studies nowadays. The zebrafish embryo is transparent and has a fast external development. The morphology of the nervous system and the brain of zebrafish and humans are very similar in terms of cells and signaling pathways due to the rapid development of the brain in the early days after fertilization. Zebrafish is a suitable model for behavioral research (26-28).
Numerous studies have shown neurobehavioral alterations in zebrafish larvae exposed to VPA, including anxiety and social interaction abnormalities (26-32). Valproic acid has been used in a number of studies to cause autistic-like behavior in zebrafish larvae. Zebrafish larvae exposed to 48 µM VPA by Zimmerman et al. showed altered locomotor activity, increased anxiety, and deficits in social interaction (26, 27). Zebrafish larvae subjected to chronic (20 µM) and acute (100 µM) VPA showed alterations in locomotor activity and social preference deficiencies, according to Liu et al. (27). Zebrafish larvae exposed to 75 µM VPA exhibited significant circling activity, increased anxiety, and deficiencies in social interaction, according to Dwivedi et al. (28). Zebrafish larvae exposed to 10 µM VPA showed signs of hyperactivity and anxiety, according to Joseph et al. (32).
Numerous studies have examined the impact of early developmentally administered low doses of VPA (i.e., 0.5, 0.625, and 1.5 µM) on zebrafish behavior and gene expression. These studies’ findings demonstrated that zebrafish social behavior was unaffected by VPA concentrations of 0.5 and 5µM (32, 33). The effects of VPA at 0.625 and 1 µM have been studied on gene expression. These studies omitted the behavioral test (29, 34). Finding the lowest concentration of VPA that can cause long-lasting neurobehavioral deficits with a high survival rate in zebrafish larvae is crucial because VPA has teratogenic, neurotoxic, and embryotoxic effects.
2. Objectives
Finding the lowest concentration of VPA that can cause autism-like behavior in zebrafish models and result in both an early and long-term phenotype was the main objective of the current study. A few genes associated with Wnt-catenin were investigated for their gene expression in order to examine the neurological impact of VPA.
3. Methods
3.1. Fish Husbandry and Embryo Collection
Adult wild-type AB line zebrafish (Danio rerio) were kept in groups of 10 in a 1.5-liter aquarium with a recirculating system at 28 ± 1°C and 7.5 pH, with a 14:10 light/dark cycle. Zebrafish were fed with dry food and live artemia twice a day. The embryos of zebrafish were obtained by normal spawning. In the reproductive tank, mature male and female zebrafish with a sex ratio of 2:1 were separated overnight by a transparent barrier. The next morning, the breeding barrier was removed. One hour after spawning, embryos were retrieved and incubated (20 embryos per well) at 28 ± 1°C in blue egg media (water + methylene blue) with a 14:10 light/dark cycle.
Researchers used fertilized embryos at the same developmental stage for their studies. All animal care and experimental methods were conducted in accordance with the National Institutes of Health’s standards for the care and use of animals and were approved by the Institutional Ethics Committee of Shiraz University of Medical Sciences, Shiraz, Iran (IR.SUMS.REC.1399.209).
3.2. Drug
Valproic acid was bought from Sigma-Aldrich (USA). This drug was diluted in system water to obtain multiple concentrations. The VPA solution was freshly prepared before exposing the zebrafish embryo to it.
3.3. Experimental Design
The embryos were divided at random among 7 groups (1 control and 6 VPA-treated groups). A total of 100 embryos per group were treated for 5 days with various doses of VPA (i.e., 0, 1, 5, 15, 25, 48, and 75 µM) on plates at 4 hours after fertilization (hpf). These exposure concentrations were chosen in light of previous studies (26, 28, 29, 32, 35). During exposure, blue egg media was changed daily with a new medium containing VPA, and the embryos were inspected every 24 hours under a stereomicroscope to determine survival, hatching, and abnormalities. After selecting the lowest dose of VPA, behavioral tests (i.e., open-field and inattentive behavior) were conducted between 10 a.m. and 2 p.m. on day 7 after fertilization (dpf), followed by molecular analysis. A few sets of larvae were grown to 42 days after fertilization, and tests of social interaction were conducted at 21 and 42 dpf (Figure 1).
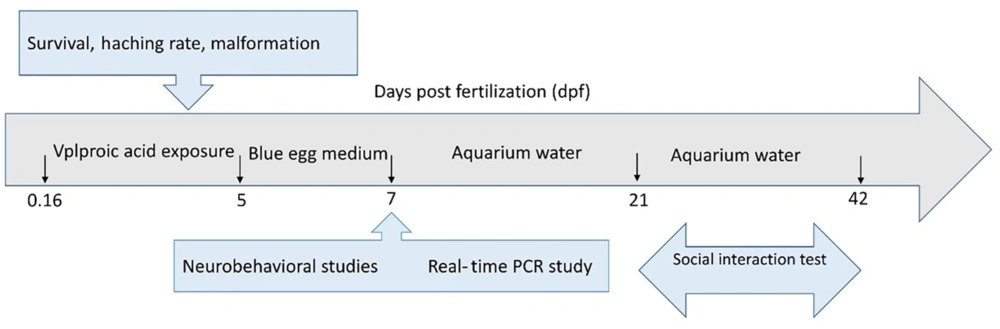
Figure 1.
Experimental design of zebrafish larval model. The embryos were exposed to 1 µM VPA from 4 hpf to 5 dpf. Behavioral and molecular studies were performed on 7 dpf. Social interaction test was performed at 21 and 42 dpf.
3.4. Population Approach
To examine behavioral factors, the population technique was used in this study. In the population method, instead of signal larvae, the behavior of groups was analyzed. Instead of analyzing individual larvae, each behavioral attribute was assessed by quantifying the behavior of the whole group (28). All behavioral evaluations were conducted in a soundproof room. One hour before behavioral testing, the larvae’s medium was changed, and they were brought to the behavioral room. All behavioral assessments were performed using Ariya Shide Botiya software (Eadepardazan Ariya Shide Botiya, Iran).
3.5. Open-Field Test
An open-field test was used to assess anxiety levels. This test was conducted on zebrafish larvae on a dish with a 90 mm diameter and 15 mm height (Figure 2A). The activity of 10 larvae in the middle of a plate was observed for 30 minutes by a camera placed above the plate. To analyze the thigmotaxis behavior of larvae, the proportion of larvae on the plate’s edge was counted every minute (28).
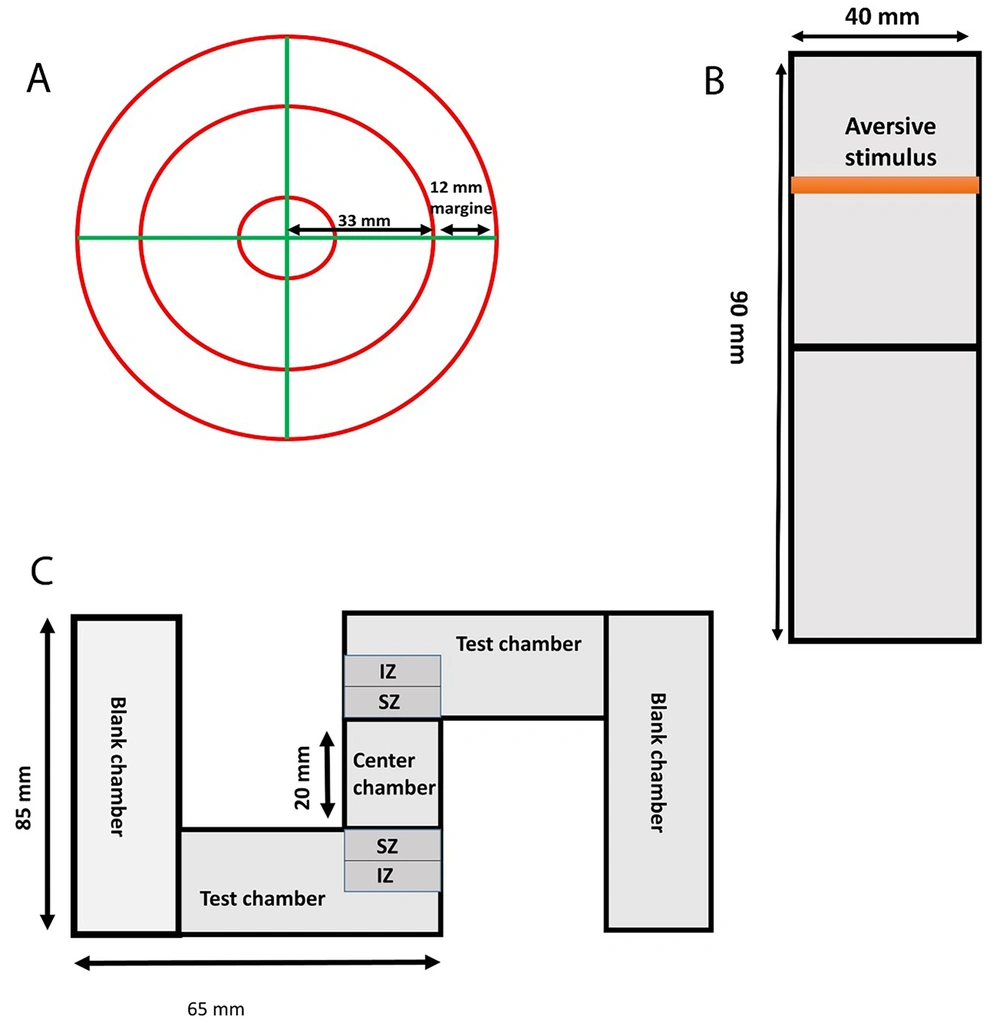
Figure 2.
Behavioral assessment apparatus used in this study. (A) Open-field test: This test was performed in a petri dish with a diameter of 90 mm and a height of 15 mm. Ten embryos were used per petri dish. (B) Inattentive behavior test: This test was carried out in a rectangle Plexiglas plate with dimensions 90 mm to 40 mm. A PowerPoint presentation was used to perform the test. At first, a blank white background was displayed for 30 minutes, and then a moving red bar (aversive stimulus) was shown on the upper half of the plate for 30 minutes. Acclimatization and aversive stimulus phases were recorded by a camera. (C) Social interaction test: This test was performed in an S maze that consisted of five chambers (2 tests, 2 blanks, and 1 center). The embryos were analyzed individually in each test chamber (n = 10).
3.6. Inattentive Behavioral Test
The larvae were put through an inattentive behavioral test to see how they would react to an aversive stimulus. A rectangular piece of plexiglass measuring 90 mm by 40 mm was used. The dish contained 10 larvae. A 10-inch screen was first used to show a blank white backdrop for 30 minutes underneath the plate. Then, a moving red bar (aversive stimulus) was shown for 30 minutes on the top half of the plate (Figure 2B). A camera placed above the plate captured the acclimation and unpleasant stimuli phases. Every two minutes, the number of larvae was counted in the top and bottom halves of the plate. The following formula was used to determine the percentage reaction to an aversive stimulus:
%Larvae in lower over acclimatization = (Aversive stimulus - Acclimatization)/Acclimatization × 100 (28)
3.7. Larval Zebrafish Brain Extraction
Zebrafish larvae aged 7 days were first put to sleep using purified water and 0.02% MS222 (3-aminobenzoic acid ethyl ester methanesulfonate salt). Insect pins were used to secure the larvae in a petri dish containing artificial cerebrospinal fluid (aCSF) and agarose gel. After removing the head’s soft tissue with a needle under a stereo microscope to reveal the brain tissue, the spinal cord was cut at the point where the spinal cord and brain stem converged, and the entire brain was removed and placed in a TRIzol solution that was kept at -80°C to extract ribonucleic acid (RNA) (36).
3.8. Real-time Polymerase Chain Reaction Study
Four genes (i.e., chd8, ctnnb, gsk3 beta, and lrp6) associated with the canonical Wnt-catenin pathway were chosen, and their expression was assessed. According to the manufacturer’s instructions, RNX-plus (Cinnagen, Iran) reagent was used to extract RNA from cells. According to the vendors, 1 g of total RNA and 1 g of random hexamer primer were used using the YTA cDNA Synthesis Kit (Yekta Tajhiz, Iran). At 37°C, RT reactions were conducted for 60 minutes. One microliter (µL) of cDNA was utilized as the template for polymerase chain reaction (PCR) using certain primers. beta-2-microglobulin (b2m)) is used as a common internal control. In order to estimate the number of cycles necessary to enable product detection during the linear phase of messenger RNA (mRNA) transcript amplification, real-time PCR procedures (with a total volume of 25 l) were carried out and optimized. Several conditions were present for each reaction, namely the initial 12-minute denaturation process at 95°C, followed by 40 cycles of 10 seconds at 95°C, 1 second of annealing, and 1 second of extension. By utilizing the gene expression in normal samples, the two delta-delta CT approach was used to standardize the results. Table 1 shows the sequences of each primer that was created using primer-BLAST (the National Center for Biotechnology Information [NCBI]).
Table 1.
List of the Primers for Real-time Polymerase Chain Reaction Analysis
| Genes | Primers |
|---|---|
| Chd8 | |
| F | TTTCCTATTCCTCACTCCCTAATC |
| R | GTGATATCCAGTGTCGGTACAA |
| ctnnb | |
| F | CAACGGATTGTCGCCATTATTC |
| R | CAGACTGGGTAGCCATGATTT |
| gsk3β | |
| F | CATTCGGCAGCATGAAAGTC |
| R | TCAGTGTAGCTGACCTCCT |
| Lrp6 | |
| F | AAACTTTACTGGACCGACTCC |
| R | CAGGTTCTGCCAGAATAACAA |
| b2m | |
| F | CTCCACTCCGAAAGTTCATGT |
| R | TGTCCGTTCTTCAGCAGTTC |
3.9. Social Interaction Test
The social interaction test is one of the most critical tests conducted in the zebrafish autism model. This test was performed at 21 dpf since it is a complicated behavior, and it is impossible to investigate this behavior previous to this period. The test was performed in an S maze that consists of five chambers (i.e., 2 tests, 2 blanks, and 1 center). Each larva was put in the test room; however, 10 larvae were placed in the central chamber (Figure 2C). Larvae spending a proportion of time around the center chamber was deemed a social interaction activity (28).
3.10. Statistical Analysis
The figure caption includes the P-values and the number of animals used in each test (represented by n). There were 700 animals utilized. The creation of graphics and statistical analyses were performed using the GraphPad Prism software (version 9). The data were expressed as means ± standard error the mean (SEM). Three analyses, including one-way analysis of variance (ANOVA) (followed by Tukey’s test), repeated measures ANOVA, and analysis of unpaired t-test, were carried out. In all the tests, a P-value < 0.05 was used to determine statistical significance.
4. Results
4.1. Effect of Different Concentrations of VPA on Zebrafish Survival
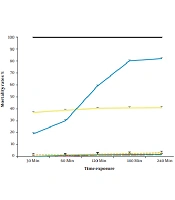
According to the findings of the survival research, all zebrafish embryos were exposed to 48 and 75 µ M VPA perished within 24 hpf. By 24 hpf, 90% of embryos exposed to 25 µ M VPA survived; nevertheless, at 7 dpf, only 70% of embryos survived, and at 14 dpf, none of the animals was still alive. At 24 hpf, the survival rate of embryos exposed to 15 M VPA was 90%; however, by 7 and 14 dpf, it dropped to 75% and 40%, respectively. After 21 dpf, there was not a single live animal left in this group. From 100% at 24 hpf to 75% at 42 dpf, the survival rate in the group that received 5 M VPA exhibited a tendency toward decline. It is interesting to note that 1 µM VPA-exposed larvae survived up to 42 dpf (Figure 3A). The difference between the control and treatment groups was compared, and statistical ANOVA utilizing Tukey’s post hoc test was used to evaluate the data. Survival was calculated for each concentration of VPA. The findings indicated that exposure to 5 (P < 0.01), 15 (P < 0.001), 25 (P < 0.001), 48 (P < 0.001), and 75 (P < 0.001) M VPA significantly reduced survival. Therefore, the only concentration of VPA that did not significantly affect survival was 1 M (Figure 3B).
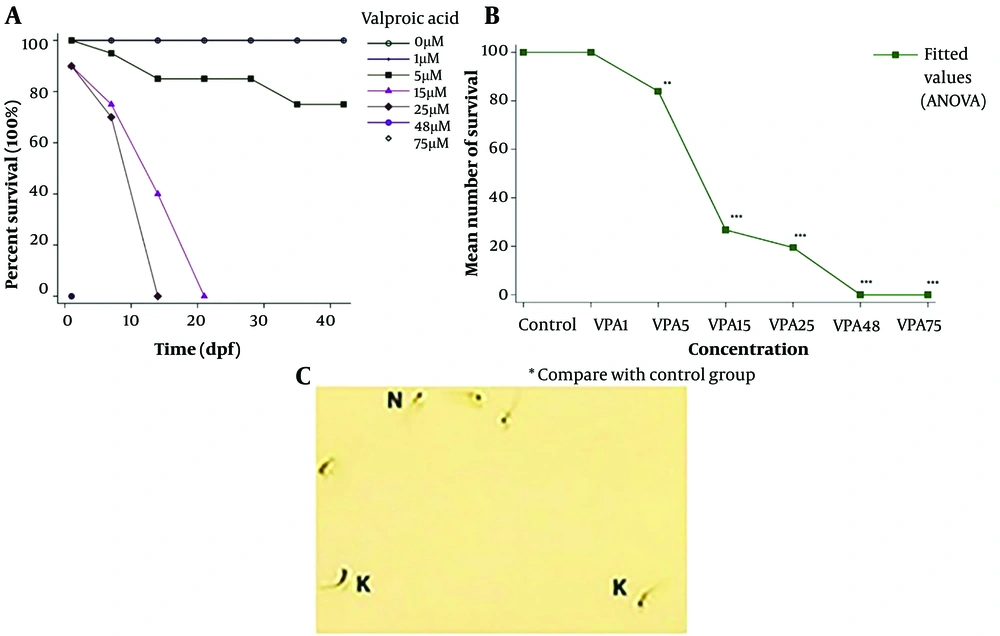
Figure 3.
Effect of valproic acid (VPA) exposure on zebrafish larvae survival and morphology. (A) Survival study of 42 dpf after embryonic exposure to different concentrations of VPA. (B) Survival was significantly decreased in VPA treated group compared to the control group. (C) In the figure, the normal morphology of zebrafish larvae (N) versus kyphosis morphology (K) can be observed. All results are reported as mean ± SEM, and statistical significance was ascertained using one-way ANOVA and Tukey’s post hoc test. ***P < 0.001, **P < 0.01.
4.2. Effect of Different Concentrations of VPA on Zebrafish Hatching
The 48 and 75 µM groups did not produce any hatched embryos. The larvae in the remaining groups remained alive for 72 hours, indicating a typical, prompt hatching.
4.3. Incidence of Malformations After Exposure to Different Concentrations of VPA
In this study, 15% of the larvae exposed to 25 µM VPA exhibited spine curvature as a deformity (Figure 3C). Moreover, 5% of the animals in the group exposed to 15 µM VPA had malformations. The larvae exposed to 1 and 5 µM exhibited no deformity.
4.4. Behavioral Assessments
Based on the above-mentioned findings, a concentration of 1 µM, the lowest concentration with the fewest side effects, was selected for modeling ASD-like phenotype.
4.4.1. Thigmotaxis Behavior
To investigate the behavior of thigmotaxis, an open-field test was conducted. By using an unpaired t-test, the difference between the control and treatment groups was evaluated. This test revealed that the average number of VPA-treated larvae on the plate’s edge was substantially greater than that of the control group (P < 0.001, Figures 4A - C). The conclusion is that anxiety is greater in the VPA-treated group than in the control group.
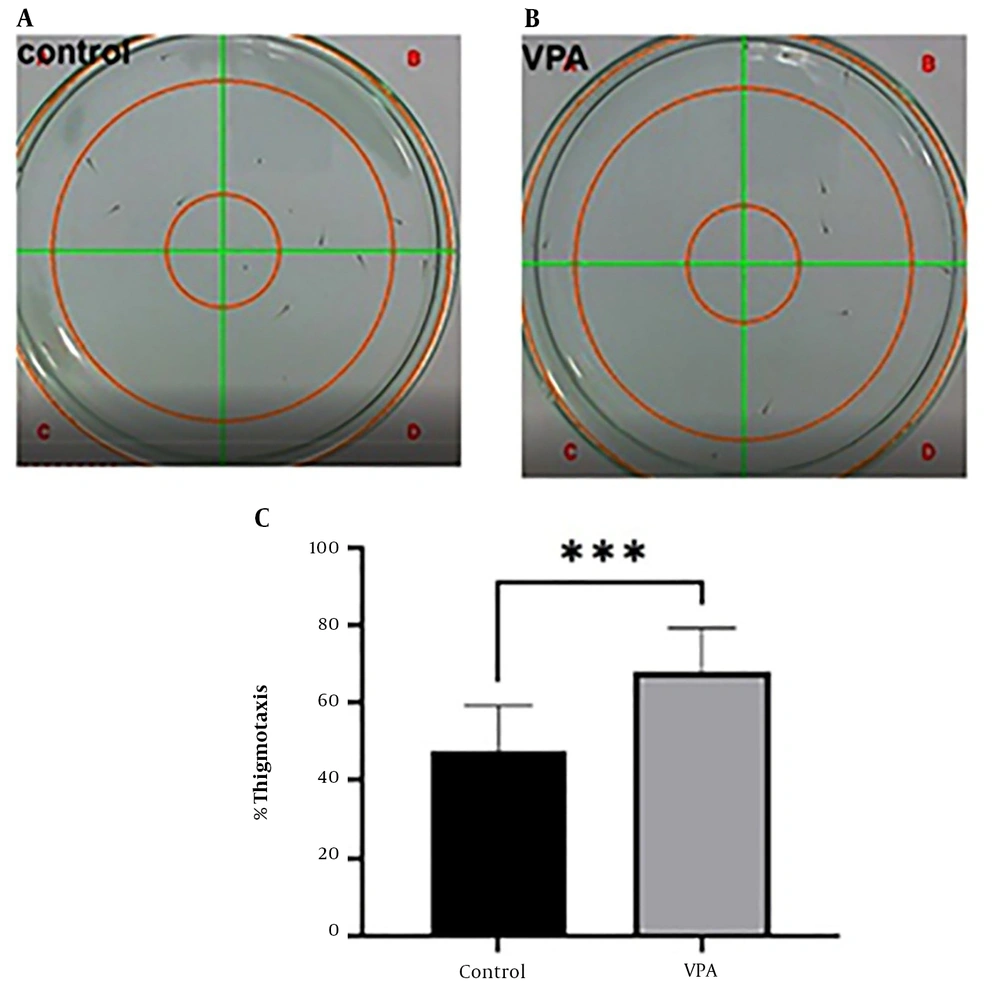
Figure 4.
Open-field test; (A) thigmotaxis behavior in control group; (B) thigmotaxis behavior in valproic acid (VPA)-treated group; (C) analysis of thigmotaxis behavior. All results are reported as mean ± SEM and statistical significance was ascertained using an unpaired t-test in GraphPad Prism Software, where ***P < 0.001 as compared to the control group.
4.4.2. Inattentive Behavior
During the acclimation period, the VPA-treated group and the control group moved randomly between the upper and lower halves of the plate, according to the findings of the inattentive behavior test. During the unpleasant stimulus phase, VPA-treated larvae presented on the upper half of the plate; however, the control group substantially relocated to the bottom half of the plate (P < 0.01, Figures 5A - D). Every 2 minutes, the number of larvae in the top and bottom halves of the plate was tallied. The number of larvae in the top portion of the plate demonstrated their inattentive behavior. This experiment was conducted to examine passive avoidance learning in larval zebrafish. The inability of the VPA-treated group to comprehend negative stimuli might be indicative of their learning impairment.
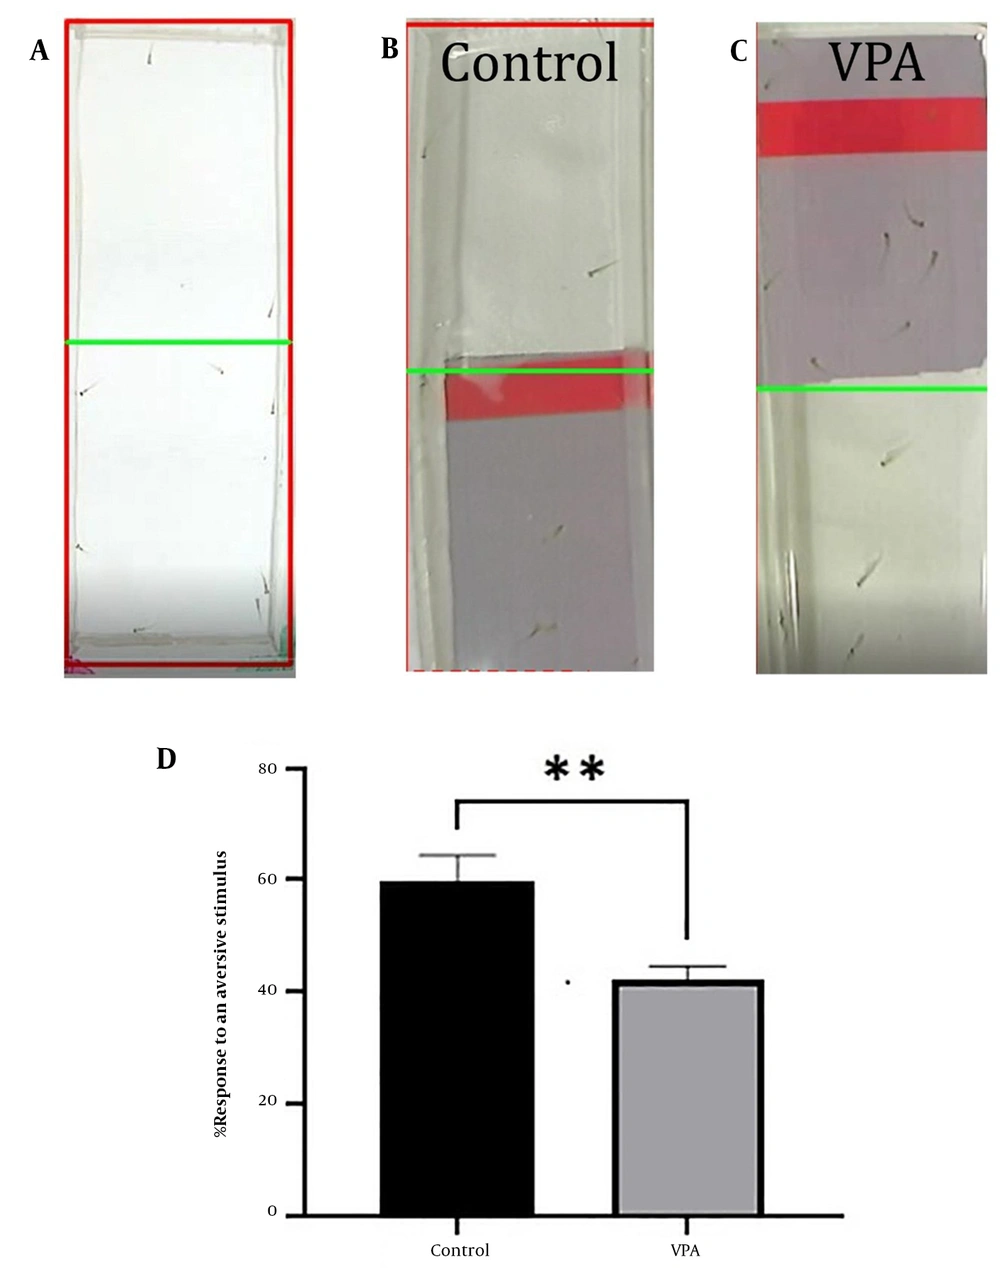
Figure 5.
Inattentive behavior; (A) acclimatization phase of valproic acid (VPA)-treated and control groups; (B) aversive stimulus phase of control group; (C) aversive stimulus phase of vpa-treated group; (D) analysis of aversive response. All results are reported as mean ± SEM, and statistical significance was ascertained using an unpaired t-test in GraphPad Prism software, where **P < 0.01 as compared to the control group.
4.4.3. Social Interaction Test in 21 dpf
The findings of the social interaction test revealed that the control group spent a considerably greater proportion of their time than the VPA-treated group in the social interaction area (near the center chamber, P < 0.01, Figures 6A - C). It indicates that a concentration of 1 M VPA impairs the social interaction of zebrafish larvae.
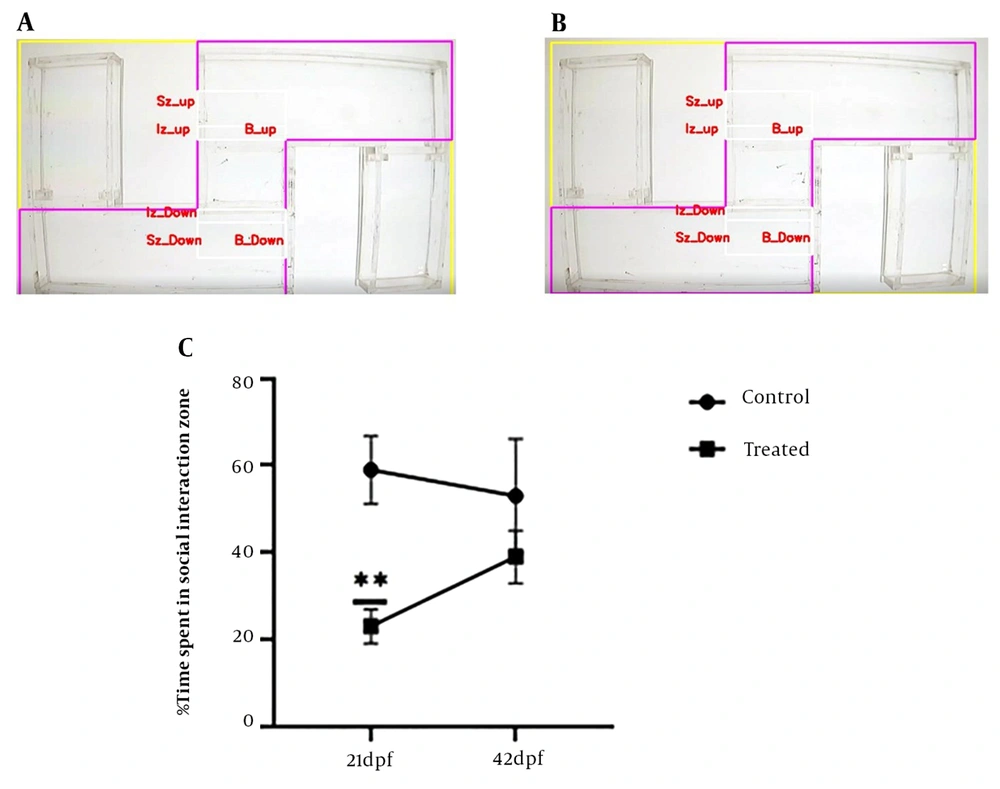
Figure 6.
Social interaction test; (A) social interaction test of the control group at 21 dpf; (B) social interaction test of the valproic acid (VPA)-treated group at 21 dpf; (C) percentage time spent by control and vpa-treated larvae and juvenile zebrafish in the social interaction zone. All results are reported as mean ± SEM (n = 10 /group/experiment), and statistical significance was ascertained using repeated measure ANOVA in GraphPad Prism software, where **P < 0.01 as compared to the control group.
4.4.4. Social Interaction Test in 42 dpf
To investigate the long-lasting impact of VPA on social interaction behavior in juvenile zebrafish, the social interaction test was performed at 42 dpf. The outcomes revealed no discernible difference between the control and VPA-treated groups (Figure 6C). The aforementioned results demonstrated that early exposure to 1 M VPA cannot significantly alter the social behavior of juvenile zebrafish.
4.5. Canonical Wnt-β-catenin Pathway Analysis
Dysfunction in the canonical Wnt-β-catenin signaling pathway was reported in ASD pathology. Previous studies indicated that VPA could result in the alteration of this pathway in the VPA-induced ASD model in animals. Due to these observations, four genes were chosen due to the canonical Wnt-β-catenin pathway, and the expression of these genes was assessed. An unpaired t-test indicated a significant increase in the expression level of all four genes, chd8 (P < 0.05), ctnnb (P < 0.01), gsk3 beta (P < 0.0001), and lrp6 (P < 0.0001) in the VPA-treated group, compared to the control group (Figures 7A - D).
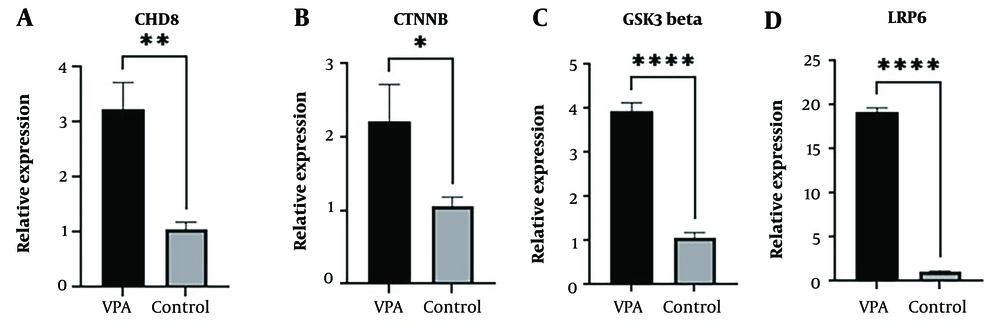
Figure 7.
Real-time reverse transcription polymerase chain reaction (RT-PCR) results of four selected Wnt-β-catenin pathway-related genes in the zebrafish larvae brain at 7 dpf upon early-life 1 µM valproic acid (VPA) exposure. The expression level of chd8 (A), ctnnb (B), gsk3 beta (C), and lrp6 (D) were significantly increased in the VPA-treated group compared to the control group. All results are reported as mean ± SEM (each pooled sample containing 50 larval brains, 3 experimental repeats), and statistical significance was ascertained using unpaired t-test in GraphPad Prism software, where *P < 0.05, **P < 0.01, ***P < 0.001, ****P < 0.0001, as compared to the control group.
5. Discussion
The VPA-induced autism zebrafish model is a reliable tool for researching the neurobehavioral alterations and molecular causes of ASD (29, 31, 37-41). According to published research, VPA exposure might cause symptoms, such as those of ASD, such as anxiety and social impairment. Valproic acid has a significant impact on regulating the expression of zebrafish neurodevelopmental genes, according to numerous earlier studies (14, 27, 28, 30). Various studies have employed varying VPA concentrations and VPA exposure times to have zebrafish larvae behave in ways that resemble ASD.
To find the lowest dosage of VPA with the fewest side effects that might produce autism-like behavior in a zebrafish model and lead to early and persistent autism-like phenotype, the present study investigated numerous micromolar concentrations of VPA (i.e., 1, 5, 15, 25, 48, and 75 µM). The current study’s findings showed that zebrafish embryos die after 24 hours of exposure to 48 and 75 µM of VPA. On the other hand, there was only a week to conduct research after exposing zebrafish embryos to 25 µM of VPA. This window of time allows for the performance of behavioral tests, with the exception of social behavior and molecular evaluations of malformations. Some malformations can be studied for 14 days when zebrafish are given 15 µM of VPA during their first 120 hours of life. The mortality rate increased over time, although 5 µM of VPA is less toxic than higher concentrations of VPA. As a result, long-term studies are not appropriate for this concentration. Given that 42 days after fertilization, 120 hours of exposure to 1 µM of VPA did not result in death, this concentration is suitable for long-term behavioral evaluations.
The present study’s findings are consistent with the findings of a previous study that demonstrated a concentration-dependent relationship between the survival rate of zebrafish embryos exposed to VPA. The authors noted that only the concentration of 5 µM did not significantly affect the mortality rate of larvae after using various concentrations of VPA (i.e., 5, 10, 20, 30, and 40 M). Messina et al. demonstrated that zebrafish larvae at 2 and 5 dpf exposed to 1 µM VPA for 24 or 48 hours induced molecular alteration in neurodevelopmental genes; nevertheless, they did not conduct any neurobehavioral tests to assess changes in behavior in this model (29). Although the present study’s findings did not agree with those of earlier studies using the same VPA concentrations, they did not have an impact on the mortality rate. This discrepancy might be explained by the variations in the exposure time, environmental conditions, and genetic strains used in these studies.
Although Baronio et al. exposed zebrafish larvae to 25 mM VPA for 24 hours, they used the Turku strain in their study as opposed to Zimmermann et al., who exposed zebrafish larvae to 48 mM VPA for 48 hours, and Dwivedi et al., who exposed zebrafish larvae to 75 mM VPA for 120 hours (26, 28, 35). Since group analysis allows us to examine these behaviors, the population approach was used to evaluate behavioral parameters because individual larvae might not exhibit all of the symptoms of ASD. The higher rate of thigmotaxis at 7 dpf in this model might be due to elevated anxiety. In the present study, the higher rate of thigmotaxis has been supposed to be linked with anxiety behavior in mammals (42).
The current study’s results agree with the results of previous studies showing that VPA exposure increases anxiety in zebrafish larvae (26-28, 32, 42). The inattentive behavior test showed that VPA-treated larvae were indifferent to the aversive stimulus; however, the control larvae avoided the unpleasant stimulus. In general, any species avoid aversive stimuli, considered passive avoidance (43, 44). This test was performed to evaluate passive avoidance learning in zebrafish larvae. The lack of comprehension of aversive stimuli by the VPA-treated group might indicate their learning impairment. The present study’s data are in line with a previous study that indicated inattentiveness in 7 dpf zebrafish larvae treated with 75 µVPA (28).
A social interaction test was conducted on larvae and juvenile zebrafish at 21 and 42 dpf to evaluate the long-term impact of 1 µM VPA on behavior. According to a previous study, 7 dpf larvae exhibit poor social behavior; nonetheless, 21 dpf larvae exhibit strong social interaction (45, 46). Although the ability of larvae to interact socially was impaired at 21 dpf, this behavior remained unchanged at 42 dpf. To put it another way, 1 M VPA could have short- and long-term effects on larval zebrafish behavior; however, it was insufficient to have a lasting impact on juvenile zebrafish behavior. Social interaction impairment is one of the main signs of ASD. Numerous studies revealed that zebrafish larvae treated with VPA exhibited deficits in social interaction. The current study’s findings are consistent with the findings of earlier studies showing that VPA exposure impairs social interaction in zebrafish larvae (26-28, 42).
Numerous studies have revealed that exposure to VPA causes behavioral alterations, although the underlying biochemical pathways are still poorly understood. Four canonical Wnt-catenin signaling pathway-related genes were chosen in this study to investigate the potential relationship between these genes’ expression and the observed neurobehavioral impairment in this investigation, taking into account the epigenetic modification of VPA and its influence on gene expression. The obtained findings demonstrated a much higher pattern of chosen gene expression in the 1 µM VPA-treated group. The aforementioned results might suggest a relationship between neurobehavioral phenotypes and altered canonical Wnt- β catenin signaling pathways. The present study’s findings are consistent with the findings of a previous study indicating that VPA had an impact on the canonical Wnt- β-catenin signaling pathway (25). The current study showed that early and long-term neurobehavioral impairments occur in zebrafish larvae exposed to 1 µM VPA during the first 120 hours of development. The present study demonstrated that 1 µM VPA at 7 dpf had an impact on the expression of genes linked to the canonical Wnt-catenin pathway.
5.1. Conclusions
In conclusion, an ASD-like phenotype (anxiety and inattentive behavior in 7 dpf and a deficiency in social interaction in 21 dpf) might be produced in zebrafish using 1 µM VPA in the first 120 hours of their lives with no mortality. This paradigm is suitable for research on both short- and long-term genetic and neurobehavioral alterations linked to ASD in zebrafish larvae.