


1. Background
2. Objectives
3. Methods
3.1. Design
3.2. Inclusion and Exclusion Criteria
3.3. Ethical Statement
3.4. Videoconference Parent Management Training
3.5. In-person Parent Management Training
3.6. Randomization and Blinding
3.7. Sample Size Estimation
3.8. Measures
3.8.1. Conners’ Parent Rating Scale
3.8.2. Swanson, Nolan, and Pelham Questionnaire
3.9. Data Collection
3.10. Statistical Analysis
4. Results
4.1. Participant Demographics
| Variables | Training Type | P-Value | |
|---|---|---|---|
| In-person | Videoconference | ||
| Participated parents | 0.6 b | ||
| Both father and mother | 11 (30) | 8 (22) | |
| Only mother | 26 (70) | 29 (78) | |
| Only father | 0 | 0 | |
| Age | 8.92 ± 1.57 | 8.76 ± 1.79 | 0.68 c |
| Father’s age | 41.97 ± 3.99 | 40.84 ± 3.85 | 0.22 c |
| Mother’s age | 36.7 ± 3.36 | 36.38 ± 3.15 | 0.67 c |
| Father’s education | 0.12 b | ||
| Below diploma | 11 (29.7) | 4 (10.8) | |
| Diploma | 9 (24.3) | 10 (27) | |
| Higher than a diploma | 17 (45.9) | 23 (62.2) | |
| Mother’s education | 0.03 b | ||
| Below diploma | 7 (18.9) | 3 (8.1) | |
| Diploma | 14 (37.8) | 7 (18.9) | |
| Higher than a diploma | 16 (43.2) | 27 (73) | |
a Values are expressed as No. (%) or mean ± SD.
b P-value is according to the chi-square test.
c P-value is according to the t-test.
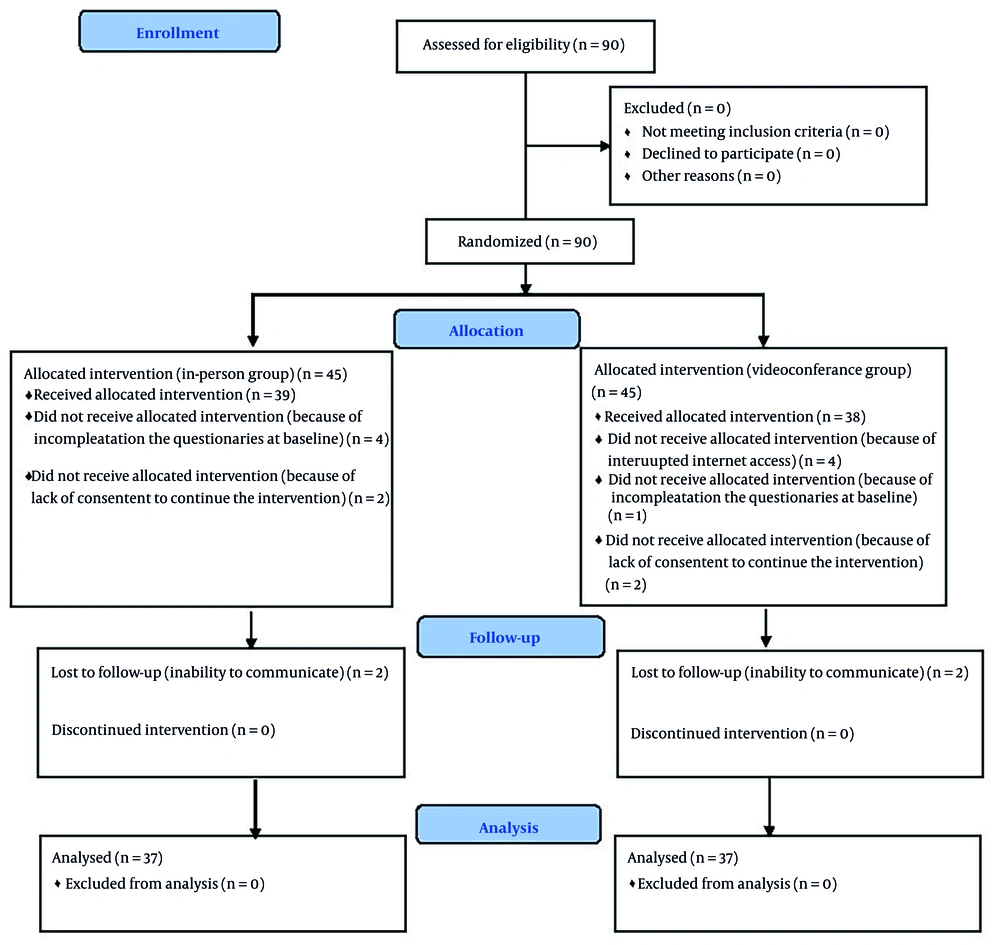
Flow diagram of study parents
4.2. Effectiveness of Parent Management Training on the Conner’s Parent Rating Scale Scores
4.2.1. Conduct Problem
4.2.2. Social Functioning Problem
4.2.3. Psychosomatic Problem
4.2.4. Anxiety Problem
4.2.5. Total Scores
| Scales | In-person | Videoconference | P-Value (Effect Size) b | P-Value (Effect Size) c |
|---|---|---|---|---|
| Conduct, baseline | 61.62 ± 10.29 | 59.78 ± 11.18 | 0.464 (0.17) | < 0.001 (0.12) |
| Conduct, post-PMT | 55.24 ± 5.48 | 58.92 ± 11.95 | 0.095 (0.39) | |
| Conduct, follow up | 51.19 ± 8.07 | 55.27 ± 9.45 | 0.05 (0.46) | |
| P-value (effect size) d | < 0.001 (0.48) | < 0.001 (0.35) | ||
| Social, baseline | 71.46 ± 14.11 | 68.65 ± 13.49 | 0.384 (0.20) | < 0.001 (0.17) |
| Social, post-PMT | 61.78 ± 8.52 | 67.97 ± 13.48 | 0.021 (0.55) | |
| Social, follow up | 60.59 ± 10.74 | 67.92 ± 12.49 | 0.009 (0.63) | |
| P-value (effect size) d | < 0.001 (0.39) | 0.638 (0.01) | ||
| Psychosomatic, baseline | 67.92 ± 14.68 | 64.08 ± 10.28 | 0.197 (0.16) | < 0.001 (0.18) |
| Psychosomatic, post-PMT | 58.73 ± 9.43 | 62.68 ± 9.79 | 0.082 (0.41) | |
| Psychosomatic, follow up | 56.73 ± 10.77 | 62.86 ± 11.39 | 0.02 (0.55) | |
| P-value (effect size) d | < 0.001 (0.45) | 0.282 (0.03) | ||
| Anxiety, baseline | 56.19 ± 8.76 | 53.32 ± 8.42 | 0.156 (0.33) | 0.014 (0.06) |
| Anxiety, post-PMT | 51.27 ± 5.65 | 51.54 ± 7.84 | 0.865 (0.04) | |
| Anxiety, follow up | 49.59 ± 8.09 | 51.05 ± 9.17 | 0.47 (0.17) | |
| P-value (effect size) d | < 0.001 (0.30) | 0.036 (0.09) | ||
| Total, baseline | 57.3 ± 8.45 | 62.89 ± 11.71 | 0.021 (0.55) | 0.655 (0.01) |
| Total, post-PMT | 56.89 ± 7.34 | 61.65 ± 12.04 | 0.045 (0.48) | |
| Total, follow up | 54.35 ± 9.83 | 60.54 ± 11.88 | 0.017 (0.57) | |
| P-value (effect size) d | 0.118 (0.06) | 0.004 (0.14) |
Abbreviation: PMT, parent management training.
a Values are expressed as No. (%) or mean ± SD.
b P-value is derived from the t-test for testing between-group effects, and the effect size is based on Cohen’s d.
c P-value is derived from the repeated measures model for the interaction of time and group effect, and the effect size is calculated using partial eta squared.
d P-value is derived from the repeated measures model for testing within-group effects, and the effect size is calculated using partial eta squared.
4.3. Effectiveness of Parent Management Training on the Swanson, Nolan, and Pelham Questionnaire Scores
4.3.1. Attention Deficit Disorder
4.3.2. Hyperactivity Disorder
4.3.3. Attention Deficit Hyperactivity Disorder
| Variables | In-person | Videoconference | P-Value (Effect Size) b | P-Value (Effect Size) c |
|---|---|---|---|---|
| ADD, baseline | 15.32 ± 5.6 | 16.3 ± 5.91 | 0.47 (0.17) | 0.987 (0.00) |
| ADD, post-PMT | 13.73 ± 5.29 | 14.76 ± 5.9 | 0.433 (0.18) | |
| ADD, follow up | 12.11 ± 4.91 | 13.19 ± 5.13 | 0.357 (0.21) | |
| P-value (effect size) d | < 0.001 (0.38) | < 0.001 (0.39) | ||
| HD, baseline | 7.73 ± 3.61 | 9.51 ± 3.71 | 0.04 (0.49) | 0.851 (0.01) |
| HD, post-PMT | 7 ± 3.37 | 8.49 ± 3.59 | 0.071 (0.43) | |
| HD, follow up | 5.3 ± 2.9 | 7.03 ± 3.18 | 0.017 (0.57) | |
| P-value (effect size) d | < 0.001 (0.37) | < 0.001 (0.28) | ||
| ADHD, baseline | 4.43 ± 3.03 | 4.65 ± 3.15 | 0.764 (0.07) | 0.467 (0.01) |
| ADHD, post-PMT | 3.68 ± 2.51 | 4.27 ± 2.92 | 0.351 (0.22) | |
| ADHD, follow up | 3.22 ± 2.58 | 3.78 ± 2.8 | 0.368 (0.67) | |
| P-value (effect size) d | < 0.001 (0.29) | 0.01 (0.13) |
Abbreviations: ADD, attention deficit disorder; PMT, parent management training; HD, hyperactivity disorder; ADHD, attention deficit hyperactivity disorder.
a Values are expressed as No. (%) or mean ± SD.
b P-value is derived from the t-test for testing between-group effects, and the effect size is based on Cohen’s d.
c P-value is derived from the repeated measures model for the interaction of time and group effect, and the effect size is calculated using partial eta squared.
d P-value is derived from the repeated measures model for testing within-group effects, and the effect size is calculated using partial eta squared.


