
1. Background
Acute coronary syndrome (ACS) is a type of coronary heart disease (CHD) and refers to a group of cardiac conditions, including ST-elevation myocardial infarction, non-ST elevation myocardial infarction, and unstable angina (1). Ischemic heart disease (IHD) and subsequent ACS are among the leading causes of worldwide mortality and morbidity. According to the latest report of the global burden of diseases, injuries, and risk factors study, IHD has been identified as the top-ranked cause of disability-adjusted life-years (DALYs) in two age groups (50 - 74 and ≥ 75 years) (2, 3). Individuals who experience ACS are at an increased risk of mental disorders. A higher incidence of depression and anxiety has been reported following ACS, and screening for psychiatric problems has been emphasized as a priority in these patients (4-6). Some literature demonstrates that 40.0% of hospitalized patients with cardiac disease might have clinically significant depression; meanwhile, mild depression is observed with a greater prevalence, up to 78.4% (7). Nearly 14% of patients with CHD suffer from depressive symptoms, and 40 - 70% of them are estimated to have anxiety symptoms (7, 8). However, these rates might vary in different regions and populations. The incidence of anxiety and depression in patients with ACS depends on various demographic, social, behavioral characteristics, and clinical determinants (9). Comorbidity of ACS with these psychiatric problems might deteriorate the patient’s quality of life (QOL) and prognosis and increase cardiovascular events and death (10). The occurrence of ACS with depression ± anxiety is associated with poor adherence to treatment protocols, unhealthy lifestyle behaviors, social inhibition, and lower participation in cardiac rehabilitation programs (9).
2. Objectives
The impact of cardiac functional class on the occurrence of psychiatric problems following ACS, especially during the first months after ACS diagnosis, has not been clearly understood; and limited studies have investigated the association between echocardiographic measures of cardiac function and the incidence of depression and/or anxiety in patients with ACS (11-14). This research was conducted to explore the association of depression, anxiety, and QOL with cardiac function in patients with ACS.
3. Methods
3.1. Study Design and Setting
This cross-sectional study was conducted among patients diagnosed with ACS hospitalized in the state Cardiology Department affiliated with Babol University of Medical Sciences, north of Iran, from 2022 to 2023.
3.2. Participants
Adult patients aged 18 years and over whose ACS diagnosis was confirmed by an academic cardiologist were included in the research by convenience sampling. Patients who were unable to answer the research questions; individuals with known serious psychiatric disorders (such as a previous history of serious suicidal thoughts or schizophrenia); patients with cognitive disorders (including delirium, dementia, or mental retardation); and individuals who had a self-reported history of anxiety and/or depression before the current hospital admission were excluded.
3.3. Research Variables and Measurements
Acute coronary syndrome diagnosis and classification were carried out using the latest guideline on diagnosis and treatment of ACS (15). According to this guideline, all adult patients who experienced new or worsened chest pain in the last four to six weeks, with a confirmed diagnosis of ACS by the cardiologist, with or without changes in electrocardiography, and with or without rising cardiac enzymes admitted to this cardiology department were recruited. Age, gender, level of education, previous history of hypertension, diabetes mellitus, and other comorbidities, as well as medications the patient was consuming, were recorded in the research data sheet. The Hospital Anxiety and Depression Scale (HADS) and the World Health Organization's Quality of Life Questionnaire (WHOQOL-BREF) were filled out by the researcher (a trained medical student) during the first seven days of hospitalization. Furthermore, plasma concentration of troponin was tested, and left ventricular ejection fraction (LVEF) was examined by a cardiologist through echocardiography. Cardiac function was assessed with the New York Heart Association (NYHA) functional class. All patients were assessed at two times: (1) The first examination at the baseline visit; and (2) the second follow-up between the 4th and the 8th week after hospitalization, when the patients returned to continue the treatment process.
- The HADS Questionnaire consists of 14 questions: Seven options for the assessment of anxiety symptoms and seven for depression. Each question scores from zero to three, and a higher score indicates a worse clinical condition. For classification, a score of 0 to 7 indicates no clinical symptoms, a score of 8 to 10 means mild depression or mild anxiety, and a score of 11-21 represents severe depression or anxiety. This questionnaire has been translated in Iran since 2003, and its reliability (r = 0.77 and Cronbach's alpha = 0.92) and validity have been approved (16).
- The WHOQOL-BREF consists of 26 items: Two questions for self-reported general assessment of QOL, seven items for physical health, six items for mental health, three items for social relationships, and eight questions for the assessment of the respondent’s environment. Each domain scores from 0 to 100, and a higher score indicates a better QOL. This scale has been translated in Iran since 2008, and its psychometric properties have been approved (intra-class correlation = 0.69 and Cronbach's alpha more than 0.7 in all sub-scales) (17).
The NYHA functional class provides a simple categorization of cardiac function based on the patient’s limitation during physical activity. Class I: Indicates no symptoms (such as dyspnea or chest pain) and no limitation in physical activity. Class II: Mild symptoms (mild dyspnea and/or angina pectoris) and minor limitation during normal activity. Class III: Marked limitation in activity due to symptoms, even during less than usual activity, for example, walking short distances (20 to 100 meters). Class IV: Severe restrictions. These patients experience symptoms even at rest (18).
3.4. Bias
- Data collection: We used standardized data collection procedures (standard questionnaire, etc.) to minimize measurement bias. Also, we utilized trained data collectors thoroughly to ensure consistency and accuracy of the data.
- Data analysis: In addition to univariate analysis, we used multivariable regression analysis to control the effect of confounding parameters.
3.5. Sample Size
Considering P = 10% (prevalence of depression in patients with CHD) (6), and d = 0.05, the minimum sample size was calculated as 139 people using the following formula:
3.6. Statistical Methods
In this study, to address and minimize missing data, we used a trained assessor to collect related data. Whenever an individual entered the study and completed the research questionnaires, the assessor checked the completeness of the information. If incomplete items were found, the assessor asked the patient to complete them. Collected data were analyzed using SPSS version 22 (IBM Corporation, USA) software. A paired t-test was used to compare the research variables in each participant at the first visit and follow-ups. Considering the normal distribution of quantitative data, an independent t-test or Wilcoxon signed ranks test was used to analyze the research data. The chi-square test was used to analyze quantitative data. Multivariable regression analysis was used to investigate the association between cardiac function and QOL, anxiety, and depression. Analysis of covariance (ANCOVA) was used to explore any change in depression, anxiety, and QOL based on the patient’s cardiac function (NYHA class and LVEF) and different comorbidities. A P-value < 0.05 was considered the significance level.
4. Results
A total of 139 patients with a mean age of 63.82 ± 12.58 years completed the study protocol. The flow diagram of the participants is presented in Figure 1. Sixty-seven individuals (48.2%) were male, and 57 (40.3%) were illiterate. Comorbidities were found as follows: Hypertension (90 individuals; 64.7%), IHD (74; 53.2%), diabetes mellitus (44; 31.7%), and hypothyroidism (23; 16.5%). Furthermore, 136 patients (97.8%) reported the consumption of cardiovascular drugs. Main research variables at baseline and follow-up visits have been summarized in Tables 1 and 2. As seen in Table 1, the anxiety and depression scores decreased significantly, while the quality-of-life subdomains did not change during the study follow-up. Furthermore, the cardiac function and serum level of troponin did not change significantly (Table 2).
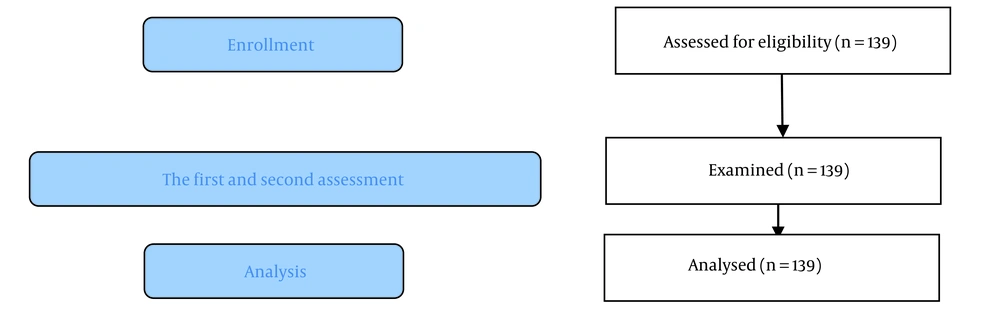
Figure 1.
Flow diagram of the participants
Table 1.
Anxiety, Depression and Quality of Life at Baseline and Follow-up Visits of Patients with Acute Coronary Syndrome a
| Characteristics | Baseline Assessment | Follow-up Assessment | P-Value b |
|---|---|---|---|
| HADS anxiety score | 7.05 ± 4.43 | 5.06 ± 4.13 | < 0.001 |
| HADS depression score | 6.21 ± 4.16 | 4.94 ± 4.74 | 0.001 |
| WHOQOL-BREF score | |||
| Physical health | 52.88 ± 16.56 | 51.90 ± 17.91 | 0.431 |
| Mental health | 56.60 ± 16.62 | 57.82 ± 14.19 | 0.271 |
| Social relationships | 73.36 ± 16.98 | 62.96 ± 10.80 | 0.204 |
| Environment | 59.22 ± 10.84 | 59.51 ± 10.65 | 0.496 |
| Total QOL score | 57.12 ± 19.49 | 62.91 ± 19.29 | < 0.001 |
Abbreviations: HADS, Hospital Anxiety and Depression Scale; WHOQOL-BREF, World Health Organization's Quality of Life Questionnaire; QOL, quality of life.
a Values are presented as mean ± SD.
b Paired t-test.
Participants were divided into two age groups (< 60 and ≥ 60 years old). The scores of the WHO-QOL Questionnaire and HADS depression and anxiety subscales were compared between the two groups using ANCOVA. We considered the follow-up scores of WHO-QOL as the dependent variable, the baseline scores of WHO-QOL as the covariate, and the age groups/sex as the factor. The association of the main research variables with the age and gender of the participants is presented in Table 3. As seen, the differences in the social subscale of WHO-QOL before and after the study between age and gender groups were statistically significant. Additionally, we observed a considerable difference in the environment subscales of WHO-QOL (before and after the study) among the age groups (P = 0.015) (Figure 2).
Table 2.
Cardiac Function and Serum Level of Troponin at Baseline and Follow-up Visits of Patients with Acute Coronary Syndrome a
| Characteristics | Baseline Assessment | Follow-up Assessment | P-Value b |
|---|---|---|---|
| NYHA Class | 0.338 | ||
| Class I | 48 (34.5) | 43 (30.9) | |
| Class II | 39 (28.1) | 51 (36.7) | |
| Class III | 33 (23.7) | 34 (24.5) | |
| Class IV | 19 (13.7) | 11 (7.9) | |
| Serum troponin | 0.058 | ||
| Positive | 33 (23.7) | 30 (21.6) | |
| Negative | 106 (76.3) | 109 (78.4) | |
| LVEF | 0.662 | ||
| > 50 | 72 (51.8) | 65 (46.8) | |
| 40 - 50 | 33 (23.7) | 41 (29.5) | |
| < 40 | 34 (24.5) | 33 (23.7) |
Abbreviations: NYHA, New York Heart Association; LVEF, left ventricular ejection fraction.
a Values are presented as No. (%).
b Using Wilcoxon signed ranks test.
Table 3.
Association of Quality of Life, Anxiety and Depressive Symptoms with Demographic Characteristics (Age and Gender), Comorbidities and Cardiac Function of Patients with Acute Coronary Syndrome a
| Variables | Anxiety Subscale of HADS | P-Value | Depression Subscale of HADS | P-Value b | Physical Health Subscale of WHOQOL-BREF | P-Value b | Mental Health Subscale of WHOQOL-BREF | P-Value b | Social Relationships Subscale of WHO-QOL BREF | P-Value b | Environment Subscale of WHOQOL-BREF | P-Value b | Total QOL Score | P-Value b | |||||||
|---|---|---|---|---|---|---|---|---|---|---|---|---|---|---|---|---|---|---|---|---|---|
| Baseline | Follow-up | Baseline | Follow-up | Baseline | Follow-up | Baseline | Follow-up | Baseline | Follow-up | Baseline | Follow-up | Baseline | Follow-up | ||||||||
| Gender | 0.413 c | 0.352 | 0.721 | 0.281 | 0.048 | 0.061 | 0.073 | ||||||||||||||
| Male | 5.13 ± 3.49 | 3.97 ± 3.91 | 0.019 b | 5.13 ± 3.59 | 4.10 ± 4.41 | 0.087 | 57.58 ± 15.80 | 55.62 ± 18.75 | 0.302 | 60.81 ± 16.73 | 61.16 ± 14.63 | 0.842 | 87.06 ± 13.41 | 65.02 ± 11.30 | 0.195 | 61.33 ± 11.59 | 62.13 ± 11.09 | 0.123 b | 60.07 ± 9.47 | 66.95 ± 16.28 | 0.006 |
| Female | 8.83 ± 4.48 | 6.08 ± 4.09 | < 0.001 b | 7.20 ± 4.41 | 5.70 ± 4.91 | 0.004 | 48.50 ± 16.13 | 48.44 ± 16.48 | 0.973 | 52.69 ± 15.64 | 54.72 ± 13.13 | 0.134 | 60.61 ± 11.49 | 61.04 ± 10.01 | 0.596 | 57.26 ± 9.77 | 57.06 ± 9.67 | 0.768 | 54.38 ± 19.23 | 59.15 ± 21.14 | 0.046 |
| Age (y) | 0.239 c | 0.092 | 0.362 | 0.625 | 0.004 | 0.015 | 0.521 | ||||||||||||||
| < 60 | 6.16 ± 4.69 | 4.25 ± 3.81 | 0.001 b | 5.14 ± 3.88 | 4.21 ± 4.45 | 0.141 | 59.14 ± 15.53 | 57.53 ± 17.02 | 0.378 | 60.70 ± 16.36 | 60.64 ± 15.54 | 0.972 | 65.16 ± 13.07 | 65.98 ± 11.92 | 0.397 | 59.41 ± 11.05 | 60.87 ± 10.64 | 0.027 | 59.34 ± 20.07 | 65.08 ± 17.33 | 0.044 |
| ≥60 | 7.65 ± 4.16 | 5.61 ± 4.26 | < 0.001 b | 6.92 ± 4.20 | 5.42 ± 4.88 | 0.003 | 48.65 ± 15.96 | 48.10 ± 17.59 | 0.746 | 53.84 ± 16.32 | 55.92 ± 12.96 | 0.180 | 78.89 ± 12.05 | 60.92 ± 9.51 | 0.190 | 59.10 ± 10.76 | 58.59 ± 10.61 | 0.353 | 55.63 ± 19.06 | 61.44 ± 20.47 | 0.007 |
| Diabetes | 0.212 c | 0.272 | 0.464 | 0.164 | 0.670 | 0.091 | 0.103 | ||||||||||||||
| Yes (N = 44) | 7.37 ± 4.34 | 5.73 ± 4.12 | 0.007 b | 6.15 ± 3.73 | 5.44 ± 4.64 | 0.321 | 51.76 ± 17.10 | 49.97 ± 17.39 | 0.349 | 56.38 ± 15.52 | 55.88 ± 14.50 | 0.782 | 62.53 ± 11.07 | 62.28 ± 10.78 | 0.827 | 57.64 ± 9.35 | 57.15 ± 9.84 | 0.576 | 57.69 ± 21.82 | 60.15 ± 22.05 | 0.386 |
| No (N = 95) | 6.89 ± 4.48 | 4.74 ± 4.12 | < 0.001 b | 6.23 ± 4.36 | 4.69 ± 4.78 | 0.001 | 53.41 ± 16.35 | 52.82 ± 18.18 | 0.713 | 56.71 ± 17.20 | 58.75 ± 14.02 | 0.148 | 78.54 ± 11.54 | 63.28 ± 10.85 | 0.207 | 59.98 ± 11.46 | 60.63 ± 10.88 | 0.158 | 56.85 ± 18.39 | 64.23 ± 17.79 | 0.001 |
| P-value d | 0.549 | 0.188 | 0.918 | 0.382 | 0.582 | 0.382 | 0.912 | 0.267 | 0.364 | 0.612 | 0.237 | 0.071 | 0.814 | 0.245 | |||||||
| Hypertension | 0.788 c | 0.653 | 0.356 | 0.447 | 0.880 | 0.376 | 0.784 | ||||||||||||||
| Yes (N = 90) | 7.84 ± 4.38 | 5.44 ± 4.19 | < 0.001 b | 6.81 ± 4.40 | 5.15 ± 4.70 | 0.001 b | 50.36 ± 16.47 | 50.91 ± 17.78 | 0.720 b | 53.78 ± 17.75 | 56.75 ± 14.19 | 0.042 | 78.98 ± 12.13 | 62.95 ± 10.36 | 0.205 | 59.30 ± 11.13 | 59.31 ± 11.03 | 0.984 | 55.73 ± 20.19 | 61.96 ± 20.17 | 0.003 |
| No (N = 45) | 5.59 ± 4.17 | 4.36 ± 3.96 | 0.044 b | 5.10 ± 3.44 | 4.53 ± 4.80 | 0.360 | 57.51 ± 15.84 | 53.73 ± 18.20 | 0.063 | 61.80 ± 12.94 | 59.79 ± 14.11 | 0.216 | 63.04 ± 10.80 | 62.97 ± 11.67 | 0.940 | 59.08 ± 10.40 | 59.87 ± 10.00 | 0.243 | 59.67 ± 18.05 | 64.65 ± 17.62 | 0.102 |
| P-value d | 0.004 | 0.143 | 0.020 | 0.459 | 0.014 | 0.377 | 0.006 | 0.229 | 0.357 | 0.990 | 0.910 | 0.766 | 0.256 | 0.435 | |||||||
| IHD | 0.165 c | 0.487 | 0.477 c | 0.600 | 0.434 | 0.802 | 0.757 | ||||||||||||||
| Yes (N = 74) | 6.67 ± 4.25 | 5.22 ± 4.17 | 0.001 b | 6.20 ± 4.02 | 5.16 ± 4.80 | 0.039 | 54.74 ± 16.83 | 52.44 ± 17.25 | 0.174 | 58.14 ± 16.21 | 58.22 ± 13.38 | 0.952 | 83.89 ± 13.97 | 62.47 ± 11.00 | 0.163 | 59.46 ± 10.83 | 59.62 ± 10.65 | 0.799 | 57.11 ± 18.65 | 62.48 ± 18.34 | 0.029 |
| No (N = 65) | 7.47 ± 4.61 | 4.87 ± 4.10 | < 0.001 b | 6.21 ± 4.33 | 4.67 ± 4.67 | 0.012 | 50.75 ± 16.10 | 51.29 ± 18.76 | 0.767 | 54.86 ± 17.03 | 57.36 ± 15.15 | 0.111 | 61.37 ± 11.87 | 63.52 ± 10.62 | 0.003 | 58.95 ± 10.93 | 59.38 ± 10.73 | 0.431 | 57.14 ± 20.55 | 63.40 ± 20.44 | 0.010 |
| P-value d | 0.289 | 0.617 | 0.986 | 0.549 | 0.157 | 0.706 | 0.248 | 0.723 | 0.173 | 0.569 | 0.785 | 0.896 | 0.993 | 0.782 | |||||||
| LEVF (%) | 0.214 c | 0.716 | 0.939 | 0.955 | 0.661 | 0.789 | 0.575 | ||||||||||||||
| > 50 | 6.97 ± 4.59 | 4.47 ± 3.85 | < 0.001 b | 6.29 ± 4.32 | 4.75 ± 4.65 | 0.003 | 52.56 ± 17.44 | 58.53 ± 18.30 | 0.540 | 54.78 ± 19.06 | 58.12 ± 14.88 | 0.055 | 84.25 ± 13.75 | 63.29 ± 11.27 | 0.185 | 59.58 ± 10.87 | 60.50 ± 10.43 | 0.062 | 56.99 ± 19.25 | 64.19 ± 19.61 | 0.001 |
| 40 - 50 | 6.72 ± 4.21 | 5.30 ± 4.70 | 0.077 b | 5.18 ± 3.97 | 5.00 ± 5.33 | 0.849 | 55.00 ± 14.27 | 53.21 ± 17.39 | 0.454 | 60.30 ± 12.34 | 58.00 ± 15.09 | 0.393 | 64.24 ± 10.56 | 63.69 ± 10.45 | 0.650 | 60.18 ± 10.68 | 59.60 ± 10.63 | 0.450 | 63.76 ± 18.79 | 61.84 ± 18.91 | 0.595 |
| < 40 | 7.52 ± 4.37 | 6.08 ± 4.01 | 0.008 b | 7.02 ± 3.86 | 5.26 ± 4.39 | 0.016 | 51.50 ± 16.95 | 47.08 ± 17.22 | 0.111 | 56.60 ± 14.30 | 57.02 ± 11.99 | 0.926 | 59.15 ± 13.52 | 61.55 ± 10.28 | 0.094 | 57.53 ± 11.06 | 57.32 ± 11.09 | 0.862 | 50.97 ± 19.11 | 61.23 ± 19.32 | 0.008 |
| P-value d | 0.745 | 0.160 | 0.187 | 0.871 | 0.672 | 0.196 | 0.287 | 0.931 | 0.384 | 0.676 | 0.562 | 0.360 | 0.026 | 0.716 | |||||||
| NYHA cardiac function class | 0.002 c | 0.045 | 0.002 | 0.002 | < 0.001 | 0.031 | 0.008 | ||||||||||||||
| I | 5.04 ± 3.73 | 3.14 ± 3.18 | 0.002 b | 4.50 ± 3.96 | 3.14 ± 3.83 | 0.023 | 61.54 ± 16.48 | 61.25 ± 15.37 | 0.871 | 62.40 ± 17.63 | 65.00 ± 13.37 | 0.222 | 96.54 ± 16.42 | 68.50 ± 7.74 | 0.163 | 60.98 ± 11.94 | 61.81 ± 11.63 | 0.212 | 64.73 ± 16.68 | 69.12 ± 16.64 | 0.085 b |
| II | 7.71 ± 4.52 | 4.71 ± 3.85 | < 0.001 b | 6.84 ± 3.59 | 4.76 ± 4.61 | 0.011 | 49.87 ± 14.37 | 53.02 ± 17.20 | 0.150 | 54.18 ± 15.78 | 56.92 ± 14.04 | 0.052 | 57.69 ± 13.05 | 59.82 ± 11.29 | 0.096 | 59.31 ± 10.72 | 60.69 ± 10.23 | 0.015 | 52.77 ± 22.00 | 64.87 ± 18.92 | < 0.001 |
| III | 7.96 ± 4.40 | 6.45 ± 3.86 | 0.044 b | 6.75 ± 4.21 | 6.03 ± 4.82 | 0.406 | 49.03 ± 15.11 | 42.93 ± 17.37 | 0.056 | 54.06 ± 15.56 | 52.54 ± 11.85 | 0.593 | 61.03 ± 11.86 | 60.78 ± 10.46 | 0.839 | 58.70 ± 9.42 | 57.63 ± 9.59 | 0.324 | 57.09 ± 18.41 | 60.36 ± 19.08 | 0.419 |
| IV | 9.15 ± 4.28 | 8.21 ± 4.75 | 0.230 b | 8.26 ± 4.36 | 7.89 ± 5.20 | 0.720 | 43.84 ± 14.74 | 41.57 ± 13.65 | 0.485 | 51.37 ± 14.36 | 50.73 ± 12.97 | 0.791 | 55.74 ± 14.46 | 59.21 ± 12.14 | 0.089 | 55.53 ± 10.24 | 54.52 ± 9.06 | 0.480 | 46.89 ± 15.97 | 47.63 ± 18.86 | 0.885 |
| P-value d | 0.001 | < 0.001 | 0.002 | 0.001 | < 0.001 | < 0.001 | 0.024 | < 0.001 | 0.100 | < 0.001 | 0.317 | 0.046 | 0.002 | < 0.001 | |||||||
Abbreviations: HADS, Hospital Anxiety and Depression Scale; WHOQOL-BREF, World Health Organization's Quality of Life Questionnaire; NYHA, New York Heart Association; LEVF, left ventricular ejection fraction; QOL, quality of life; IHD, ischemic heart disease.
a Values are presented as mean ± SD.
b Paired samples t-test for comparing baseline and follow-up measurement within each cardiac function.
c Independent samples t-test for comparing parameters within each time and between patients with and without that category.
d ANCOVA for assessing the effect of each cardiac function on depressive symptoms, anxiety and QOL.
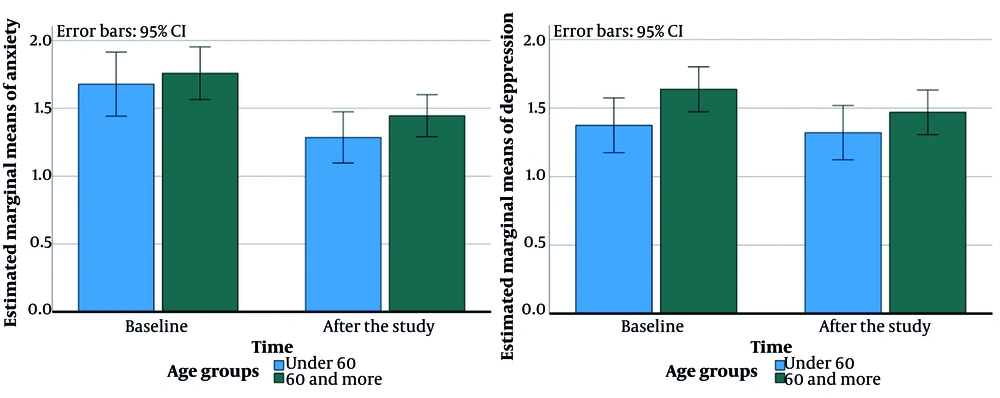
Figure 2.
This figure shows the difference between baseline and follow-up anxiety and depression of the participants based on the age categories (< 60 and ≥ 60 years).
Association of QOL, and anxiety and depressive symptoms with patients' comorbidities, and cardiac function and NYHA class has been presented in Table 3. Follow-up examination showed that patients with NYHA class I had the highest mean score (the best QOL) in subdomains of physical health (P < 0.001), mental health (P < 0.001), social relationships (P < 0.001), environment (P = 0.046) and total QOL score (P < 0.001). In addition to, patients in NYHA class IV had the highest mean score (the worst condition) in anxiety (P < 0.001) and depression (P = 0.001) subscales of the HADS.
Multivariate linear regression model to explore the effect of research variables, including the baseline QOL score, different NYHA classes, levels of LVEF and positive serum troponin on total QOL score during the follow-up period revealed that baseline QOL (beta coefficient = 0.440; P < 0.001) and NYHA class 4 (beta coefficient = -0.318; P < 0.001) significantly reduced the QOL score at follow-up examination of the patients. Also, in the model where the effect of age was adjusted, LVEF at the level of 40 - 50 significantly reduced the overall QOL score at follow-up assessment (beta coefficient = -0.262; P = 0.008).
5. Discussion
Findings showed a significant statistical association between cardiac function assessed by LVEF, and baseline QOL of the patients with ACS. Also, LVEF at the level of 40 - 50 significantly reduced the overall QOL score at follow-up visit. Some previous studies reported similar finding; for example, another research followed 3339 patients with ACS in Netherland concluded that patients admitted for ACS if experience recurrent ischemic or bleeding events would have worse QOL (19). In a research in China, it was observed that LVEF (OR = 0.107, 95% CI: 0.25 - 0.190) can be a predictive factor for depression and QOL of patients in the follow-up period (14). A recent systematic review and meta-analysis study revealed that patients with ACS who receive proper cardiac treatment therapies either percutaneous coronary intervention (PCI) or coronary artery bypass grafting have better QOL compared to those who are not treated (20). Cardiac structure and function, as well as depressive disorders, are important factors that influence the long-term survival and well-being of patients with CAD (21). Previous studies have shown that the structure and function of the heart are closely related to depression. The underlying mechanisms for the association of depressive disorder with LVEF remain unclear. Some evidence found that LVEF affects depressive disorders through the level of N-terminal pro-BNP, a predictor of depression (22). In addition to, cardiac reserve might be decreased due to lack of oxygen supply to the myocardium, and reduction in body aerobic capacity may be a cofactor for incidence of depression.
Patients diagnosed with ACS are at increased risk for occurrence of depression and anxiety. Some of these psychological consequences might be attributed to physical limitation. A longitudinal research among patients diagnosed with ACS classified the participants according to their physical limitation; and revealed a significant effect of physical limitation after ACS on QOL, depression, and anxiety. Higher physical limitation made poorer psychological conditions after ACS (23). A bidirectional association has been found between cardiovascular diseases and psychiatric co-morbidities. Depression has been represented as a major risk factor for CAD. Anxiety has also been linked to negative outcomes of CAD (24). In our research, depression and anxiety symptoms although had better clinical condition in patients with LVEF higher than 50, the difference was not statistically significant. Another study in USA demonstrated no association between LVEF and depression, similar to current research (25). However, a cohort study in China among older adults with average of age > 100 years showed a significant association between LVEF and depressive disorder (14). Different results might be attributed to different baseline characteristics of the research population.
Cardiac function assessed by NYHA class made a significant statistical difference in QOL of the patients; patients with class I of NYHA functional categorization had the best condition of QOL. Also, individuals with this functional class had the best condition of depressive and anxiety symptoms. New York Heart Association classification has been used primarily for categorization of cardiac function in patients with heart failure; and different findings have been reported about its application for predicting the patients' perception about their health status and QOL. A recent study comparing NYHA class and self-reported outcomes among patients hospitalized for heart failure showed that patients who perceived their health status as worse than the clinician's perception had higher mortality (26). In a comparative cohort study in USA included 2872 outpatients with chronic heart failure and reduced ejection fraction, NYHA class has not been representative of clinically meaningful changes in health status over time (27). It seems that patients classified as NYHA I have better objective physiological cardiopulmonary measures, and are expected to have better prognosis and QOL (28).
Based on our results, the average score of QOL was 57; and the physical health, mental, and the living environment components of QOL were significantly different in men and women. Although, no significant difference was observed between the two sexes in the overall QOL score. A cohort study in India included 145 male individuals in the first episode of ACS, and assessed the patients' QOL at various time points following PCI for 12 months. They observed a significant improvement in physical component of QOL over time; however, the mental QOL score improved without reaching statistical significance (29). A nationwide PCI registry in Thailand recruiting 19,701 patients examined different factors that were independently correlated with QOL in this population. Male gender was found to be associated with improved QOL in these people (30). Cardiovascular diseases are associated with deteriorating of QOL, and women appear to have worse QOL, especially at initial days after ACS compared to men (31, 32). Given different applied tools to assess the participants' QOL; various duration of follow-up period, and also, different research endpoint in previous studies, it is not easy to compare their findings. It seems that clinical evolution of cardiac function after hospital discharge contributes to improvement in QOL of these patients.
Current research showed no significant effect of comorbidities including diabetes, hypertension and other chronic disorders on total QOL score of the patients with ACS; and the initial QOL of the patients was recognized as a strong predictive factor for the QOL score in the follow-up period. Contrary to this finding, a nationwide study in Thailand showed that prior cerebrovascular disease, and heart failure decreased the patients' QOL (30). In a research in Brazil, the results showed an association between worse QOL and higher prevalence of comorbidities (32). Difference in study population and setting can justify this various finding.
Substantial evidence reveals that depressive disorder is independently associated with adverse cardiac outcomes in patients with CHD. Even, depression is associated to the development of CAD in healthy individuals without previous cardiovascular disease (33, 34).
The most important limitation of this research is screening of depressive and anxiety symptoms with HADS Questionnaire, and not conducting a structured clinical interview to confirm the diagnosis of depression or anxiety. Also, the participants were followed for two months. Longer time points following the first episode of ACS is recommended for future studies. In addition, as the sampling method of the research was convenience, and also data were collected from a referral hospital in Northern of Iran, the sample may not be representative of the population.
5.1. Conclusions
A significant association was found between LVEF, and baseline QOL with anxiety, depression and the QOL score at follow-up assessment of the patients hospitalized with ACS. Proper screening and subsequently implementation of interventions for patients with ACS who have depressive or anxiety symptoms, and low QOL at baseline examination is recommended; especially, in inpatient health-service cardiology departments.