


1. Background
Child abuse and violence are significant global public health issues that have lasting effects throughout a person’s life (1). The term "poly-victimization" has been developed to describe the situation resulting from both environmental and personality factors, especially those shaped by ongoing hardship. Recent neuroscience studies have found a connection between childhood adversities — often termed poly-victimization — and increased stress levels and hippocampal activity, which further elevates stress (2). Furthermore, a study conducted by Song et al. in 2022 indicates that individuals who experienced violence in childhood are at a greater risk of engaging in violent intimate relationships in adulthood. This suggests a potential link between early exposure to violence and relational patterns in later life (3).
Research shows that some individuals are more susceptible to victimization than others, especially those living in high-risk neighborhoods, those who have been adopted, or individuals raised by single parents (4). The LGBTQ+ community is another vulnerable group, as studies indicate that individuals who do not align with heteronormative societal norms face a higher likelihood of experiencing different types of victimization, including sexual abuse and physical violence (5).
Given the harmful effects of various victimization experiences on mental health, it is crucial to thoroughly investigate the phenomenon of victimization. The psychological impacts of poly-victimization are more significant than those resulting from repeated victimization alone, providing a deeper understanding of the heightened negative psychological effects involved (6). Finkelhor et al. identified five primary categories of poly-victimization: (A) conventional crime, (B) child maltreatment, (C) peer and sibling victimization, (D) sexual victimization, and (E) witnessing and indirect victimization (6).
Many international studies have examined the prevalence of poly-victimization, revealing considerable variability attributed to differences in research methodologies, including timeframes and classification standards, which complicate comparisons across countries (7). A systematic review conducted in 2016 highlighted that the prevalence of poly-victimization varied widely, with rates ranging from 0.3% to 74.7% (8). In a study involving 2,436 children and adolescents aged 13 to 24, 2.2% reported experiencing victimization at least four times. Additionally, 30.9% reported witnessing violence, while 23% experienced direct victimization, primarily from peers and parents (9). A prevalence rate of 33.06% was found in a Canadian study on poly-victimization (10), while a high occurrence of 2.1% was reported by Salmon et al. (11), and 8.6% in Norway (12). In Chile, 21% of children aged 12 - 17 reported experiencing between 4 - 6 instances of victimization, with 16% encountering more than seven instances (13).
Furthermore, emotional intelligence was identified as having an indirect and significant effect on adolescent victimization, particularly in relation to feelings of loneliness (-0.30) and empathy (-0.14) (14). These variations highlight how sociocultural factors influence poly-victimization, emphasizing the need for cross-cultural research to better understand the mechanisms behind global victimization patterns.
The mechanisms connecting different forms of victimization are complex and include cumulative exposure, contextual influences, social identity vulnerabilities, psychological impacts, behavioral responses, systemic factors, and interpersonal dynamics (15). Cumulative exposure theory posits that experiencing multiple victimizations increases one’s vulnerability. Contextual factors, such as neighborhood conditions and family structures, can heighten risks. Social identities, like ethnicity or sexual orientation, can further increase susceptibility (12). The psychological consequences of one form of victimization can lead to further abuses, and maladaptive coping strategies may amplify risks. Systemic issues create environments conducive to multiple victimizations, while interpersonal dynamics can perpetuate cycles of abuse, which underscores the need for comprehensive intervention strategies (16). Consequently, this study aims to explore the phenomenon of poly-victimization in Iran, contributing to a broader understanding of this critical issue.
In Iran, numerous studies have focused on victimization, primarily examining specific types. For instance, a systematic review found that the prevalence of aggression and violence against teenagers ranges from 30% to 65.5%. The findings also indicated that men are 2.5 times more likely to commit acts of violence and aggression than women (17). Another study focused on neglect and abuse, documenting a wide variety of victimization experiences, including humiliation (24.9%) and physical abuse, such as confinement and corporal punishment, which resulted in abrasions and burns that left scars (51.8%) (18).
Poly-victimization, involving multiple forms of victimization, is a significant global public health concern associated with serious mental health effects, such as depression, anxiety, and PTSD (9). The ecological model serves as the theoretical framework for understanding how individual, relational, community, and societal factors shape victimization experiences, distinguishing between direct forms (e.g., physical violence) and indirect forms (e.g., witnessing violence) (1). International studies highlight varying prevalence rates, with emerging research in Iran revealing specific vulnerabilities, particularly among LGBTQ+ individuals, who face heightened risks due to punitive legal frameworks (17). Despite increasing awareness, there are still significant gaps in understanding the prevalence and dynamics of poly-victimization in Iran, indicating a need for focused research and interventions.
This study specifically examines poly-victimization among the marginalized LGBTQ+ community in Iran. A review of the Scientific Information Database (SID) found fewer than 100 studies related to relevant keywords over the past twenty years, most of which portray homosexuality in a negative light. Consequently, the unique challenges and mental health issues faced by LGBTQ+ individuals — including experiences of poly-victimization that may lead to violence — are largely overlooked. The present study aims to highlight the neglected and socially marginalized status of LGBTQ+ individuals in Iran and to illuminate their distinct experiences with poly-victimization.
2. Objectives
Victimization involves both individual and societal aspects, significantly shaped by a country’s legal system and cultural norms. In Iran, a traditional culture coincides with a legal framework based on Sharia principles, creating an environment conducive to victim-blaming and fostering feelings of shame and guilt. These societal factors may obscure the true prevalence of victimization and discourage individuals from seeking help, potentially leading to further trauma. The present study aims to examine how these cultural and legal influences perpetuate the cycle of poly-victimization in Iran (19).
Another focus of this research is impulsivity. Studies have consistently linked impulsivity to a range of behavioral issues, including substance abuse, criminal activity, suicidal behavior, and various psychological disorders such as bipolar disorder. However, there has been limited investigation into the long-term relationship between victimization and impulsivity. The growing recognition of poly-victimization, where individuals face multiple victimization experiences, highlights the importance of understanding its prevalence and effects across different sociocultural contexts.
In Iran, there is a significant gap in research examining the complexities of poly-victimization, despite its substantial impact on mental health and social dynamics. This study aims to address this gap by focusing on three key research questions: (A) What is the prevalence of poly-victimization in the Iranian population? (B) How do rates of poly-victimization differ among various socioeconomic groups and sexual identities? (C) To what degree does poly-victimization predict impulsivity levels? By exploring these questions, this research seeks to provide valuable insights into the relationship between poly-victimization and its diverse effects on individuals from various backgrounds.
3. Methods
3.1. Study Design
The present study was an analytical study with a cross-sectional approach.
3.2. Participants and Sampling Method
A total of 573 Iranian adults aged 18 - 45 were recruited through non-random online sampling. The sample included 146 men, 417 women, and 10 individuals who did not disclose gender. All participants completed the survey in full; there were no exclusions. A post-hoc power analysis using G*Power confirmed that this sample size provides excellent statistical power (1-β > 0.999) for detecting the expected effects in our regression analyses. The mean age was 24.02 years (SD = 5.95). Inclusion criteria were limited to age; participants who completed the Juvenile Victimization Questionnaire (JVQ) (6), and the Barratt Impulsiveness Scale (BIS-11) were included, ensuring the robustness of our findings.
3.3. Instruments
The instruments used in this study included:
3.3.1. Juvenile Victimization Questionnaire
The JVQ, version 2, revised by Finkelhor et al. in 2011, includes various formats such as full, abbreviated, screener sum, and reduced items versions (20). For this study, the screener sum version was utilized for adult self-reports. This version consists of 34 dichotomous items, scored as either zero (no) or one (yes), resulting in a total score ranging from zero to 34, which reflects different victimization experiences. The items are divided into five categories: Conventional crime, child maltreatment, peer and sibling victimization, sexual victimization, and witnessing and indirect victimization, with scores calculated within each category.
In this study, poly-victimization was classified into two categories based on childhood experiences: Low (4 - 7) and high (7+). The JVQ demonstrated excellent psychometric properties, achieving a Cronbach’s alpha of 0.84 in the current study, which aligns with previous validation studies reporting values between 0.80 and 0.94 (21). The questionnaire was translated into Persian, and its face validity was confirmed through expert review and reverse translation.
3.3.2. Barratt Impulsiveness Scale
The BIS, created by Patton et al. in the late 1950s, measures impulsiveness and has progressed to its 11th version, known as the BIS-11, published in 1995 (22). This self-report tool comprises 30 items rated on a four-point Likert scale and evaluates three dimensions: Cognitive impulsivity, motor impulsivity, and non-planning. The BIS-11 exhibits strong psychometric characteristics, with an alpha coefficient of 0.83. Research conducted in Iran also supports its reliability, showing a Cronbach’s alpha of 0.81 and a test-retest reliability of 0.77 (23).
The JVQ (version 2) was translated into Persian and validated for face validity before being formatted for an online survey. The study began in the summer (July to September) of 2023 and targeted volunteers aged 18 to 45, with recruitment invitations shared via social media. Following ethical guidelines, data collection from 573 participants was conducted, resulting in a response and completion rate of 62%. To prioritize participants’ well-being and safeguard their privacy, all data were collected entirely online between mid-summer and mid-autumn. This approach helped ensure anonymity and allowed for a diverse range of demographic backgrounds. Questionnaires were uploaded to an online platform with strategically distributed links across social media channels to maximize outreach. Responses were analyzed using SPSS 26 and AMOS 26, with participants given the option to provide email addresses to receive the study results. To ensure accurate assessment, potential confounders such as socioeconomic status (SES) and sexual orientation were recorded early and controlled for in the analyses, helping to isolate the relationship between impulsivity and childhood poly-victimization while reducing bias.
3.4. Statistical Analysis
Statistical analyses included descriptive statistics, ANOVA, and logistic regression. ANOVA tested group differences in victimization based on SES and sexual orientation, with significance set at P < 0.05. For the regression analysis, only impulsivity dimensions with significant correlations (P < 0.05) were included as predictors.
4. Results
The original JVQ was translated into Persian and initially underwent face validity assessment through expert review and reverse translation. A confirmatory factor analysis revealed that the initial model had a poor fit, primarily due to several items with low factor loadings. We addressed this by removing problematic items (with loadings below 0.4) and allowing covariance between some overlapping items to improve the model. The revised model demonstrated acceptable fit indices, including a chi-square to degrees of freedom ratio of 1.98, GFI of 0.94, CFI of 0.91, and RMSEA of 0.04, indicating a good fit.
Regarding reliability, the revised JVQ showed strong internal consistency, with a Cronbach’s alpha of 0.84 for the total victimization score. Subscale analysis revealed acceptable reliability for sexual victimization (α = 0.71) and conventional crimes (α = 0.69), although some subscales like child maltreatment and peer victimization had lower alpha values below 0.70. Overall, these results support the psychometric robustness of the Persian version of the JVQ, ensuring it is a valid and reliable tool for assessing childhood victimization in our sample.
Table 1 presents the demographic characteristics of the study participants, categorized by their victimization levels. The table details variables such as gender, education, SES, family background, and occupational status, providing a comprehensive overview of the sample.
Table 1.Demographic Characteristics by Victimization Level
| Variables | Low Victimization (N = 313) | High Victimization (N = 260) | Total (N = 573) | P-Value of Chi-Square Test |
|---|---|---|---|---|
| Gender | 0.155 | |||
| Male | 70 (22.4) | 76 (29.2) | 146 (25.5) | |
| Female | 238 (76) | 179 (68.8) | 417 (72.8) | |
| Prefer not to say | 5 (1.6) | 5 (1.9) | 10 (1.7) | |
| Education level | 0.128 | |||
| High school | 1 (0.3) | 5 (1.9) | 6 (1.0) | |
| High school diploma | 121 (38.7) | 99 (38.1) | 220 (38.4) | |
| Associate degree | 19 (6.1) | 25 (9.6) | 44 (7.7) | |
| Bachelor | 100 (31.9) | 85 (32.7) | 185 (32.3) | |
| Master | 51 (16.3) | 36 (13.8) | 87(15.2) | |
| Ph.D. | 21 (6.7) | 10 (3.8) | 31 (5.4) | |
| Marital status | 0.263 | |||
| Single | 235 (75.1) | 187 (71.9) | 422 (73.6) | |
| Married | 33 (10.5) | 36 (13.8) | 69 (12.0) | |
| In relationship | 40 (12.8) | 28 (10.8) | 68 (11.9) | |
| Divorced | 5 (1.6) | 9 (3.5) | 14 (2.4) | |
| Birth order | 0.122 | |||
| First | 150 (47.9) | 100 (38.5) | 250 (43.6) | |
| Second | 78 (24.9) | 68 (26.2) | 146 (25.5) | |
| Third | 33 (10.5) | 34 (13.1) | 67 (11.7) | |
| Fourth or more | 29 (9.3) | 38 (14.6) | 67 (11.7) | |
| Only child | 23 (7.3) | 20 (7.7) | 43 (7.5) | |
| SES | < 0.001 | |||
| Low | 28 (8.9) | 46 (17.7) | 74 (12.9) | |
| Mid-low | 80 (25.6) | 85 (32.7) | 165 (28.8) | |
| Mid | 132 (42.2) | 98 (37.7) | 230 (40.1) | |
| Mid-high | 68 (21.7) | 31 (11.9) | 99 (17.3) | |
| High | 5 (1.6) | 0 (0.0) | 5 (0.9) | |
| Sexual orientation | 0.354 | |||
| Heterosexual | 239 (76.4) | 199 (76.5) | 438 (76.4) | |
| Homosexual | 10 (3.2) | 12 (4.6) | 22 (3.8) | |
| Bisexual | 45 (14.4) | 38 (14.6) | 83 (14.5) | |
| Transgender | 1 (0.3) | 3 (1.2) | 4 (0.7) | |
| Other minorities | 18 (5.8) | 8 (3.1) | 26 (4.5) | |
| Father education | < 0.001 | |||
| High school | 75 (24) | 109 (41.9) | 184 (32.1) | |
| High school diploma | 84 (26.8) | 75 (28.8) | 159 (27.7) | |
| Associate degree | 25 (8) | 10 (3.8) | 35 (6.1) | |
| Bachelor | 67 (21.4) | 38 (14.6) | 105 (18.3) | |
| Master | 36 (11.5) | 17 (6.5) | 53 (9.2) | |
| Ph.D. or higher | 26 (8.3) | 11 (4.2) | 37 (6.5) | |
| Mother education | < 0.001 | |||
| High school | 90 (28.8) | 123 (47.3) | 213 (37.2) | |
| High school diploma | 94 (30) | 72 (27.7) | 166 (29) | |
| Associate degree | 15 (4.8) | 13 (5) | 28 (4.9) | |
| Bachelor | 72 (23) | 38 (14.6) | 110 (19.2) | |
| Master | 33 (10.5) | 12 (4.6) | 45 (7.9) | |
| Ph.D. or higher | 9 (2.9) | 2 (0.8) | 11 (1.9) | |
| Father occupation | < 0.001 | |||
| Unemployed | 8 (2.6) | 17 (6.5) | 25 (4.4) | |
| Governmental employee | 71 (22.7) | 31 (11.9) | 102 (17.8) | |
| Non-governmental employee | 18 (5.8) | 14 (5.4) | 32 (5.6) | |
| Self-employed | 107 (34.2) | 109 (41.9) | 216 (37.7) | |
| Housekeeper | 0 (0) | 2 (0.8) | 2 (0.3) | |
| Retiree | 89 (28.4) | 60 (23.1) | 149 (26) | |
| Dead | 20 (6.4) | 27 (10.4) | 47 (8.2) | |
| Mother occupation | < 0.001 | |||
| Unemployed | 1 (0.3) | 6 (2.3) | 7 (1.2) | |
| Governmental employee | 49 (15.7) | 13 (0.5) | 62 (10.8) | |
| Non-governmental employee | 9 (2.9) | 5 (1.9) | 14 (2.5) | |
| Self-employed | 18 (5.8) | 19 (7.3) | 37 (6.5) | |
| Housekeeper | 190 (60.7) | 189 (72.7) | 379 (66.1) | |
| Retiree | 37 (11.8) | 22 (8.5) | 59 (10.3) | |
| Dead | 9 (2.9) | 6 (2.3) | 15 (2.6) |
Abbreviation: SES, socioeconomic status.
a Values are expressed as No. (%).
As indicated in Table 1, the data show that the sample was predominantly young, with a mean age of 24.02 years (SD = 5.95), and mainly female, comprising 72.8% of participants. Approximately 40% identified as middle class, but there were significant differences in SES between low and high victimization groups, with a P-value of less than 0.001. The gender distribution, however, did not differ significantly between the groups (P = 0.155), indicating that males and females experienced similar levels of victimization. On the other hand, parental education levels varied notably; participants whose parents had completed high school or higher were more common in the low victimization group, suggesting a protective effect of higher parental education, which was statistically significant (P < 0.001). Occupational status also differed significantly, with higher unemployment rates among individuals in the high victimization group (P < 0.001). Specifically, lower parental education and certain occupational statuses — such as unemployment — are associated with increased victimization risk.
The chi-square analysis underscores that socioeconomic disadvantages, including lower socioeconomic class (notably the low and mid-low categories), and parental education are strongly linked to higher victimization levels. Conversely, variables such as gender, marital status (P = 0.263), and sexual orientation (P = 0.354) did not show significant differences, pointing to their limited influence within this population. Interestingly, the occupation of mothers as housekeepers was significantly more common among those with higher victimization (P < 0.001). Overall, these findings highlight that socioeconomic and familial factors — particularly parental education and employment status — play a crucial role in victimization risk, whereas demographic variables like gender and sexual orientation have less bearing according to the statistical analysis.
The JVQ found that 99.3% of participants had experienced victimization at least once, averaging 11.95 incidents reported during childhood (mode: 9; SD: 5.99; variance: 35.90; range: 0 - 34). Because the victimization rates were similar across genders, all 573 participants were analyzed together. Those reporting seven or more incidents of victimization were classified as experiencing "high poly-victimization", indicating a significantly higher average than in other similar studies. Figure 1 displays the victimization ratio within the overall population.
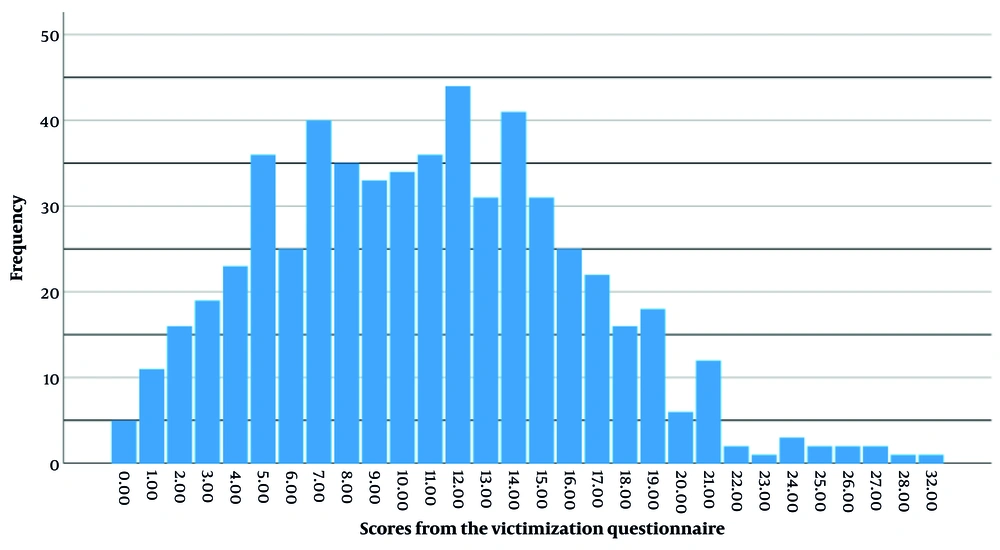
Figure 1.
Frequency distribution of Victimization Questionnaire scores
The JVQ revealed that an overwhelming 99.3% of participants had experienced victimization at least once, with an average score of 11.95 on the questionnaire — reflecting the total reported incidents during childhood. The most common score was 9, and the responses varied, with a standard deviation of 5.99 and a range from 0 to 34. Since victimization rates were similar across genders, data from all 573 participants were combined for analysis. Participants who reported seven or more incidents were classified as experiencing "high poly-victimization", a level that indicates a notably higher average compared to similar studies. Figure 1 presents the frequency distribution of the scores on the victimization questionnaire, illustrating how common each level of victimization was across the entire sample.
Victimization encompasses five subcategories compared with SES in Table 2 and with sexual orientations in Table 3. According to Table 2 ,80.6% of participants experienced victimization seven or more times during childhood, classifying them as part of the high poly-victimization group, while 11.7% reported 4 to 7 times, and 7.6% experienced fewer than 4 incidents. The table highlights the relationship between poly-victimization and SES, revealing significant differences supported by the ANOVA results. The total victimization score varies markedly across SES categories [P < 0.001, F(4,568) = 44.5], with individuals in the low and middle-low SES groups reporting higher scores than those in middle-high and high SES groups, indicating that lower SES is associated with more frequent victimization.
Table 2.Prevalence of Poly Victimization and Its Related Categories to Socioeconomic Status a
| Variables | SES | No. (%) | P-Value | ||||
|---|---|---|---|---|---|---|---|
| Low | Middle- Low | Middle | Middle-High | High | |||
| Poly victimization | |||||||
| ≥ 7 times b | - | - | - | - | - | 454 (80.6) | - |
| 4 - 7 times c | - | - | - | - | - | 66 (11.7) | - |
| < 4 times d | - | - | - | - | - | 43 (7.6) | - |
| Total | - | - | - | - | - | 563 (100.0) | - |
| Conventional crime | 7.78 ± 2.02 | 63.42 ± 1.82 | 3.10 ± 1.92 | 3.01 ± 2.04 | 2.40 ± 0.89 | 2.74 e | 0.028 |
| Child maltreatment | 1.90 ± 1.27 | 1.83 ± 1.13 | 1.52 ± 1.06 | 1.34 ± 1.13 | 0.60 ± 0.89 | 5.61 f | < 0.001 |
| Peer and sibling | 2.32 ± 1.38 | 2.13 ± 1.40 | 1.85 ± 1.36 | 1.78 ± 1.41 | 1.80 ± 1.30 | 2.65 e | 0.032 |
| Sexual | 2.18 ± 1.88 | 1.96 ± 1.85 | 1.62 ± 1.66 | 1.58 ± 1.88 | 1.20 ± 0.84 | 2.26 | 0.061 |
| Witnessing and indirect | 2.55 ± 1.67 | 2.34 ± 1.42 | 2.06 ± 1.52 | 2.08 ± 1.68 | 2.00 ± 0.71 | 1.95 | 0.101 |
| Total score | 12.74 ± 5.57 | 11.68 ± 5.16 | 10.17 ± 5.30 | 9.79 ± 6.14 | 8.00 ± 1.22 | 5.44 f | < 0.001 |
Abbreviation: SES, socioeconomic status.
a Values are expressed as mean ± SD unless otherwise indicated.
b More than 7 times: High poly victims.
c 4 to 7 times: Low poly victims.
d Less than 4 times: Non-poly victims.
e P < 0.05.
f P < 0.01.
Table 3.Types of Victimization and Sexual Orientations a
| Variables | Sexual Orientation | N | P-Value | ||||
|---|---|---|---|---|---|---|---|
| Heterosexual | Homosexual | Bisexual | Transgender | Other | |||
| Victimization | |||||||
| Conventional crime | 3.27 ± 1.97 | 3.73 ± 1.91 | 3.14 ± 1.59 | 4.75 ± 2.99 | 2.85 ± 2.03 | 1.29 | 0.272 |
| Child maltreatment | 1.61 ± 1.16 | 1.82 ± 0.91 | 1.57 ± 1.05 | 3.00 ± 0.00 | 1.58 ± 1.27 | 1.67 | 0.149 |
| Peer and sibling | 2.01 ± 1.40 | 2.04 ± 1.17 | 1.96 ± 1.44 | 3.00 ± 1.15 | 1.31 ± 1.26 | 2.13 | 0.075 |
| Sexual | 1.67 ± 1.76 | 2.32 ± 1.70 | 2.16 ± 1.87 | 4.75 ± 1.71 | 1.38 ± 1.58 | 5.02 b | 0.001 |
| Witnessing and indirect | 2.21 ± 1.56 | 2.23 ± 1.60 | 2.17 ± 1.46 | 3.25 ± 1.50 | 2.23 ± 1.39 | 0.47 | 0.759 |
| Total score | 10.77 ± 5.60 | 12.14 ± 4.92 | 11.00 ± 5.03 | 18.75 ± 6.55 | 9.35 ± 5.15 | 2.91 b | 0.021 |
a Values are expressed as mean ± SD.
b P < 0.05.
When breaking down the data into subcategories, significant differences emerge for conventional crime (P = 0.028), child maltreatment (P < 0.001), and peer and sibling victimization (P = 0.032). For instance, children from low SES backgrounds have higher mean scores in these areas, with P-values confirming that these differences are statistically meaningful. Notably, child maltreatment scores exhibited a large variance, with a mean of 1.90 and an SD of 1.27 for the low SES group, and the difference was highly significant (P < 0.001). These findings underscore that victims from lower socioeconomic backgrounds are more vulnerable to multiple forms of victimization, emphasizing the critical link between SES and victimization prevalence.
Table 3 assesses how victimization types differ according to sexual orientation, revealing notable variations in sexual victimization and total victimization scores. The ANOVA analysis indicates that sexual victimization significantly differs across orientations (F = 5.02, P = 0.001), with transgender and bisexual individuals reporting higher mean scores (e.g., 4.75 and 2.16, respectively) compared to heterosexuals (mean = 1.67). The total victimization score also shows significant differences by sexual orientation (F = 2.91, P = 0.021); transgender and bisexual participants report considerably higher overall victimization, while heterosexuals and other orientations report lower scores. No significant differences were observed in categories like conventional crime, child maltreatment, peer and sibling victimization, or witnessing/indirect exposure, since their P-values all exceeded 0.05. These findings suggest that sexual minority groups are disproportionately affected by sexual victimization and overall victimization, and these differences are statistically significant, highlighting the importance of considering sexual orientation in victimization research.
The LSD test (Appendix 1) found that overall victimization scores were significantly lower in low and very low socioeconomic groups than in moderate and high groups (P < 0.05). Appendix 1. The results of the LSD post-hoc test for SES and types of victimization. Conventional crimes were found to be more common in low socioeconomic groups (P < 0.01). Child maltreatment was significantly more prevalent in low and very low socioeconomic groups compared to moderate, high, and very high groups (P < 0.05). Additionally, peer and sibling victimization was considerably higher in low socioeconomic groups than in moderate and high groups (P < 0.01). Other pairwise comparisons did not reveal significant differences (P > 0.05). The study also examined the prevalence of victimization based on sexual orientation and type, as outlined in Tables 4 and 5.
Table 4.Mean, Standard Deviation, Skewness, and Kurtosis of Study Variables and Correlation of Impulsivity and Victimization
| Variables | Mean ± SD | Skewness | Kurtosis | ||
|---|---|---|---|---|---|
| Statistic | Standard Error | Statistic | Standard Error | ||
| Total victimization score | 11.94 ± 5.99 | 0.297 | 0.102 | -0.143 | 0.204 |
| Cognitive impulsivity | 19.74 ± 4.51 | 0.068 | 0.102 | -0.658 | 0.204 |
| Motor impulsivity | 21.19 ± 4.79 | 0.555 | 0.102 | 0.086 | 0.204 |
| Non-planning | 24.66 ± 4.45 | 0.068 | 0.102 | -0.216 | 0.204 |
ANOVA results presented in Table 3 indicated significant variations in poly-victimization [P = 0.021, F(4,568) = 91.2] and sexual victimization [P < 0.001, F(4,568) = 2.5] across different sexual orientations (P < 0.05). Transgender individuals reported significantly higher levels of both poly-victimization and sexual victimization (P < 0.05) than those of other orientations, while bisexual individuals also experienced elevated levels of sexual victimization (P = 0.022). Moreover, transgender individuals faced more maltreatment than bisexuals (P < 0.05). No significant differences were found among the other orientations (P > 0.05).
A regression analysis examining the relationship between impulsivity and victimization is detailed in Table 4.
Appendix 2 showed the results of the LSD post-hoc test for sexual orientations and types of victimization multiple comparisons (P < 0.05). Appendix 2. The results of the LSD post-hoc test for sexual orientations and types of victimization multiple comparisons.
Table 6 presents the results of a logistic regression analysis aimed at identifying which dimensions of impulsivity predict victimization status, specifically distinguishing between individuals with fewer than 12 versus 12 or more victimization incidents. The table highlights the significance and strength of each impulsivity component’s influence on victimization.
Table 6.Summary of Logistic Regression Results for Predicting Victimization (Dependent Variable: High vs. Low)
| Variables | B (SE) | Wald χ2 | P-Value | OR (95% CI) | Interpretation |
|---|---|---|---|---|---|
| Cognitive impulsivity | 0.063 (0.022) | 8.52 | 0.004 | 1.065 (1.020 - 1.112) | Each unit increase raises odds of victimization by 6.5%. |
| Motor impulsivity | 0.061 (0.022) | 7.54 | 0.006 | 1.063 (1.018 - 1.110) | Each unit increase raises odds by 6.3%. |
| Non-planning impulsivity | -0.021 (0.023) | 0.88 | 0.348 | 0.979 (0.936 - 1.024) | Not statistically significant |
| Constant | -2.222 (0.554) | 6.10 | < 0.001 | 0.108 | Baseline odds when predictors are zero |
Abbreviation: OR, odds ratio.
The logistic regression results in Table 6 show that two impulsivity dimensions — cognitive and motor impulsivity — are significant predictors of victimization. Specifically, for each one-unit increase in cognitive impulsivity, the coefficient (B) is 0.063 (SE = 0.022), resulting in an odds ratio (OR) of 1.065 (P = 0.004). This indicates that each additional point in cognitive impulsivity increases the odds of being highly victimized by approximately 6.5%. Similarly, for motor impulsivity, B is 0.061 (SE = 0.022), with an OR of 1.063 (P = 0.006), implying a 6.3% increase in odds per unit increase. Conversely, non-planning impulsivity did not significantly predict victimization (B = -0.021, SE = 0.023, P = 0.348), suggesting it does not contribute substantially to the model. The overall fit of the model was adequate [χ2(3) = 27.813, P < 0.001], but it explained only a small portion of the variance (Nagelkerke R2 = 0.063). The classification accuracy improved from 54.6% in the null model to 60.7%, although the model demonstrated limited sensitivity (42.7%) and better specificity (75.7%), indicating it is more effective at correctly predicting non-victims than victims.
5. Discussion
The present study aimed to evaluate the prevalence of poly-victimization and its various manifestations within the youth and adult populations of Iran. Additionally, the research sought to examine its prevalence among different societal subgroups, particularly those defined by SES and sexual orientation. Investigating poly-victimization is essential as it provides a fresh perspective on individual victimization, viewing it not as isolated incidents but as a phenomenon that merits thorough examination. Participants in this research were asked about their childhood experiences, and the findings were analyzed accordingly.
The results revealed that at least 99.3% of individuals reported experiencing victimization, with 92.4% categorized as poly-victims, defined as those experiencing victimization at least four times during childhood. These rates significantly contrast with findings from similar studies; for instance, in China, 71% reported experiencing at least one form of victimization, while the prevalence of poly-victimization was 14% (24). In Mexico, 85.5% reported victimization at least once, with an average frequency of 4.1 incidents (25). Moreover, Iran’s prevalence of victimization is higher than in many low-income countries, where poly-victimization rates have been reported as high as 74.7% (8).
These findings suggest that the rates of poly-victimization in Iran surpass global averages. They indicate that individuals are significantly affected by social and environmental factors, resulting in considerable exposure to victimization. This issue carries substantial social and clinical significance due to the negative consequences of victimization, which can include internal issues such as depression and anxiety, as well as external factors like self-harm (26, 27), in addition to physical health problems (28). The high prevalence of victimization may lead to serious repercussions.
The elevated rates of victimization in Iran may stem from a societal lack of attention and awareness, particularly within families and schools, regarding the importance of mental health and adequate education about harmful behaviors that contribute to individuals being perceived as victims. Research has shown that families can play a protective role against the effects of victimization (16).
Additionally, increasing societal and economic pressures in recent decades have been associated with the rise and intensification of risk factors for victimization. The findings of this study indicate that individuals with lower SES experienced higher levels of victimization (Table 3). This trend is particularly notable for conventional crime, which tends to be more prevalent in economically disadvantaged neighborhoods. The average frequency of conventional crime was higher than that of other types of victimization. Moreover, various forms of victimization were also more common among individuals with lower SES. These results are consistent with previous studies showing that poverty significantly contributes to increased victimization rates (15). Marginalized individuals face greater injustices, receive less support, and experience higher levels of victimization, including conventional crimes (29).
Sexual and gender minority groups represent another vulnerable population that is particularly susceptible to behaviors leading to victimization (30). In this study, these groups made up approximately 23.3% of individuals within the LGBT community. Members of these groups frequently encounter harassment and abuse due to their sexual orientation, making them victims in multiple ways. Additionally, the study found that transgender individuals are more likely to experience harmful behaviors than other sexual minority groups and are at an increased risk of victimization. Specifically, transgender individuals reported significantly higher levels of sexual victimization compared to other groups. The victimization of adolescents and young people who identify as homosexual, bisexual, or transgender can hinder their developmental resources, resulting in mental health issues in adulthood (24). These findings are in line with previous research indicating that transgender individuals are more vulnerable to poly-victimization than others (31).
The current study also seeks to examine how victimization predicts impulsivity. The results show that victimization has a slight predictive effect on impulsivity, affecting both non-cognitive and motor impulsivity in a similar manner. This finding is consistent with an earlier study (32). Given the established importance of impulsivity in conditions such as bipolar disorder, depression, and suicidal behavior, it is vital to address the impulsive tendencies of victims. Focusing on these aspects can help mitigate the negative effects of impulsivity and enhance the long-term outcomes for victims (32).
However, the use of self-reported measures, including the JVQ and the BIS-11, may introduce biases among participants, which could affect the classification of poly-victimization. Additionally, how individuals report their SES can influence the perceived prevalence of victimization. Recall bias may also pose a challenge, as adults reflecting on their childhood experiences could distort data accuracy. Furthermore, non-randomized sampling presents various limitations, such as potentially excluding individuals without access to social media and leading to bias. The collected sample may not adequately represent the diversity of Iranian culture, which might result in exaggerated victimization rates in specific regions of Western Iran.
Future research should incorporate longitudinal studies, clinical interviews, more precise criteria for victimization, and larger, more diverse samples spanning different age groups to deepen the understanding of poly-victimization in Iran.
5.1. Conclusions
This study highlights the alarming rates of poly-victimization in Iran, with 99.3% of participants reporting some form of victimization and 92.4% classified as poly-victims. These figures are higher than global averages, suggesting considerable influences from social and environmental factors, especially among lower socioeconomic groups and sexual minorities. The findings underscore the urgent need for enhanced awareness and education regarding mental health and strategies for preventing victimization. They also emphasize the necessity of addressing impulsivity in victims to alleviate long-term negative consequences.
This research offers vital insights for policymakers and clinical practitioners in developing intervention programs to prevent poly-victimization. Key developmental implications include the establishment of early intervention initiatives specifically designed for vulnerable populations, particularly children and adolescents, to foster resilience and mitigate long-term psychological issues such as anxiety and PTSD. Additionally, promoting collaboration across disciplines among mental health professionals, educators, and community leaders is crucial for implementing comprehensive support strategies. Ultimately, this research can guide policy efforts that strengthen legal protections and social support for marginalized communities, thereby encouraging healthier developmental outcomes.


