


1. Background
The increasing development of technology and almost universal access to the Internet have made smartphones an integral part of everyone's life (1, 2). The number of users of these technologies has increased rapidly in recent years, especially among Generation Z, who were born from the mid-1990s onwards (3), between 1997 and 2012 (4), leading to problems (5-7), particularly in face-to-face communications and interactions (8). Researchers have called this behavior “phubbing” (9), which refers to the act of snubbing someone in a social environment by looking at the phone instead of paying attention to the person (10, 11). As a novel and dangerous form of technology addiction, especially since 2019, when classes and courses were held online due to the COVID-19 outbreak (8), phubbing has become a social norm (11). Now, the question arises as to what factors could be effective in the occurrence of this phenomenon. Addiction has been the focus of many studies (12). Over half of Generation Z spend nine hours or more using the Internet (13). In Internet addiction, the individual continues excessive Internet use without control until experiencing problematic consequences (14). Karadağ et al. showed that Internet addiction could be a strong predictor of phubbing (15). Swathe and Mayur, Rao et al., and Choi et al. regarded Internet addiction as a factor for nomophobia and smartphone addiction due to the availability of online content (16-18). According to the theory of compensatory Internet use, people try to alleviate negative emotional states such as loneliness, boredom, fear of missing out, and problematic smartphone use through technology engagement (14, 19). Gijwani et al. and Rahman et al. showed that psychological factors led to Internet addiction, subsequent dependence on mobile phones (as a mediating variable), and ultimately, phubbing as a way to find peace and escape from anxiety. In students, this phenomenon represents the desire to escape exhaustion, anxiety, and boredom related to academic pressures (20, 21). On the other hand, the fear of missing out (FOMO) is one of the reasons for using social networks, representing anxiety and unease about how others might be having more rewarding experiences than oneself (22), potentially controlling or regulating this anxiety by checking on others via smartphones (23). Gürbüz et al., Nasr et al., and Bernard stated that Generation Z students often experience FOMO and then smartphone addiction (24-26). Davey et al. also identified Internet addiction and FOMO as some of the most significant predictors of phubbing among young people (27). Abi Doumit et al., Meng and Xuan, and Al-Saggaf and O'Donnell, mentioned boredom as an influential factor in causing the phubbing phenomenon (19, 28, 29). This unpleasant feeling is common among students, representing a negative and debilitating emotion associated with experiences such as low-level physiological arousal, perceived lack of cognitive stimulation, task-irrelevant thoughts (e.g., daydreaming), and impulses to escape from the inducing situation (30), imposing adverse effects on the learning process (31). Lv et al., Barry, and Al-Saggaf identified FOMO and student burnout as predictors of phubbing (32-34). Research by Treviño Benavides et al., Sadeghi Bimorgh et al., and Mason et al. showed that Internet and smartphone addiction could lead to student fatigue and academic burnout (35-37). Bayrami et al. and Elhai et al. considered FOMO to be a predictive factor for time spent on mobile phones and related to anxiety and depression (22, 38). It is worth noting that smartphone addiction in Generation Z is as concerning as drug addiction (39). Savci and Aysan found that the greatest impact on social communication was caused by Internet addiction, followed by smartphone addiction (40). However, the recent outbreak of the COVID-19 pandemic and the implementation of social quarantines led to increased use of communication and information technology tools, especially among young people who had to use smartphones and computers frequently for education and work. Thus, dependence on the Internet, smartphones, and the consequences thereof will not be far-fetched. Generation Z (digital natives) has witnessed the advancement of the Internet and technology, making it necessary to know their preferences and expectations to meet their needs adequately (41).
2. Objectives
The question arises whether the variables affecting the phubbing phenomenon would be different depending on the context in which this generation was brought up. Considering the above discussion and the importance of the phubbing phenomenon, it is essential to conduct further studies on the role of related variables in its occurrence to alleviate its complications. A review of the literature shows numerous studies within the scope of the present study; however, no research has examined these variables in Generation Z students within a coherent model, highlighting the necessity of the present study. Hence, the question arises whether the structural model of phubbing based on Internet addiction, personality traits, and fear of missing out, mediated by smartphone addiction and academic boredom, fits Generation Z students. Figure 1 presents the research model as follows:
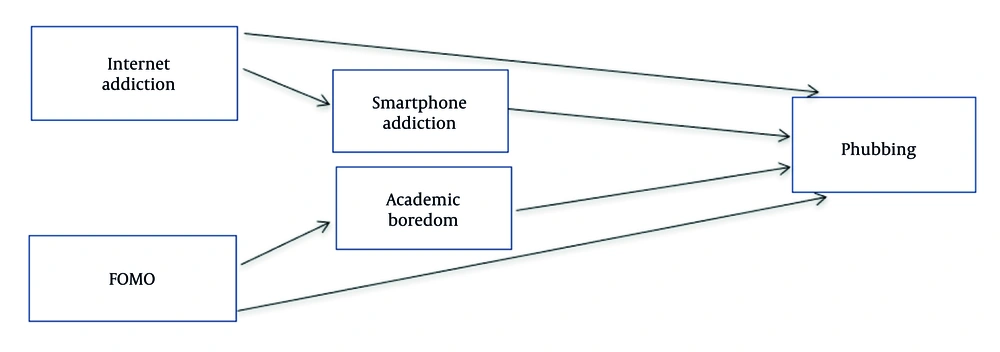
Figure 1.
Research conceptual model (based on the theoretical and empirical foundations of the study)
3. Methods
The research employed a cross-sectional design in which a structural equation model was fitted to explore the correlation among variables within a causal framework. The statistical population consisted of all Generation Z students enrolled at Islamic Azad University branches in Tehran during the second semester of the academic year 2023 - 2024. The survey was conducted using a questionnaire after collecting the preliminary data and searching scientific databases. The sample size was determined according to structural equation modeling (SEM) principles and rules related to sampling adequacy. To estimate the sample size of the structural equation model, Klein (2010) and Lohlin (2004) believe that the appropriate sample size depends on the number of observed variables and conceptual model relationships, and a sample size of < 100 would be inappropriate and > 200 would be desirable to estimate the sample size of a structural equation model. The sample size must be at least 20 times the number of observed variables to be consistent with the structural equation model (42, 43). Considering the number of 10 variables studied, and assigning a coefficient of 25 to each variable, and taking into account the possibility of incomplete questionnaires or subject dropout, and also to increase the generalizability of the results of the present study, considering that after inquiring from the central organization and branches of Islamic Azad University in Tehran, the number of students was more than 100,000, therefore, 600 people were considered as the desired sample. Owing to the absence of a complete list of the study population, a multi-stage cluster sampling method was applied. In the first stage, six branches of the Islamic Azad University in Tehran were selected as the initial clusters, namely the Science and Research Branch, Central Tehran Branch, North Tehran Branch, South Tehran Branch, East Tehran Branch, and West Tehran Branch. Initially, the various faculties of the university were identified. Subsequently, a number of these faculties were randomly selected, followed by the selection of several classes within them. Finally, in each selected class, students who met the inclusion criteria were chosen for participation in the study. The inclusion criteria included informed consent, an age range of 12 to 29 years, and being a student at Islamic Azad University in Tehran. Exclusion criteria included the subject's unwillingness to cooperate and an age of less than 12 or greater than 29. Participants received explanations about the study objectives and declared verbal consent before the questionnaire administration. Response to the questionnaires was completely voluntary. After initial review and removal of incomplete, invalid, and missing data, 556 questionnaires were obtained.
3.1. Statistical Analysis
Following a typical descriptive statistical analysis, a structural equation modeling technique was applied to the acquired database. Before the analysis, the database was evaluated to ensure it met the assumptions of outliers, multicollinearity, normality, and linearity. All assumptions were met. Therefore, SEM was performed. Phubbing as a latent variable was measured by indicators of nomophobia, interpersonal conflict, self-isolation, and problem acknowledgment; smartphone addiction as a latent variable was measured by indicators of creativity loss, tendency, and loneliness. Internet addiction, fear of missing out, and academic boredom were also measured. The obtained data were analyzed using SPSS.29 and AMOS 24 software.
3.2. Research Tools
3.2.1. Generic Scale of Phubbing (GSP)
This 15-item scale was developed by Chotpitayasunondh et al. in 2018 and has subscales of nomophobia, interpersonal conflict, self-isolation, and problem acknowledgment. Cronbach's alpha was 0.93 for the entire questionnaire and 0.84, 0.87, 0.83, and 0.82 for the mentioned subscales, respectively (44). Adequate validity and reliability were also reported in the Iranian population (45).
3.2.2. Internet Addiction Test (IAT)
The Internet Addiction Test by Kimberly Young is one of the most utilized diagnostic instruments for Internet addiction, designed with 20 items (36). A total score of 20 - 49 represents a mild addiction, 50 - 79 moderate addiction, and 80 - 100 severe addiction (46). The validity and reliability of the questionnaire were confirmed with a Cronbach's alpha of 0.70 (47). In one study reported values of 0.81 and 0.62 for the concurrent and discriminant validities, respectively (46).
3.2.3. Fear of Missing Out Scale (FOMO)
3.2.4. Mobile Phone Addiction
This 13-item questionnaire was developed by Sevari in 2013 and measures three factors: Creativity loss (7 questions), tendency (3 questions), and loneliness (3 questions). The questionnaire had good reliability, validity, and fit in terms of psychometric properties, and the confirmatory factor structure also supported the three-factor model of this questionnaire (49).
3.2.5. Academic Boredom Survey Instrument (ABSI)
This 10-item questionnaire was designed by Sharp et al., who reported reliability values of 0.93 using Cronbach's alpha and 0.87 using the test-retest method after 2 weeks. The tool's validity was also favorable using exploratory and confirmatory factor analysis methods (50). Abed et al. reported satisfactory results for the validation of this tool in the Iranian population (51).
4. Results
In this study, 421 female students (75.7%) and 135 male students (24.3%) participated, with a mean age of 21.60 years and a standard deviation of 2.75 years (age range 18 to 29 years). Of the 556 students, 52 (9.3%) were studying at the associate's level, 388 (69.8%) at the bachelor's level, and 116 (20.9%) at the master's and doctoral levels.
Table 1 shows the mean, standard deviation, and correlation coefficients among variables.
Table 1.Mean, Standard Deviation, and Correlation Matrix of Research Variables
| Research Variables | 1 | 2 | 3 | 4 | 5 | 6 | 7 | 8 | 9 | 10 |
|---|---|---|---|---|---|---|---|---|---|---|
| 1. Internet addiction | - | |||||||||
| 2. Fear of missing out | 0.48 a | - | ||||||||
| 3. Academic boredom | 0.44 a | 0.52 a | - | |||||||
| 4. Smartphone addiction: Creativity loss | 0.67 a | 0.41 a | 0.37 a | - | ||||||
| 5. Smartphone addiction: Tendency | 0.54 a | 0.30 a | 0.42 a | 0.49 a | - | |||||
| 6. Smartphone addiction: Loneliness | 0.49 a | 0.45 a | 0.38 a | 0.44 a | 0.38 a | - | ||||
| 7. Phubbing: Nomophobia | 0.46 a | 0.33 a | 0.29 a | 0.48 a | 0.32 a | 0.35 a | - | |||
| 8. Phubbing: Interpersonal conflict | 0.62 a | 0.24 a | 0.36 a | 0.51 a | 0.41 a | 0.30 a | 0.51 a | - | ||
| 9. Phubbing: Self-isolation | 0.48 a | 0.29 a | 0.44 a | 0.38 a | 0.29 a | 0.24 a | 0.33 a | 0.54 a | - | |
| 10. Phubbing: Problem acknowledgement | 0.52 a | 0.37 a | 0.30 a | 0.42 a | 0.37 a | 0.35 a | 0.39 a | 0.47 a | 0.38 a | - |
| Mean ± standard deviation | 45.32 ± 9.38 | 27.46 ± 7.60 | 30.82 ± 6.68 | 21.53 ± 5.71 | 7.09 ± 2.77 | 8.72 ± 2.96 | 12.39 ± 3.35 | 11.22 ± 2.81 | 11.27 ± 3.36 | 8.93 ± 2.58 |
a P < 0.01.
Based on the results in Table 1, the correlation coefficients among the variables were in the expected direction and in line with the theories of the research field. Table 1 indicates that there are positive and significant correlations between Internet addiction, fear of missing out, academic boredom, and all three components of smartphone addiction with the four aspects of phubbing. These aspects include nomophobia, interpersonal conflict, self-isolation, and problem acknowledgment. The kurtosis and skewness of each variable were examined to evaluate the assumption of normal distribution of univariate data, while the variance inflation factor (VIF) and the tolerance coefficient were investigated to evaluate the assumption of collinearity (Table 2).
Table 2.Verifying the Assumptions of Normality and Collinearity
| Research Variables | The Assumptions of Normality | The Assumptions of Collinearity | ||
|---|---|---|---|---|
| Skewness | Kurtosis | Tolerance | Variance Inflation | |
| 1. Internet addiction | -0.32 | -0.20 | 0.37 | 2.72 |
| 2. Fear of missing out | 0.18 | -0.50 | 0.62 | 1.61 |
| 3. Academic boredom | -0.61 | -0.76 | 0.42 | 2.39 |
| 4. Smartphone addiction: Creativity loss | -0.07 | 1.05 | 0.50 | 1.98 |
| 5. Smartphone addiction: Tendency | -0.21 | -0.96 | 0.64 | 1.54 |
| 6. Smartphone addiction: Loneliness | 0.43 | -0.74 | 0.55 | 1.87 |
| 7. Phubbing: Nomophobia | -0.13 | -0.91 | - | - |
| 8. Phubbing: Interpersonal conflict | 0.31 | -0.03 | - | - |
| 9. Phubbing: Self-isolation | -0.29 | -1.17 | - | - |
| 10. Phubbing: Problem acknowledgement | -0.12 | -0.83 | - | - |
According to Table 2, the values of kurtosis and skewness of all components are within the range of ± 2, confirming the assumption of normal distribution of univariate data (52). An explanation is needed for this statement: Kline and Tabachnik et al. highlight that the Shapiro-Wilk and Kolmogorov-Smirnov tests are sensitive to sample size and may not be suitable for evaluating the assumption of normality in large samples (52, 53). Therefore, they suggest that examining the values of kurtosis and skewness is a more logical approach to assess the normality of data distribution. According to experts, kurtosis and skewness values outside the range of ± 2 indicate a deviation from the normality assumption in univariate data distribution. Besides, the tolerance coefficient values of > 0.1 for the predictor variables and < 10 for the variance inflation factor confirm the assumption of collinearity among the data of the present study. According to Meyers et al., a tolerance coefficient of < 0.1 and a variance inflation factor of > 10 indicate that the assumption of collinearity is not met (54). In this study, Mardia’s coefficient was calculated to be 29.11, which is lower than the recommended value of 83.36. Therefore, it can be concluded that the assumption of normal distribution of multivariate data holds valid for these data. Bolen (55) suggests that if the Mardia’s coefficient is less than the value calculated using the formula "number of markers × (number of markers + 2) / 2," it can be concluded that the assumption of a normal distribution for multivariate data is valid (55). Data analysis related to the Mahalanobis distance was used to assess whether the assumption of normality of multivariate distribution was met. The skewness and kurtosis values of the Mahalanobis distance data were 1.31 and 1.60, respectively, indicating the normal distribution of multivariate data. Finally, the scatter plots of the standardized variances of the errors were examined to evaluate the homogeneity of variances, indicating that the aforementioned hypothesis was held among the data.
4.1. Model Analysis
In this study, smartphone addiction and phubbing were latent variables and formed the research measurement model. It was hypothesized that the latent variable of smartphone addiction would be measured by indicators of creativity loss, tendency, and loneliness, and the latent variable of phubbing would be measured by indicators of nomophobia, interpersonal conflict, self-isolation, and problem acknowledgment. The fit of the measurement model was evaluated using confirmatory factor analysis, AMOS 24.0 software, and maximum likelihood (ML) estimation.
In the structural equation modeling method, based on the predicted relationships between the research variables, a model is designed, and the models are evaluated by examining the fit indices and the resulting parameters that help the researcher decide on a more appropriate model. This examination follows accepted standards. For example, χ² (chi-square), Comparative Fit Index (CFI), Root Mean Square Error of Approximation (RMSEA), the chi-square to degrees of freedom ratio (χ²/df), Goodness of Fit Index (GFI), and Adjusted Goodness of Fit Index (AGFI). For interpreting these indices, the goodness of fit criteria recommended in the literature were applied (52, 56). According to these criteria, for example, RMSEA values equal to or less than 0.08, CFI values equal to or greater than 0.90, and χ²/df ratios less than or equal to 3 indicate an acceptable model fit. The obtained results showed that all indices met the recommended criteria, indicating a satisfactory fit of the model to the data. Table 3 shows the statistical results for goodness-of-fit indices of the measurement model and the structural model, all supporting an acceptable fit of the measurement model with the collected data.
Table 3.Goodness of Fit Indices and Cut-off Point for the Measurement and Structural Models
Abbreviations: GFI, Goodness Fit Index; AGFI, Adjusted Goodness Fit Index; CFI, Comparative Fit Index; RMSEA, root mean square error of approximation.
a Normed chi-square
b Although the Normed Chi-square index for the measurement model does not meet the desired cut-off point established by Klein (2016), Bullen (1989) argues that a Normed Chi-square value smaller than 5 indicates an acceptable fit of the model to the data.
In the measurement model, the largest and smallest factor loadings belonged to the indicators of creativity loss (β = 0.782) and loneliness (β = 0.574), respectively. Thus, given that the factor loadings of all indicators were > 0.32, they all have the necessary power to measure the latent variables of the present study. It is important to note that, according to Tabachnik et al., factor loadings are categorized as follows: Factor loadings of 0.71 and above are considered excellent, loadings between 0.63 and 0.70 are considered very good, loadings between 0.55 and 0.62 are considered good, loadings between 0.45 and 0.55 are considered fair, loadings between 0.32 and 0.44 are considered low, and loadings below 0.32 are considered weak (53). This classification helps in evaluating the strength of factor loadings in statistical analysis. The structural model fit indices (Figure 2) were estimated and evaluated following the assessment of the measurement goodness of fit indices. As shown in Table 4, the fit indices obtained from the analysis support an acceptable fit of the structural model with the collected data.
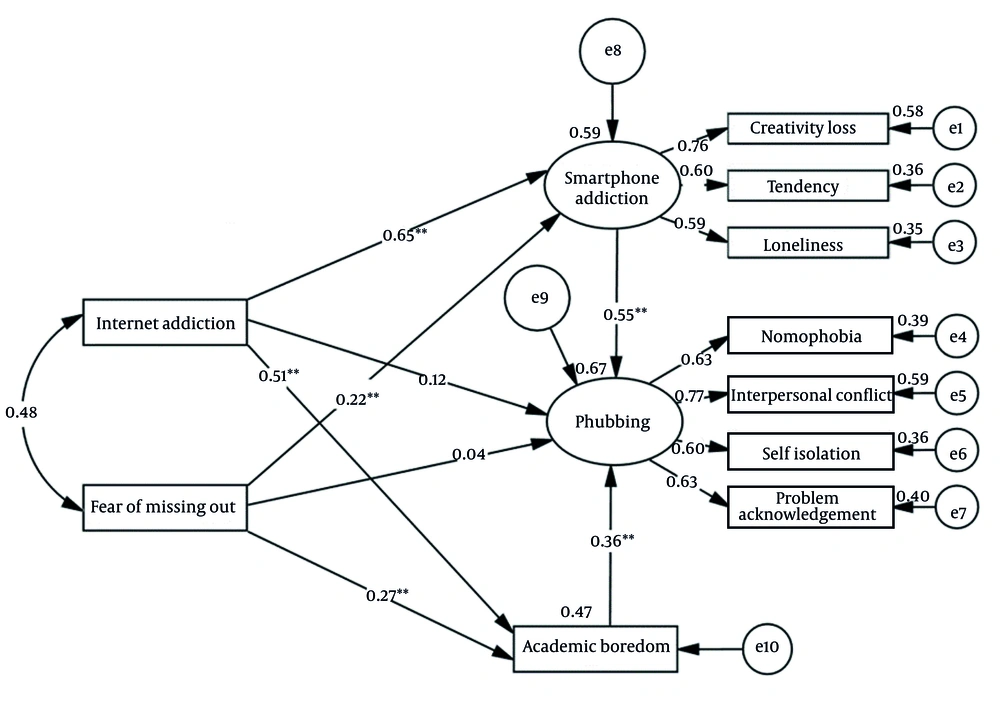
Figure 2.
Standard parameters in the research structural model
Table 4.Total and Direct Path Coefficients Between Research Variables in the Structural Model
| Effects and Path | b | S.E | β | P |
|---|---|---|---|---|
| Direct | ||||
| Internet addiction → academic boredom | 0.367 | 0.026 | 0.507 | 0.001 |
| Fear of missing out → academic boredom | 0.248 | 0.048 | 0.651 | 0.001 |
| Internet addiction → smartphone addiction | 0.308 | 0.043 | 0.274 | 0.001 |
| Fear of missing out → smartphone addiction | 0.111 | 0.020 | 0.220 | 0.001 |
| Internet addiction → phubbing | 0.018 | 0.023 | 0.116 | 0.426 |
| Fear of missing out → phubbing | 0.009 | 0.016 | 0.036 | 0.514 |
| Academic boredom → phubbing | 0.078 | 0.011 | 0.358 | 0.001 |
| Smartphone addiction → phubbing | 0.265 | 0.091 | 0.550 | 0.001 |
| Indirect | ||||
| Internet addiction → phubbing | 0.094 | 0.023 | 0.542 | 0.001 |
| Fear of missing out → phubbing | 0.054 | 0.013 | 0.219 | 0.001 |
| Total | ||||
| Internet addiction → phubbing | 0.112 | 0.017 | 0.658 | 0.001 |
| Fear of missing out → phubbing | 0.045 | 0.012 | 0.220 | 0.001 |
Table 4 shows that Internet addiction (P = 0.001, β = 0.658) and fear of missing out (P = 0.001, β = 0.220) had a positive and significant total path coefficient with phubbing. In contrast, the coefficients of the direct path between Internet addiction and fear of missing out through phubbing were not statistically significant. Also, smartphone addiction (P = 0.001, β = 0.550) and academic boredom (P = 0.001, β = 0.358) had a positive and significant path coefficient with phubbing. Table 4 shows that the indirect path coefficient was positive and significant between Internet addiction and phubbing (P = 0.001, β = 0.542) on the one hand and fear of missing out and phubbing (P = 0.001, β = 0.219) on the other hand. Using the Baron and Kenny formula (1986, cited by Mallinckrodt et al., (57), it was shown that the path coefficient between Internet addiction and phubbing was positive and significant through smartphone addiction (P = 0.001, β = 0.358) and academic boredom (P = 0.001, β = 0.184). In addition, using the Baron and Kenny formula, it was shown that the path coefficient between fear of missing out and phubbing was positive and significant through smartphone addiction (P = 0.001, β = 0.121) and academic boredom (P = 0.001, β = 0.097). Thus, academic boredom and smartphone addiction mediate the relationship between fear of missing out and Internet addiction with phubbing in Generation Z students. It is important to note that there is no significant direct relationship between Internet addiction and fear of missing out (FOMO) due to phubbing. Instead, academic boredom and smartphone addiction serve as complete mediators in the relationship between Internet addiction and fear of missing out with phubbing in Generation Z. Figure 2 shows the structural model of the research using standard data. This figure illustrates the coefficient of determination (R²) for three variables: Smartphone addiction, academic boredom, and phubbing, with values of 0.59, 0.47, and 0.67, respectively. This means that Internet addiction and the fear of missing out account for 59% of the variance in smartphone addiction and 47% of the variance in academic boredom among Generation Z students. Also, based on the results obtained, and according to this figure, R² (the coefficient of determination) for the phubbing variable was 0.67, indicating that Internet addiction, fear of missing out, academic boredom, and smartphone addiction could collectively explain 67% of the variance in phubbing among Generation Z students.
5. Discussion
This research aimed to model the structural equations of the relationships between Internet addiction and fear of missing out, with the mediating effect of smartphone addiction and academic boredom on phubbing in Generation Z. The results showed that all fit indices were within the desired range; thus, the proposed model had a good fit with the population data, and the main research hypothesis was confirmed. As shown, Internet addiction and fear of missing out had a positive and significant total path coefficient with phubbing, which is consistent with the studies of Rahman et al. (21), Al-Saggaf et al. (34), Davey et al. (27), Savci and Aysan (40), and Karadağ et al. (15). This finding can be justified according to previous research on the neural basis of digital addictions, indicating Internet addiction stimulates neurobiological responses similar to drug addiction. Games and Internet use lead to faster dopamine release and immediate user satisfaction, promoting their compulsive behaviors (58). Neuroimaging studies have shown reduced gray matter density in several brain regions, including the prefrontal and orbitofrontal cortex (59), with more pronounced representation in Generation Z, who experience digital immersion and engage with the Internet for about three hours more than other generations (60), leading to a greater likelihood of phubbing disorder. Generation Z often relies on digital communication, which may hinder the development of face-to-face communication skills and deep personal connections, potentially interfering with the clear expression of individual emotions (4). Internet addicts also typically prefer online interactions over face-to-face communication (61). Internet addiction and mental health, including anxiety, stress, and depression, are positively associated (62), and according to the theory of compensatory Internet use (TCIU), this excessive use functions as a compensatory mechanism for individuals experiencing negative psychological states (particularly fear of missing out) (23). Individuals seek to regulate or avoid their anxiety about missing social media updates by constantly accessing their smartphones, and, therefore, engage in phubbing.
It was also found that smartphone addiction and academic boredom had positive and significant path coefficients with phubbing, which is in line with the studies of Abi Doumit et al. (28), Lv et al. (32), Meng and Xuan (29), Rahman et al. (21), Al-Saggaf (34), Al-Saggaf et al. (19), and Savci and Aysan (40). This finding is justified as the phenomenon of Generation Z's dependence on smartphones has become one of the most important social problems. The easy use of Internet software and online games and the lack of sufficient control often lead to pronounced signs of addiction (63), identified as a high-risk factor with obsessive behavior and functional impairment symptoms (64). Thus, smartphone addiction has a critical contribution to the phubbing phenomenon (65). Generation Z students with smartphone addiction are absorbed in their phones and ignore their surroundings, resulting in reduced interaction and engagement with others, ineffective use of coping mechanisms, and delayed adaptation (66). On the other hand, some of the coping strategies that students use against academic boredom include daydreaming, aimlessly scribbling on paper, sending messages to friends, and playing with mobile phones (67), creating the conditions for phubbing.
As highlighted by examining indirect paths, the effect between Internet addiction and phubbing through smartphone addiction and academic boredom was positive and significant, which is in line with the studies of Gijwani et al. (20), Rao et al. (17), Sadeghi Bimorgh et al. (36), and Karadağ et al. (15). The relationship between Internet addiction, smartphone addiction, and academic boredom was also consistent with Swathe and Mayur (16) and Choi et al. (18). The path coefficient between fear of missing out and phubbing through smartphone addiction and academic boredom was also positive and significant, which is in line with the studies of Bernard (26), Lv et al. (32), and Nasr et al. (25). The relationship between fear of missing out, smartphone addiction, and academic boredom was also consistent with the findings of Barry (33), Elhai et al. (38), and Bayrami et al. (22), revealing that academic boredom and smartphone addiction mediate the relationship between fear of missing out and Internet addiction with phubbing in Generation Z students. Studies have shown that using the Internet can exacerbate feelings of anxiety and stress, driving individuals to their smartphones for relief and perpetuating the cycle of phubbing (62).
The Interaction of Person-Affect-Cognition-Execution (I-PACE) model is one of the theoretical models examining factors related to behavioral addictions. Personality traits underlie individuals’ vulnerability to Internet addiction, which interacts with emotional-cognitive mechanisms and is combined with weakened executive functions when faced with situational factors, leading to inconsistent decision-making and resulting in excessive hours spent on the Internet. Fear of missing out has a negative emotional component, such as loneliness, which stems from depression. Many individuals turn to the Internet and mobile phones to control this negative emotional component, potentially leading to problematic smartphone use. Therefore, fear of missing out can predict smartphone addiction. As a psychological trauma or core personality trait, boredom is also affected by depression, decreasing Generation Z's self-control over time. Thus, they resort to some impulsive behaviors to deal with boredom and when faced with the stresses of university and other areas of life, because they cannot regulate their emotional and cognitive states. One of these behaviors is the search for immediate pleasure in the present instead of greater rewards in the future to alleviate boredom and relieve the monotony caused by this feeling through smartphones, which provide them with immediate satisfaction, compensating for negative mood or immediate stress. The more individuals fear losing something, the more likely they are to continue searching for information about what they have lost. This feeling of instant indulgence through the process of conditioning leads to further distortion of cognition and emotions, creating cognitive biases and ineffective coping styles (68-71).
5.1. Conclusions
Considering the above discussion, technology-based behaviors and their impact on mental health should be considered in Generation Z. Educational and training professionals and psychologists need to increase their awareness of the impact of technology-based behaviors, while programs should also be designed to raise students' awareness of the consequences of excessive technology use. In addition, developing psychological skills, enhancing self-concept, and strengthening social and psychological skills in young people can be effective in reducing the adverse effects of these technologies.
