


1. Background
The phenomenon of population aging is emerging as a defining global demographic shift (1). According to the World Health Organization, global life expectancy reached 73.3 years in 2024, marking a significant increase compared to previous decades. This achievement has led to a rapid expansion of the elderly population, with projections indicating that the number of individuals aged 60 and above will rise from 1.1 billion in 2023 to 1.4 billion by 2030 and exceed 2.1 billion by 2050 (2). This demographic transition has placed unprecedented pressure on health systems and societies, highlighting the urgent need to prioritize “healthy aging.”
In this context, maintaining the psychosocial well-being of older adults is of particular importance. As individuals age, they often face challenges such as the loss of a spouse, declining physical function, and shifting social roles, which place them at increased risk for depression and social isolation (3). Evidence suggests that active social engagement can reduce feelings of loneliness, improve interpersonal relationships, and enhance social self-efficacy. Therefore, interventions that support and improve social functioning and mental health in older adults hold a critical place in rehabilitation strategies (3, 4).
Body percussion is considered an effective therapeutic approach for treating various conditions associated with cognitive, physical, and psychological impairments (2). This innovative method, based on the BAPNE framework, combines rhythmic movement and music to stimulate communication between the brain’s hemispheres, motor cortex, cerebellum, and basal ganglia. Activation of these regions facilitates improved cognitive functions such as attention and working memory, and enhances blood flow to the thalamus, insula, frontal cortex, and posterior parietal cortex—areas associated with motor function and balance (5).
The BAPNE method is interdisciplinary, incorporating biomechanics (vertical, horizontal, and diagonal movement planes), anatomy (use of upper and lower limbs), psychology (exploring thoughts and emotions during learning), neuroscience (activation of all brain lobes), and ethnomusicology (producing culturally relevant body-generated sounds) (6). Its goal is to develop each of the eight intelligences proposed by the model (5). In BAPNE, individuals use their bodies to produce sound, move through space, and maintain continuous mental focus. At the motor level, body percussion enhances bodily awareness; cognitively, it strengthens memory, attention, and concentration; and socially, it fosters interpersonal relationships (6). One of the core objectives of rehabilitation is to prevent and facilitate recovery from impairments, enabling individuals to regain independence, fulfill essential needs, and receive psychological support (7).
2. Objectives
Despite scattered evidence pointing to the positive effects of body percussion on various health domains, a significant research gap remains in the national literature. This gap underscores the necessity of conducting the present study. Simultaneously, the accelerating trend of population aging in Iran has introduced numerous challenges in safeguarding the psychosocial health of older adults. Although body percussion is widely applied internationally, no comprehensive study has systematically examined its integrated effects on psychosocial variables among Iranian elderly populations. Furthermore, the absence of a culturally adapted, standardized protocol in this area is notably felt within the national health system. Therefore, this study aims to investigate the effects of music-based body percussion exercises on quality of life, social adaptation, anxiety, and depression in older adults.
3. Methods
3.1. Study Design
This study was a single-blind randomized clinical trial conducted in Semnan, Iran, during the years 2017 - 2018 (1396 - 1397 in the Iranian calendar). The aim was to examine the effects of rhythmic body percussion exercises on quality of life, social adaptation, anxiety, and depression in elderly women.
3.2. Study Participants and Sampling
The study population consisted of elderly women attending public and private day rehabilitation centers, as well as residents of the Noor Nursing Home and the Taher Elderly Care Facility in Semnan. Sample size was calculated using the formula n = 2 (z₁ − α/2 + z₁ − β)²/d², assuming a 95% confidence level, β = 0.20, and a large effect size (d = 0.8). Based on initial calculations, 25 participants were required per group. To account for potential attrition, incomplete sessions, or missing data, the sample size was increased by approximately 20%, resulting in 30 participants per group (8). In total, 60 elderly women were enrolled in the study — 30 in the intervention group and 30 in the control group — to ensure sufficient statistical power even in the event of participant dropout.
To enhance precision and control for potential confounding variables, eligible participants were stratified into homogeneous blocks based on age, cognitive ability, and motor function. Block randomization was then used to assign participants equally to the intervention and control groups. Allocation was performed by assigning a numeric code to each participant and generating a non-repeating random sequence using the https://www.random.org platform. All randomization procedures were carried out by an independent researcher not involved in the study to ensure allocation concealment. The allocation sequence was kept hidden from participants, who remained unaware of their group assignment throughout the intervention period. To maintain the integrity of the single-blind design, both groups received sessions of equal duration and structure. Details regarding participant selection, allocation, and attrition throughout the study are illustrated in Figure 1.
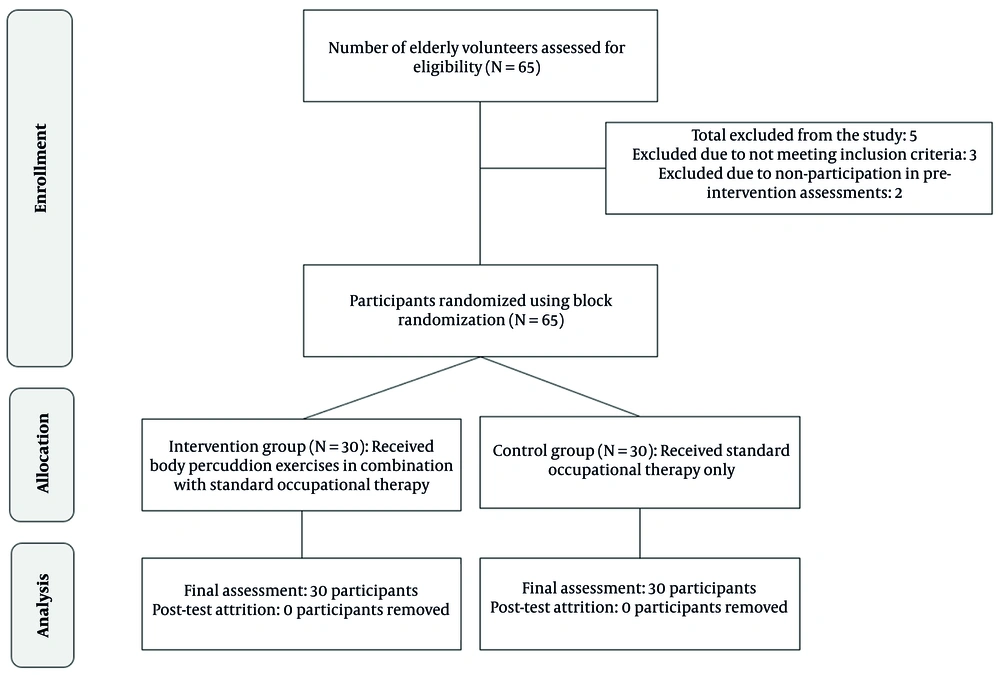
Figure 1.
CONSORT flow diagram of the study process
3.3. Inclusion and Exclusion Criteria
Inclusion criteria were: being female; aged between 60 and 70 years (9); ability to read and write (minimum fifth-grade literacy); ability to walk independently without assistive devices for at least 10 meters; a history of no more than one to three falls in the past six months; a cognitive performance score above 21 on the Mini-Mental State Examination (MMSE); difficulty performing activities of daily living (e.g., bathing, toileting, dressing) (10); absence of any neurological, cardiovascular, orthopedic, or psychiatric disorders as confirmed by family reports and a medical health certificate. Exclusion criteria included unwillingness to continue treatment or complete withdrawal from participation in the research project.
3.4. Research Procedure
Ethical approval was obtained from the Biomedical Research Ethics Committee of Semnan University of Medical Sciences and the Clinical Trial Research Center. Participants meeting the inclusion criteria were enrolled in the study. Each participant signed a written informed consent form and, with the guidance of the evaluator, completed the demographic questionnaire, the Mini-Cog test, Bell’s Social Adaptation Scale, the LEIPAD Quality of Life Questionnaire, and the Beck Anxiety and Depression Inventories (BAI and BDI). Participants were then randomly assigned to either the intervention or control group using block randomization.
The intervention group sessions were designed and conducted by two music specialists and one occupational therapist trained in music. A separate occupational therapist served as the blinded evaluator, unaware of the intervention schedule and session content. This evaluator was responsible only for pre- and post-intervention assessments and data reporting. Participant performance was assessed anonymously and in random order. Another therapist, familiar with both conventional occupational therapy and body percussion techniques, administered the interventions according to protocol in both groups. All sessions were conducted in groups, three times per week, for a total of 12 sessions, each lasting 45 minutes.
3.5. Intervention Procedure
In the intervention group, body percussion exercises were delivered alongside conventional occupational therapy. These exercises were based on rhythmic patterns derived from the twelve fundamental musical notes and adapted to Iranian musical culture. Each session featured a specific rhythm, progressing from simple to complex across the first ten sessions. Sessions one and two used a basic 4/4 rhythm, while sessions three through ten incorporated eight base rock rhythms drawn from music theory. Rhythms were performed at a tempo of 60 beats per minute using a metronome. In sessions eleven and twelve, rhythms from sessions nine and ten were repeated at an increased tempo of 70 beats per minute to enhance motor coordination and rhythmic precision. The first 15 minutes of each session were dedicated to auditory rhythm training through imitation and hand-generated sounds. Sessions were paused as needed to accommodate participant rest.
In the control group, only conventional occupational therapy was provided. This included indirect training in activities of daily living (e.g., toileting, bathing, dressing), physical rehabilitation, and psychosocial support. Each activity was broken down into tasks, and each task into smaller behavioral steps or stages. Teaching techniques included task analysis, feedback, modeling, forward and backward chaining, verbal/non-verbal cues, and chunking. Cognitive strategies were also employed to familiarize participants with the metacognitive framework of “goal-plan-execute-review,” enabling them to apply it to functional challenges. Compensatory strategies and environmental modifications — such as assistive devices and grab bars in bathrooms — were used to improve daily functioning. Safety education was also provided to prevent injury (10). Both groups received these routine services as part of the study.
3.6. Data Collection Tools
3.6.1. Mini-Mental State Examination (Short Form)
Originally developed by Folstein in 1975, this test is designed for clinical assessment of cognitive status in older adults. It takes approximately 5 - 10 minutes to administer and includes 30 items across five domains: orientation, registration, attention and calculation, recall, and language skills. Each item is scored as one point, with a maximum total score of 30. A score of 27 or above indicates normal cognitive function; scores between 21 and 26 suggest mild impairment; scores between 11 and 20 reflect moderate impairment; and scores of 10 or below indicate severe cognitive dysfunction (11). The validity of this test was reported by Foroughan et al. with a coefficient of 0.78 (12).
3.6.2. Bell’s Social Adaptation Questionnaire
Developed by Bell and Altus in 1945, this questionnaire assesses five dimensions of adaptation: home, occupational, health, emotional, and social. It uses a nominal scoring system: “Yes” receives 1 point, “No” receives 0 points, and “I don’t know” is not scored (13, 14). The overall reliability of the questionnaire has been reported with a Cronbach’s alpha of 0.84, and its validity at 0.80 (14).
3.6.3. LEIPAD Quality of Life Questionnaire
Designed by Diago et al. in 1988, the LEIPAD Questionnaire is an internationally recognized tool for assessing quality of life in older adults. It consists of two sections: core quality of life and facilitating quality of life. The first section includes 31 items across seven dimensions — physical (5 items), self-care (6 items), depression and anxiety (4 items), cognitive (5 items), social (3 items), life satisfaction (6 items), and sexual issues (2 items). The second section contains 18 items focused on life satisfaction. Items are scored on a 4-point Likert scale ranging from 0 (worst) to 3 (best), with total scores ranging from 0 to 93. In Iran, Doami and Hassanzadeh reported a Cronbach’s alpha reliability of 0.874 (15).
3.6.4. Beck Anxiety Inventory
The Beck Anxiety Inventory (BAI) is a widely used self-report tool for measuring anxiety severity in adults, developed by Beck and Clark in 1988. It contains 21 items rated on a 4-point Likert scale from 0 (not at all) to 3 (severely). Total scores range from 0 to 63 (16, 17). Beck and Clark reported internal consistency reliability of 0.93 and test-retest reliability of 0.75 (18).
3.6.5. Beck Depression Inventory
The Beck Depression Inventory (BDI) is a validated self-report measure for assessing depression severity in adults. It includes 21 items, each scored on a 4-point scale from 0 (no symptoms) to 3 (severe symptoms), with total scores ranging from 0 to 63 (19, 20). Beck reported concurrent validity of the instrument as high as 0.96 (21, 22).
3.7. Ethical Consideration
This article is based on an undergraduate research project registered under proposal number 1351. It was reviewed and approved by the 127th Ethics Committee of Semnan University of Medical Sciences on February 6, 2018, with the ethics code IR.SEMUMS.REC.1396.217 and clinical trial registration number IRCT20171219037954N2.
All participants signed a written informed consent form. They were assured that their participation would not affect the quality of their usual care and would not cause any harm.
3.8. Statistical Analysis
All statistical analyses were conducted according to the study protocol using SPSS version 26. Demographic characteristics of participants were reported using descriptive statistics, including frequency and percentage, range, mean, and standard deviation (SD). The Kolmogorov–Smirnov test was used to assess the normality of data distribution. Since the P-values for all variables exceeded 0.05, the data were considered normally distributed, and parametric tests were applied.
For within-group comparisons (pre- and post-intervention), paired t-tests were used. To evaluate the effectiveness of the therapeutic intervention on psychological indicators, analysis of covariance (ANCOVA) was performed to control for baseline effects and reduce model error variance. The magnitude of the intervention’s impact was quantified using effect size, calculated as partial eta squared (η²). Interpretation of η² values followed Cohen’s (1988) guidelines: η² ≈ 0.01 was considered a small effect, η² ≈ 0.06 a medium effect, and η² ≥ 0.14 a large effect.
Additionally, statistical power was calculated and reported for each test to ensure adequate sample size and precision in interpreting results. A power value of 0.80 or higher was considered acceptable.
4. Results
A total of 60 elderly women participated in the study. Analysis of demographic characteristics indicated that the intervention and control groups were initially homogeneous across key confounding variables. Table 1 presents the distribution of educational level and marital status of participants in both groups.
Table 1.Distribution of Educational Level and Marital Status by Group
| Variables and Categories | Intervention Group | Control Group | ||
|---|---|---|---|---|
| Frequency | Frequency Percent (%) | Frequency | Frequency Percent (%) | |
| Educational level | ||||
| Primary | 15 | 50 | 12 | 40 |
| High school | 12 | 40 | 14 | 46.66 |
| Bachelor's | 3 | 10 | 4 | 13.33 |
| Marital status | ||||
| Single | 2 | 6.66 | 3 | 10 |
| Married | 24 | 80 | 25 | 83.33 |
| Widowed | 3 | 10 | 2 | 6.66 |
| Divorced | 1 | 3.33 | 0 | 0 |
As shown in Table 1, the highest frequencies in both groups were observed among participants with primary and high school education. Specifically, in the intervention group, 50% had primary education and 40% held a high school diploma, while in the control group, 40% had primary education and 46.66% held a diploma. The percentage of participants with a bachelor’s degree was below 15% in both groups. Regarding marital status, most participants in both groups were married — 80% in the intervention group and 83.33% in the control group. The proportions of single, widowed, and divorced individuals were low in both groups, with no notable differences observed. This relatively homogeneous distribution between groups allows for valid comparisons of the intervention effects without the confounding influence of demographic variables.
The overall mean age of participants was 64.41 years, and the mean cognitive score was 23.46. Table 2 presents the distribution indices for age and cognitive level, broken down by group.
Table 2.Descriptive Statistics of Age and Cognitive Scores by Group
| Variables | Score Range | Mean | Standard Deviation |
|---|---|---|---|
| Experimental group | |||
| Age (y) | 62 - 65 | 63.65 | 2.18 |
| Cognitive score | 21 - 26 | 22.62 | 2.15 |
| Control group | |||
| Age (y) | 61 - 64 | 62.83 | 1.07 |
| Cognitive score | 21 - 26 | 23.04 | 1.57 |
Based on the data presented in Table 2, the mean age in the intervention group was 63.65 years (SD = 2.18), while in the control group it was 62.83 years (SD = 1.07). The mean cognitive scores were 22.62 in the intervention group and 23.04 in the control group. The score ranges for both variables were similar across groups, and no significant differences were observed. Significance levels greater than 0.05 indicate that the differences between groups in these variables were not statistically meaningful. Therefore, initial homogeneity between groups in terms of age and cognitive level is confirmed, reducing the likelihood of confounding effects in the outcome analysis.
Given the normal distribution of the data, paired t-tests were used to assess within-group changes in participant scores before and after the intervention. Table 3 presents the means, standard deviations, and significance levels for scores on the cognitive test, Bell’s Social Adaptation Scale, LEIPAD Quality of Life Questionnaire, BAI, and BDI, for both the intervention and control groups, pre- and post-intervention.
Table 3.Mean, Standard Deviation, and Significance Levels for Cognitive Function, Social Adaptation, Quality of Life, Anxiety, and Depression Scores by Group a
| Variables and Groups | Pre-intervention | Post-intervention | Significance (P-Value) |
|---|---|---|---|
| Short cognitive test | |||
| Experimental | 23.60 ± 2.13 | 26.00 ± 2.26 | 0.024 |
| Control | 23.33 ± 1.23 | 23.60 ± 1.50 | 0.067 |
| Total social adjustment | |||
| Experimental | 33.26 ± 3.67 | 31.33 ± 3.65 | 0.030 |
| Control | 35.46 ± 4.91 | 34.73 ± 5.03 | 0.053 |
| LEIPAD quality of life | |||
| Experimental | 53.93 ± 13.91 | 58.46 ± 12.38 | 0.041 |
| Control | 50.00 ± 7.60 | 52.46 ± 9.19 | 0.052 |
| Beck Anxiety Inventory | |||
| Experimental | 12.40 ± 4.81 | 10.13 ± 4.66 | 0.021 |
| Control | 8.80 ± 3.89 | 8.46 ± 4.08 | 0.055 |
| Beck Depression Inventory | |||
| Experimental | 15.60 ± 4.73 | 10.13 ± 6.05 | 0.024 |
| Control | 17.13 ± 4.51 | 16.40 ± 4.65 | 0.060 |
a Values are expressed as mean ± SD.
The results presented in Table 3 indicate that cognitive performance significantly improved in the intervention group (P = 0.024), whereas no significant change was observed in the control group (P = 0.217). Social adaptation also showed a significant improvement in the intervention group (P = 0.030), while the control group exhibited no meaningful difference (P = 0.413). Quality of life significantly increased in the intervention group (P = 0.038), but this change was not statistically significant in the control group (P = 0.052). Additionally, both anxiety and depression scores significantly decreased in the intervention group (P = 0.021 and P = 0.024, respectively), whereas the reductions in the control group were not statistically significant (P = 0.055 and P = 0.060, respectively).
To further assess the effect of the intervention on psychological indicators, an ANCOVA was conducted, controlling for pre-test scores. Table 4 presents the results of this analysis for the variables of social adaptation, quality of life, anxiety, and depression, comparing group means (standard deviations) and significance levels using ANCOVA.
Table 4.Comparison of Mean (SD) Scores for Bell’s Social Adaptation, LEIPAD Quality of Life, Beck Anxiety, and Beck Depression by Group Using Analysis of Covariance
| Variable and Source of Variation | df | Mean Square | F | P-Value | Effect Size (η²) | Statistical Power |
|---|---|---|---|---|---|---|
| Short cognitive test | ||||||
| Pre-test | 1 | 0.831 | 0.218 | 0.644 | 0.008 | ≈ 0.10 |
| Group | 1 | 41.992 | 11.032 | 0.003 | 0.248 | ≈ 0.88 |
| LEIPAD quality of life | ||||||
| Pre-test | 1 | 2899.918 | 181.434 | < 0.001 | 0.880 | ≈ 0.95 |
| Group | 1 | 42.850 | 2.681 | 0.113 | 0.871 | ≈ 0.45 |
| Total social adjustment | ||||||
| Pre-test | 1 | 479.506 | 206.286 | < 0.001 | 0.885 | ≈ 0.96 |
| Group | 1 | 22.379 | 9.628 | 0.004 | 0.876 | ≈ 0.87 |
| Beck Anxiety Inventory | ||||||
| Pre-test | 1 | 1236.032 | 675.091 | < 0.001 | 0.962 | ≈ 0.95 |
| Group | 1 | 16.696 | 9.119 | 0.005 | 0.959 | ≈ 0.85 |
| Beck Depression Inventory | ||||||
| Pre-test | 1 | 1087.041 | 634.020 | < 0.001 | 0.968 | ≈ 0.95 |
| Group | 1 | 7.146 | 4.168 | 0.050 | 0.965 | ≈ 0.65 |
The results presented in Table 4 indicate that, for the MMSE, the group effect was statistically significant (F = 11.032, P = 0.003, η² = 0.248, power ≈ 0.88), while the pre-test effect was not significant (P = 0.644). This finding suggests a positive impact of the intervention on cognitive performance. Regarding overall social adaptation, both the pre-test and group effects were significant. The pre-test effect was highly significant (F = 206.286, P < 0.001, η² = 0.885, power ≈ 0.96), indicating a strong predictive role of baseline scores in post-intervention adaptation. The group effect was also significant (F = 9.628, P = 0.004, η² = 0.876, power ≈ 0.87), confirming the effectiveness of the intervention in enhancing participants’ social adaptation.
For quality of life, the pre-test effect was highly significant (F = 181.434, P < 0.001, η² = 0.880, power ≈ 0.95), while the group effect was not statistically significant (P = 0.113, power ≈ 0.45), suggesting that changes in quality of life were more strongly influenced by initial scores than by the intervention itself. In the case of BAI scores, both the pre-test and group effects were significant (P < 0.001 and P = 0.005, respectively), with a large effect size (η² ≈ 0.96) and adequate statistical power (≈ 0.85), indicating the intervention’s effectiveness in reducing anxiety. Similarly, for BDI scores, the pre-test effect was highly significant (P < 0.001, η² = 0.968, power ≈ 0.95), and the group effect reached the threshold of significance (F = 4.168, P = 0.050, η² = 0.965, power ≈ 0.65), suggesting a moderate impact of the intervention on reducing depression. Overall, the findings demonstrate that the therapeutic intervention successfully improved participants’ cognitive functioning and psychological well-being—particularly in reducing anxiety and depression — although its direct effect on quality of life was not statistically significant.
5. Discussion
This study was designed to investigate the effects of music-based body percussion exercises on quality of life, social adaptation, anxiety, and depression in older adults. The findings revealed that body percussion interventions in the experimental group led to significant improvements in cognitive performance — particularly in working memory and attention — social adaptation, quality of life, and reductions in anxiety and depression symptoms compared to the control group. These results align with the studies by Cavan et al. and Mangiacotti et al. (23, 24). Cavan et al. demonstrated that similar rhythmic activities activate the prefrontal cortex and cerebellum, which play key roles in executive functioning (23). Likewise, Mangiacotti et al. reported that body percussion exercises enhance neural connectivity within the brain’s attentional networks (24).
However, the degree of improvement observed in the present study appears to exceed that reported in some previous research, which may be attributed to the unique features of the intervention protocol. The current protocol emphasized multisensory and interactive aspects of body percussion, combined with conventional occupational therapy, potentially offering a stronger stimulus for neuroplasticity. In other words, by simultaneously engaging sensory, motor, and cognitive systems, body percussion may strengthen neural connections between the motor cortex, cerebellum, and limbic structures. This neural integration could facilitate concurrent improvements in cognitive and emotional functioning.
Findings related to enhanced social adaptation and reduced anxiety and depression symptoms are also consistent with a substantial body of research (25). Jimenez-Molina et al. found that body percussion exercises promote eye contact and appropriate body language, thereby improving social adaptation (26). Evans showed that the BAPNE program enhances communication skills and fosters a sense of group belonging (27). Additionally, Vrinceanu et al. reported that music-movement activities reduce cortisol levels and increase serotonin in older adults (28). This pattern aligns with the study by Arnold et al., which demonstrated that music-based interventions primarily affect neural circuits associated with anxiety (29).
Although improvements in quality of life were not statistically significant in this study, the observed positive trend is noteworthy. This finding is consistent with another study, who emphasized that meaningful changes in quality of life often require longer-term and multidimensional interventions (25). It appears that the duration of the current intervention may not have been sufficient to produce significant changes in this complex construct.
5.1. Conclusions
Body percussion, as a low-cost, interactive, and multisensory intervention, holds significant potential for enhancing cognitive and psychosocial health in older adults. The alignment of these findings with reputable international studies reinforces the scientific credibility of this approach.
5.2. Limitations and Recommendations
Despite providing evidence for the effectiveness of music-based body percussion in enhancing cognitive, emotional, and social functioning in older adults, the study faced limitations — including a gender-restricted sample (women only) and the absence of neuroimaging data — which may limit the generalizability of the findings and the ability to explain underlying mechanisms. Future research is recommended to adopt longitudinal designs and incorporate advanced laboratory methods such as functional magnetic resonance imaging, functional near-infrared spectroscopy, or electroencephalography to explore the long-term stability of intervention effects and the neural pathways involved. Including biological markers (e.g., cortisol and serotonin) and diverse samples in terms of gender, age, and cultural background could also contribute to a more comprehensive understanding of the efficacy and mechanisms of body percussion in promoting cognitive and psychological health in older adults.


