
1. Background
Type 2 diabetes mellitus (T2DM) is a major public health challenge, and delayed identification may postpone preventive care and confirmatory evaluation (1). Established cardiometabolic correlates include adiposity, physical inactivity, hypertension, and dyslipidemia (2). Depression and anxiety may also be associated with metabolic risk through behavioral and neuroendocrine pathways (3). Although longitudinal evidence supports a bidirectional association between diabetes and depression (4), the incremental contribution of psychological measures to population-based diabetes screening remains uncertain.
Regional data from the Kerman Coronary Artery Disease Risk Factors Study (KERCADRS) reflect these challenges, with a reported T2DM prevalence of approximately 10% among urban adults and notable rates of undiagnosed diabetes (5). These findings underscore the need for effective, locally calibrated screening approaches that identify high-risk individuals earlier by integrating physical and psychological variables.
1.1. Related Work
Machine-learning approaches can model nonlinear relationships among demographic, anthropometric, clinical, behavioral, and psychological variables and have been evaluated in diabetes-related classification tasks using logistic regression, decision trees, support vector machines, boosting methods, and more recent hybrid deep-learning and explainable artificial intelligence frameworks (6-8). However, many studies broadly describe prediction without distinguishing the classification of current glycemic status from the prediction of future incident diabetes.
The specific contribution of psychological measures to routine population screening remains less clear. Therefore, this study evaluates anxiety and depression alongside established cardiometabolic variables in a local Iranian cohort, with an emphasis on transparent reporting, leakage-aware predictor construction, calibration, threshold selection, and hold-out record-level test-set evaluation.
2. Objectives
The primary objective was to classify current glycemic status as diabetes versus normal/prediabetes in pooled KERCADRS records and to evaluate its potential utility as a population-screening aid for identifying individuals who may require confirmatory testing.
A secondary objective was to assess whether anxiety and depression provided incremental screening value beyond the selected demographic, anthropometric, blood-pressure, and lipid-related predictors. This was assessed by comparing the performance of the selected HistGradientBoosting model using the full selected predictor set with that of an otherwise identical model excluding anxiety and depression.
3. Methods
3.1. Study Design and Setting
This study was a secondary pooled, record-level, cross-sectional analysis of data from two phases of the population-based KERCADRS study conducted in Kerman, Iran. Phase 1 was conducted during 2009 - 2011, and Phase 2 during 2014 - 2016. The datasets included demographic, examination, laboratory, behavioral, and psychological questionnaire variables.
Because a validated participant-level linkage identifier was unavailable in the analytic dataset, repeated participation across the two KERCADRS phases could not be explicitly identified or accounted for. Consequently, some records may represent the same individual across phases and may have been allocated to both the development and test sets. Such overlap may violate the assumption of record independence and could yield overly narrow confidence intervals and modestly optimistic estimates of hold-out test performance. Therefore, the findings are interpreted as pooled record-level, cross-sectional screening performance rather than participant-level, longitudinal, temporally validated, or externally validated performance.
3.2. Outcome Definition
The primary outcome was a binary classification of current glycemic status: diabetes versus normal/prediabetes. Diabetes was defined as FBS ≥ 126 mg/dL or current use of antidiabetic medication, consistent with the KERCADRS definitions. Records with FBS < 100 mg/dL were classified as normal, and those with FBS 100 - < 126 mg/dL were classified as prediabetes. Normal and prediabetes were combined as the negative class for binary modeling.
The normal, prediabetes, and diabetes categories were retained for descriptive reporting only. HbA1c was not used because it was not available as a consistent analytic variable across the pooled dataset.
3.3. Predictors
To prevent target leakage, FBS and antidiabetic medication variables were used exclusively for outcome construction and were excluded from model inputs. Participant identifiers, visit codes, phase indicators, and date-related variables were also excluded.
Candidate predictors were restricted to clinically interpretable variables available across both study phases: age, sex, body mass index (BMI), waist circumference, blood pressure measures, total cholesterol, triglycerides, high-density lipoprotein (HDL) cholesterol, low-density lipoprotein (LDL) cholesterol, physical-activity level, Beck Anxiety Inventory (BAI) score, and Beck Depression Inventory-II (BDI-II) score. Derived candidate features included the triglyceride-to-HDL ratio, pulse pressure, mean arterial pressure, and BMI thresholds. Variables without a verified clinical definition in the available data dictionary were not considered.
Consistent with the revised terminology, the predictor set did not operationalize a full biopsychosocial framework. Social-determinant variables such as education, income, occupation, and social support were not available as harmonized variables in the analytic dataset and were therefore not evaluated.
3.4. Data Integration and Cleaning
Variable names were standardized, and the two phase-specific datasets were aligned according to their shared variables before record-level concatenation. Variables available in only one phase were not included as predictors to avoid missingness by design. Analytic records were retained when the binary outcome could be constructed.
Missing predictor values were imputed within the modeling pipelines using median imputation for numeric variables and most-frequent-category imputation for categorical variables. No formal assessment of the missingness mechanism was conducted; therefore, the imputation approach should not be interpreted as addressing missing-not-at-random mechanisms.
3.5. Statistical Analysis and Feature Selection
Analyses were performed in Python using scikit-learn. The analytic dataset was divided using a stratified, record-level split into a development set (80%; n = 12,671) and a hold-out record-level test set (20%; n = 3,168).
Within the development set, a fitting subset was used for feature selection and initial model fitting. Random Forest permutation importance, calculated only in the fitting data, was used to rank the 20 candidate predictors. The 12 highest-ranked predictors were retained for subsequent modeling: age, triglycerides, waist circumference, triglyceride-to-HDL ratio, LDL cholesterol, BMI, pulse pressure, total cholesterol, anxiety, depression, systolic blood pressure, and HDL cholesterol. Selection was not repeated using the test set.
3.6. Algorithm Modeling, Calibration, and Validation
Three algorithms were compared: class-weighted Logistic Regression, Random Forest, and HistGradientBoosting. For each algorithm, preprocessing and model fitting were performed using the fitting subset. The remaining calibration subset was divided into two stratified parts: one was used to fit an isotonic-regression probability calibrator, and the other was used to select a classification threshold.
Thresholds were chosen to maximize the F1 score subject to a minimum sensitivity target of 0.75. The calibrated probabilities and selected threshold were then applied unchanged to the hold-out record-level test set.
Performance was summarized using AUC, accuracy, Macro-F1, balanced accuracy, sensitivity, specificity, precision, negative predictive value (NPV), and Brier score. Uncertainty in the main classification metrics was estimated using 1,000 bootstrap resamples of the hold-out record-level test set.
HistGradientBoosting was selected as the primary model for detailed reporting because it achieved the highest hold-out test-set AUC and balanced accuracy. For this model, predictor importance was assessed using permutation importance, quantified as the mean reduction in AUC after permuting each predictor across 50 repetitions.
To assess the joint incremental contribution of psychological measures, HistGradientBoosting fitted with the full selected predictor set was compared with an otherwise identical reduced model excluding anxiety and depression. Both models were fitted, isotonic-calibrated, and thresholded separately using the same development-data procedure. Paired bootstrap resampling of the hold-out test set was used to estimate 95% confidence intervals for between-model differences in AUC, balanced accuracy, and Brier score.
4. Results
4.1. Overall Model Performance
A total of 15,839 analytic records were included: 10,900 (68.82%) were classified as normal, 3,136 (19.80%) as prediabetes, and 1,803 (11.38%) as diabetes. The distribution of normal, prediabetes, and diabetes records is shown in Figure 1; however, all predictive analyses used the binary outcome of diabetes versus normal/prediabetes. The class distribution was similar in the development and hold-out record-level test sets (Supplementary Table S1). Twelve predictors were retained after feature selection; age had the highest permutation importance, followed by triglycerides and waist circumference (Table S2 in the Supplementary File).
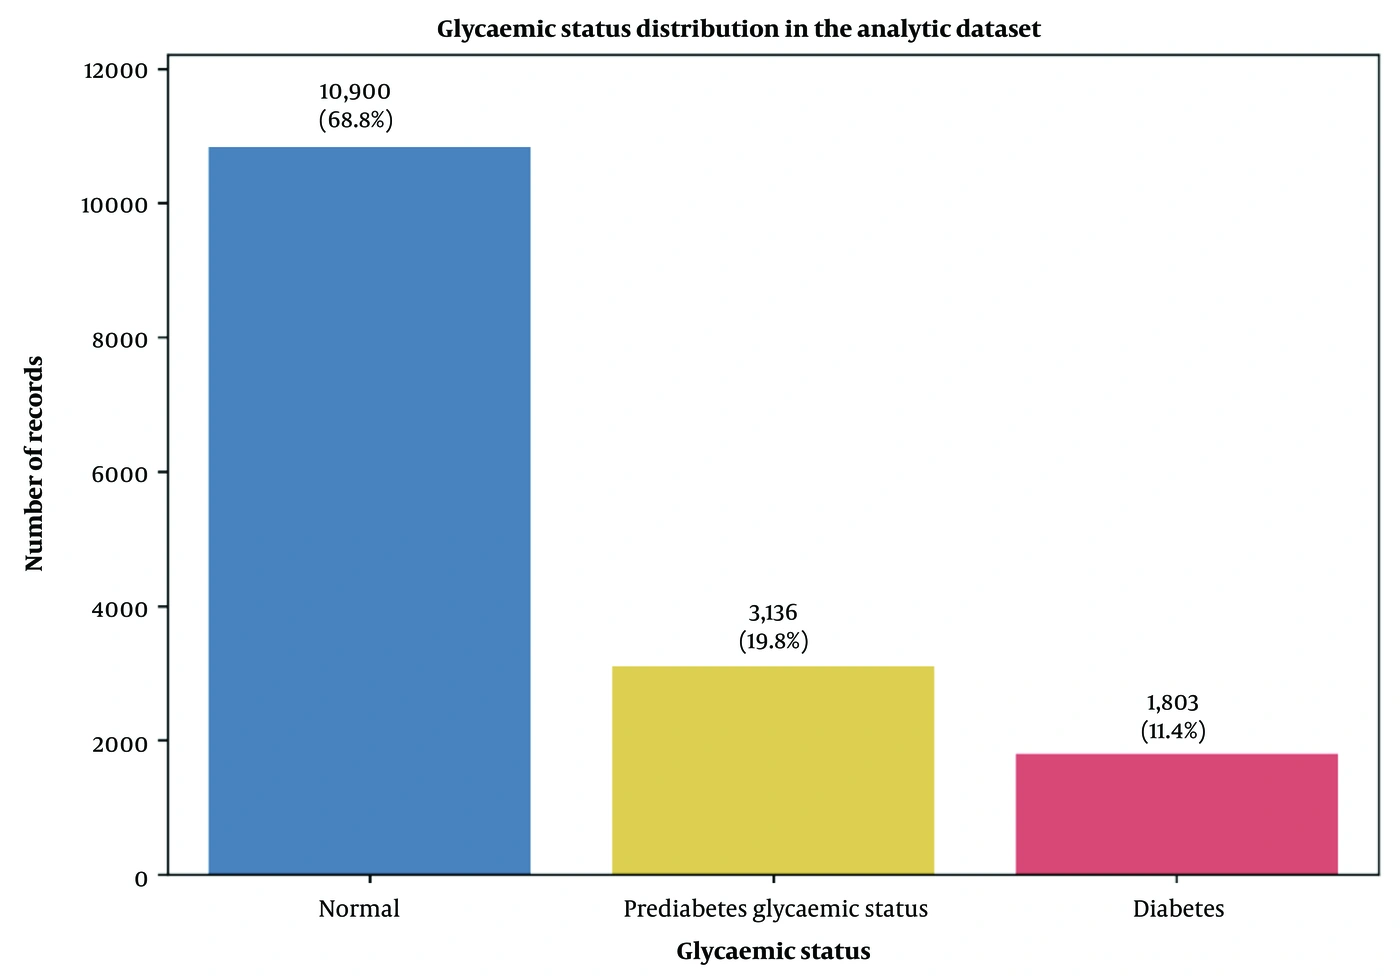
Figure 1.
Distribution of glycaemic-status categories in the analytic dataset (N = 15,839). Normal, prediabetes, and diabetes were defined using fasting blood glucose and current antidiabetic medication status.
Table 1 summarizes hold-out record-level test performance. HistGradientBoosting had the highest AUC (0.800; 95% CI, 0.777 - 0.821) and balanced accuracy (0.736; 95% CI, 0.714 - 0.758) and was therefore selected as the primary model for detailed reporting. At the sensitivity-oriented threshold of 0.119, HistGradientBoosting achieved a sensitivity of 0.806, specificity of 0.666, precision of 0.237, NPV of 0.964, and Brier score of 0.089. Random Forest achieved the highest sensitivity (0.958) but substantially lower specificity (0.316), indicating a high false-positive referral burden. Logistic Regression showed comparable discrimination (AUC, 0.796; 95% CI, 0.773 - 0.818) but was retained as a secondary interpretable analysis.
Table 1.
Hold-Out Record-Level Test Performance of Machine-Learning Models for Classifying Current Diabetes Status (Diabetes Versus Normal/Prediabetes)
| Model | AUC (95% CI) | Balanced accuracy (95% CI) | Sensitivity (95% CI) | Specificity (95% CI) | Brier score |
|---|---|---|---|---|---|
| Random Forest | 0.789 (0.766 - 0.811) | 0.637 (0.623 - 0.650) | 0.958 (0.936 - 0.977) | 0.316 (0.298 - 0.332) | 0.090 |
| HistGradientBoosting | 0.800 (0.777 - 0.821) | 0.736 (0.714 - 0.758) | 0.806 (0.768 - 0.848) | 0.666 (0.647 - 0.682) | 0.089 |
| Logistic Regression | 0.796 (0.773 - 0.818) | 0.730 (0.707 - 0.753) | 0.781 (0.738 - 0.823) | 0.679 (0.662 - 0.695) | 0.089 |
Thresholds were selected within the development data by maximizing the F1 score subject to a minimum sensitivity target of 0.75 and were applied unchanged to the hold-out record-level test set. Values are proportions. Ninety-five percent confidence intervals were estimated using 1,000 bootstrap resamples of the hold-out record-level test set. HistGradientBoosting was selected as the primary model because it achieved the highest AUC and balanced accuracy.
Extended performance metrics, including thresholds, threshold-subset F1, accuracy, Macro-F1, precision, and NPV, are reported in Table S3 in the Supplementary File.
4.2. Predictor Importance in HistGradientBoosting
Table 2 presents permutation importance in the hold-out record-level test set for the selected HistGradientBoosting model. Age was the dominant contributor to discrimination, with a mean AUC decrease of 0.1599 (SD, 0.0131) when permuted. Triglycerides (mean AUC decrease, 0.0428; SD, 0.0062), waist circumference (0.0221; SD, 0.0048), and LDL cholesterol (0.0186; SD, 0.0031) were the next most influential predictors. Pulse pressure and systolic blood pressure showed smaller positive contributions, both with a mean AUC decrease of 0.0055.
Table 2.
Hold-Out Record-Level Test-Set Permutation Importance for the Selected HistGradientBoosting Model
| Rank | Predictor | Mean decrease in AUC | SD |
|---|---|---|---|
| 1 | Age | 0.1599 | 0.0131 |
| 2 | Triglycerides | 0.0428 | 0.0062 |
| 3 | Waist circumference | 0.0221 | 0.0048 |
| 4 | LDL cholesterol | 0.0186 | 0.0031 |
| 5 | Pulse pressure | 0.0055 | 0.0018 |
| 6 | Systolic blood pressure | 0.0055 | 0.0021 |
| 7 | HDL cholesterol | 0.0007 | 0.0014 |
| 8 | Depression | −0.0003 | 0.0011 |
| 9 | Total cholesterol | −0.0005 | 0.0015 |
| 10 | TG/HDL ratio | −0.0005 | 0.0012 |
| 11 | Anxiety | −0.0006 | 0.0014 |
| 12 | Body mass index | −0.0015 | 0.0015 |
Permutation importance was calculated on the hold-out test set for the selected HistGradientBoosting model using AUC as the scoring metric and 50 permutations per predictor. Larger positive values indicate a greater reduction in model discrimination when the predictor is permuted. Near-zero or negative values indicate no measurable contribution to test-set AUC under this permutation procedure and should not be interpreted as causal or protective effects.
Anxiety and depression had near-zero permutation importance, with mean AUC decreases of −0.0006 and −0.0003, respectively, indicating that perturbing these variables did not reduce discrimination in the hold-out test set. Negative values should be interpreted as sampling variability or redundancy with correlated predictors rather than protective effects. These model-specific importance estimates describe contributions to discrimination and do not establish causality.
As a secondary interpretable analysis, Logistic Regression was used to estimate adjusted coefficient-based associations. Anxiety was positively associated with the screening outcome (OR, 1.26; 95% CI, 1.15 - 1.38), whereas depression was not robustly associated (OR, 0.94; 95% CI, 0.86 - 1.04). These secondary associations are reported separately from HistGradientBoosting permutation importance and do not quantify feature importance for the selected machine-learning model.
4.3. Incremental Contribution of Psychological Variables
Table 3 presents the ablation analysis for HistGradientBoosting. The cardiometabolic model excluding anxiety and depression achieved an AUC of 0.801, balanced accuracy of 0.734, and Brier score of 0.089. The full cardiometabolic-plus-psychological model achieved an AUC of 0.800, balanced accuracy of 0.736, and Brier score of 0.089.
Table 3.
Incremental Contribution of Psychological Variables in HistGradientBoosting
| Models | Predictors | AUC | Balanced accuracy | Brier score | ΔAUC, 95% CI | ΔBalanced accuracy, 95% CI | ΔBrier score, 95% CI |
|---|---|---|---|---|---|---|---|
| Cardiometabolic model | 10 | 0.801 | 0.734 | 0.089 | Reference | Reference | Reference |
| Cardiometabolic + psychological model | 12 | 0.800 | 0.736 | 0.089 | −0.001 (−0.008 to 0.006) | 0.002 (−0.010 to 0.013) | 0.000 (−0.001 to 0.001) |
The paired bootstrap difference between the full and reduced models was −0.001 for AUC (95% CI, −0.008 to 0.006), 0.002 for balanced accuracy (95% CI, −0.010 to 0.013), and 0.000 for Brier score (95% CI, −0.001 to 0.001). Thus, anxiety and depression did not demonstrate material incremental screening value beyond the selected cardiometabolic predictors in this pooled record-level dataset.
Differences were calculated as the performance of the cardiometabolic-plus-psychological model minus that of the cardiometabolic model. Ninety-five percent confidence intervals were estimated using 1,000 paired bootstrap resamples of the hold-out record-level test set. For Brier score, lower values indicate better calibration.
5. Discussion
This pooled record-level cross-sectional study evaluated machine-learning models for screening current diabetes status rather than predicting future incident diabetes. HistGradientBoosting achieved the highest hold-out test-set AUC and balanced accuracy and was therefore selected as the primary model. Its small advantage over Logistic Regression may reflect its capacity to capture nonlinear associations and interactions among anthropometric, lipid, and blood-pressure-related predictors, whereas Logistic Regression represents predictor effects as additive linear relationships on the log-odds scale.
HistGradientBoosting was selected operationally because it had the highest AUC and balanced accuracy in the hold-out test set, although its absolute advantage over Logistic Regression was small. Its tree-based boosting structure can accommodate nonlinear predictor–outcome relationships and interactions without prespecifying their functional form, which may be useful for correlated anthropometric, lipid, and blood-pressure measures. However, this flexibility comes at the cost of reduced coefficient-level interpretability compared with Logistic Regression. Furthermore, the selected model was chosen and evaluated using a single record-level split; its apparent advantage should therefore not be interpreted as definitive superiority without repeated, temporally separated, participant-linked, or external validation.
Permutation importance indicated that age was by far the largest contributor to HistGradientBoosting discrimination, followed by triglycerides, waist circumference, and LDL cholesterol. This pattern is consistent with the predominance of established cardiometabolic correlates in classifying current diabetes status. In contrast, anxiety and depression had near-zero importance for hold-out test-set AUC, and their joint removal did not materially alter discrimination, balanced accuracy, or calibration. Although anxiety was associated with the outcome in the secondary Logistic Regression analysis, the combined evidence does not support a claim that the available psychological measures improve overall screening performance beyond the selected cardiometabolic predictors.
5.1. Clinical Significance
The selected HistGradientBoosting model is not intended to diagnose diabetes or replace laboratory assessment. Its potential role is to prioritize individuals for confirmatory FBS, HbA1c, or oral glucose-tolerance testing. At the selected threshold, the model identified 291 of 361 diabetes records and missed 70, while 938 normal/prediabetes records were flagged for referral. This trade-off should be considered in relation to local laboratory capacity and follow-up resources. The corresponding classification counts are shown in Table 4, and their visual representation is provided in Supplementary Figure S1.
The full odds-ratio estimates and bootstrap confidence intervals from the secondary Logistic Regression analysis are reported in Table 5.
Table 4.
Confusion Matrix for Calibrated HistGradientBoosting in the Hold-Out Record-Level Test Set at the Selected Threshold of 0.119
| Variables | Predicted Normal/Prediabetes | Predicted Diabetes |
|---|---|---|
| Observed Normal/Prediabetes | 1869 | 938 |
| Observed Diabetes | 70 | 291 |
Table 5.
Odds Ratios and 95% Confidence Intervals from the Secondary Logistic Regression Analysis
| Predictor | OR | 95% CI for OR |
|---|---|---|
| Age | 2.26 | 2.07 - 2.50 |
| Triglycerides | 2.06 | 1.66 - 2.49 |
| Waist circumference | 1.69 | 1.49 - 1.92 |
| TG/HDL ratio | 0.73 | 0.60 - 0.87 |
| Anxiety | 1.26 | 1.15 - 1.38 |
| Pulse pressure | 1.23 | 1.03 - 1.48 |
| LDL | 0.85 | 0.49 - 1.08 |
| BMI | 0.86 | 0.77 - 0.97 |
| Systolic blood pressure | 1.10 | 0.95 - 1.27 |
| Depression | 0.94 | 0.86 - 1.04 |
| HDL | 1.00 | 0.84 - 1.07 |
| Total cholesterol | 1.00 | 0.82 - 1.57 |
5.2. Limitations and Future Directions
This study has several limitations. First, depression and anxiety were assessed using self-reported BDI-II and BAI questionnaires, which reflect cross-sectional symptom burden rather than formal clinical diagnoses. In addition, the null ablation findings concern the joint contribution of the available BAI and BDI-II measures in this dataset; they do not exclude the possibility that other psychological constructs, alternative instruments, or longitudinal measurements may have different predictive value. Measurement error and reporting bias may therefore have attenuated or distorted the estimated contribution of psychological variables.
Second, reliance on single-time-point measurements precluded assessment of longitudinal glycemic trajectories. In addition, the outcome was based on FBS and reported antidiabetic medication use because HbA1c was not available as a consistent analytic variable across the pooled records.
Third, the two KERCADRS phases were pooled as cross-sectional records because a validated participant-level linkage identifier was unavailable. Repeated participation could therefore not be identified, and the same individual may have contributed records to both the development and hold-out test sets. This potential overlap may have violated record independence, produced overly narrow bootstrap confidence intervals, and modestly inflated apparent hold-out test performance. The findings should consequently be interpreted as pooled record-level cross-sectional screening performance rather than participant-level, longitudinal, temporally validated, or externally validated performance.
Finally, model performance was assessed using a single stratified record-level hold-out test set. Bootstrap confidence intervals characterize uncertainty in test-set metrics but do not substitute for repeated resampling, temporal validation, or external validation. Future studies should assess reproducibility through repeated resampling and evaluate transportability in independently linked or external cohorts.
5.3. Conclusions
In pooled KERCADRS records, HistGradientBoosting showed moderate ability to classify current diabetes status for screening purposes and had the strongest overall hold-out test-set discrimination and balanced accuracy among the evaluated algorithms. Anxiety was positively associated with the outcome in secondary Logistic Regression, whereas depression was not robustly associated. However, jointly adding anxiety and depression did not materially improve discrimination, balanced accuracy, or calibration beyond the selected cardiometabolic predictors. These findings are record-level and cross-sectional, do not establish causality or longitudinal prediction, and require validation in independently linked or external cohorts before clinical implementation.