Introduction
The usage of pesticides has increased during the recent years. Although applying the pesticides in rice has increased grain production, their use has raised serious concern. Beside the high cost of the pesticides, the use of pesticides may contaminate the products, as well as posing a serious danger to human health (1).
Carbamates, or urethanes, are a group of organic compounds sharing a common functional group with the general structure R1-O-(CO)-NR2-R3. Carbamates are esters of carbamic acid, which are unstable compounds because of the liability of the H-groups, leading upon exposure to water to rearrangements that lead to the decomposition to ammonium bicarbonate.
A group of insecticides also contains the carbamate functional group, including aldicarb, carbofuran, pirimicarb, propoxur, carbaryl (Sevin), ethienocarb, and fenobucarb. These insecticides can cause cholinesterase inhibition poisoning by reversibly inactivating the enzyme acetyl cholinesterase and cause a cholinergic poisoning (2).
The presence of harmful pesticide residues in food has caused a great concern among the consumers. Therefore, it is important to develop some pragmatic procedures to increase the food safety along with the reduction in consumption of pesticide residue (3).
Food processing treatments include baking, bread making, dairy product manufacture, drying, thermal processing, fermentation, freezing, infusion, juicing, malting, milling, parboiling, peeling, peeling and cooking, storage, storage and milling, washing, washing and cooking, washing and drying, washing and peeling, washing peeling and juicing, and wine making (4).
Literature demonstrates that in most cases processing leads to large reductions in residue levels of pesticides in the prepared food, particularly through washing, peeling and cooking operations (5- 9).
The effect of food processing on pesticide residues in rice has been the focus of a few recently published articles. A report by Lee et al., it showed that washing the rice grains with water, removes approximately 60% of the chlorpyrifos residues from fortified rice samples (10). In another study, Fukuhara et al. showed that an initial level of 19 ppm permethrin in rice was removed completely by washing with water (11). The elimination of pesticide residues from the boiled extract could be due to decomposition by the effect of heat, the stronger adsorption of pesticide onto plant tissues and/or the poor solubility of pesticides in water (12).
The persistence of trifluralin, chlorpyrifos, decamethrin, cypermethrin and dichlorvos in rice and beans after cooking in a commercial microwave oven was evaluated by Castro et al. The results showed that 92% to 99% of the pesticides were eliminated (13).
The effect of boiling and cooking on reducting some organophosphorus pesticides in rice was evaluated by Holand p t, at et al. (14). The fate of Malathion and chlorpyrifos after boiling in rice has been the focus by Cogburn et al. in 1990 (15). Investigating about the effect of cooking process on the pesticides residue has also been the subject of studies by Satoh and Saka (16, 17).
The effect of processing on pesticide residues in food is an area where the available information should be consolidated and the missing information needs to be obtained through further research. More than 90% of the world’s rice is cultured and consumed in asia (1). Rice is a staple food for more than 60% of the world’s population. In Iranian food basket, the consumption of rice in Tehran is 110 g per capita/day (Personal Communication).
In this study, we evaluated the effect of cooking on reducing the amount of three carbamates residue i.e. carbaryl, pirimicarb and propoxur pesticides residues in white rice (Figure 1).
The Iranian traditional method for rice cooking was used, in which a mixture of 15 g of white rice and 45 mL of boiling water was placed in a 100 mL pyrex container. In order to evaluate the percentage of pesticide’s reduction, this processing was applied on spiked rice samples.
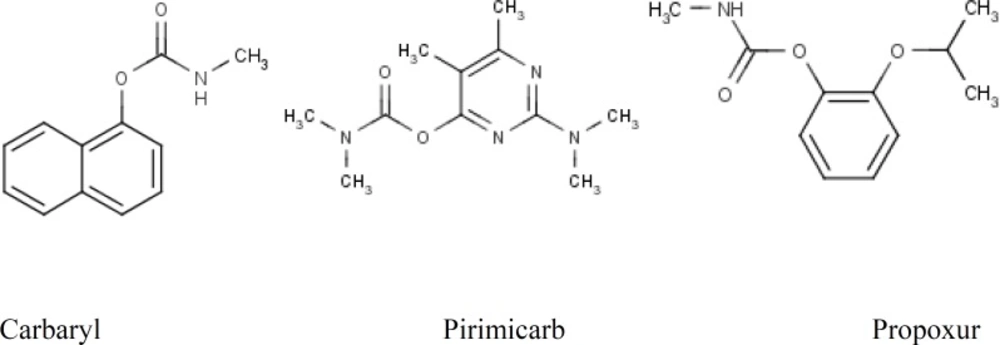
Figure 1
Chemical sctructures of Carbaryl, Pirimicarb and Propoxur
The percentage of reduction in pesticides concentration after cooking were determined by gas chromatography mass-spectrometry (GC/MS) using interpolation of the relative peak areas for each pesticide to internal standard peak area in the sample on the spiked calibration curve.
The list of selected pesticides along with some of their physico-chemical properties are presented in Table 1.
Table 1
Physico-chemical properties of the selected carbamate pesticides
| Compound | M.F | M.W. | V.P. (mmHg) | W.S. (mg/L) | M.P. (°C ) |
|---|---|---|---|---|---|
| Carbaryl | C12H11NO2 | 201.224 | 1.36E-06 | 110 | 145 |
| Pirimicarb | C11N18N4O2 | 238.29 | 7.28E-06 | 2700 | 90.5 |
| Propoxur | C11H15NO3 | 209.24 | 9.68E-06 | 1860 | 87 |
Experimental
Chemicals
All carbamate standards were purchased from Dr. Ehrenstorfer Co. (Augsburg, Germany). All organic solvents, intended for extraction, were at least LC grade and purchased from Merck (Darmstadt, Germany). Bulk quantities of anhydrous Na2SO4 and NaCl, were obtained from Merck (Darmstadt, Germany). Anhydrous MgSO4, was obtained from SIGMA-Aldich CO. (SIGMA-Aldich, Japan), The MgSO4 was baked for 5 h at 500ºC in a furnace to remove phthalates and residual water. Primary secondary amine (PSA) was purchased from Supelco (Supelco, USA).
GC–SQ/MS
An Agilent Technologies 6890N Network GC System chromatographs (Wilmington, USA) with a SQ detector and equipped with an Agilent 7683B autosampler (Agilent technologies, USA) was used. A HP-5 capillary column (film thickness: 30 m × 0.25 mm I.D., 0.1 μm) was used for separation.
Calibration standards
Individual stock standard solutions (1 mg/mL) were prepared in ethyl acetate and stored in the dark at -20°C. They were kept for 1 h at room temperature prior to their use. A mixed stock standard solution of pesticides was prepared in 15 μg/mL ethyl acetate. Spiked calibration standards at 6 levels of 25, 50, 100, 250, 500 and 1000 ng/mL were prepared by adding 25 μL, 50 μL, 100 μL, 250 μL, 500 μL and 1000 μL of mixed standard stock solution respectively to 15 g of cooked blank rice samples in each case.
A stock solution of triphenylmethane (TPM) in ethyl acetate at concentration of 1 mg/mL was used as internal standard. An aliquot of 10 μL of TPM solution in ethyl acetate (1000 mg/L) was added to the spiked rice sample as internal standard. The samples so obtained were treated as described in sample preparation.
Rice cooking
The iranian traditional method for rice cooking (Kateh) was used, in which a mixture of 15 g of white rice and 45 mL of distilled water was placed in a 100 mL Pyrex container. The mixture was heated for 20 min with hotplate and kept warm for another 45 min in order to complete the cooking process. The whole process was divided into three stages: 1) Five min from the start of heating to the start of boiling of the mixture; 2) Fifteen min from the start of boiling to the start of steam coming out of the rice cooker; 3) Forty five min from the start of steam coming out of the rice cooker to the end of cooking. A thermo-meter was applied for measuring the variation in temperature (100-105ºC) at the sampling locations during the rice cooking process.
Sample preparation
Two sets of samples were considered to evaluate the effect of cooking on pesticides residues. For the first set, both pesticides and internal standard were added to the rice after cooking. The second set was spiked with the pesticides prior to the cooking process and the internal standard was added after cooking. The first set was used to construct the calibration curve and validation of method. The second set was used to evaluate the effect of cooking process on pesticides residues.
In all cases, pesticides and/or internal standard solutions were added after cooling the cooked rice at room temperature (25°C) in order to avoid any possible decomposition of pesticides and internal standard. The spiked samples were left at ambient temperature in dark for 1.5 h. A volume of 120 mL acetonitrile was added to the mixture and then the mixture was blended. The mixture was blended at high speed for 1 min. Six grams of NaCl was added to the mixture, and blending was continued for another 60 sec. The supernatant was filtered through 25 g of Na2SO4 in a 250 mL container and the filtrate was evaporated by the rotary evaporator to 10 mL. The extract was transferred to a 50 mL falcon tube including 6 g MgSO4 and 300 mg PSA, and the residue in container was rinsed with 15 mL acetonitrile and added to the centrifuge tube. After shaking for 1 min and centrifugation for 7 min at 3000 rpm, the filtrate evaporated to 5 mL. The extract was transferred to a 15 mL falcon tube containing 2 g MgSO4 and 200 mg PSA (primary secondary amine (PSA) whichis one of the most powerful solid- phase extraction adsorbent for clean-up of food matrices and multi pesticide residue analysis. After shaking for 1 min and centrifugation for 7 min at 503 g, the filtrate was evaporated to 0.3 mL. The residue was reconstituted by toluene to obtain 1 mL solution and 2 μL of the solution was injected into gas chromatograph.
Recovery
For recovery determination, spiked cooked blank rice samples at concentration levels of 25, 50 and 500 ng/g were prepared in triplicates and then treated according to the procedure described in sample preparation. The recoveries were calculated using the spiked calibration curves.
Evaluation of pesticide’s reduction
The percentage of reduction after cooking was determined based on determination of recovery from triplicate spiked rice raw samples at levels 25, 100 and 500 ng/g of each pesticides before cooking and then after cooking according to rice cooking and treatment according to the procedure described in sample preparation.
GC-SQ–MS analysis
The GC-SQ-MS was employed with helium as the carrier gas at a constant flow rate of 1 mL/min. The oven temperature started at 75°C and remained at this temperature for 3 min increasing to 120°C in a ramp rate of 25°C/min and then increased to 300°C at 5 °C/min ramp, holding at 300°C for 11 min. The injection port was adjusted at 250°C and the splitless mode was used.
After acquisition of the total ion chromatogram for the mixed stock standard solutions in scan mode, peaks were identified by their retention time and mass spectra. The identification was confirmed by comparing the relative abundances for three ions (one quantifier and two qualifiers) of the experimental standards to the known relative abundances of the Pest Library reference spectra. The most abundant ion that showed no evidence of chromatographic interference and had the highest signal-to-noise ratio was taken for quantification purposes.
Quantitation
The concentrations of pesticides were determined by interpolation of the relative peak areas for each pesticide to internal standard peak area in the sample on the spiked calibration curve. In order to compensate for losses during sample processing and instrumental analysis, internal standard (TPM) was used.
Results and Discussion
Gas chromatographic determination
Analysis was performed in the SIM mode based on the use of one target and two qualifier ions. Pesticides were identified according to their retention times, target and qualifier ions. The quantitation was based on the peak area ratio of the targets to that of internal standard. Table 2 summarizes pesticides studied with their target and qualifier ions used in the SIM mode in this study.
Table 2
The retention times, diagnostic ions and the selected quantification ion for the target pesticides and the internal standard
| No. | Compound | Retention time | Diagnostic ions | Quantification |
|---|---|---|---|---|
| 1 | Propoxur | 10.91, 21.13 | 152.21, 110.1, 209 | 152.1 |
| 2 | Carbaryl | 18.83 | 144, 115.1, 125.9 | 144 |
| 3 | Pirimicarb | 26337 | 238.2, 166.1, 138 | 166.1 |
| 4 | TPM (Istd) | 29.77 | 244, 165 | 244,165 |
Calibration curves were constructed for each compound using six different concentration levels. For identification of pesticides, the retention time and three ions (one for quantitation and two for identification) were used. A GC–SQ–MS chromatogram of 3 pesticides and internal standard (TPM) analyzed in cooked spiked rice is shown in Figure 2.
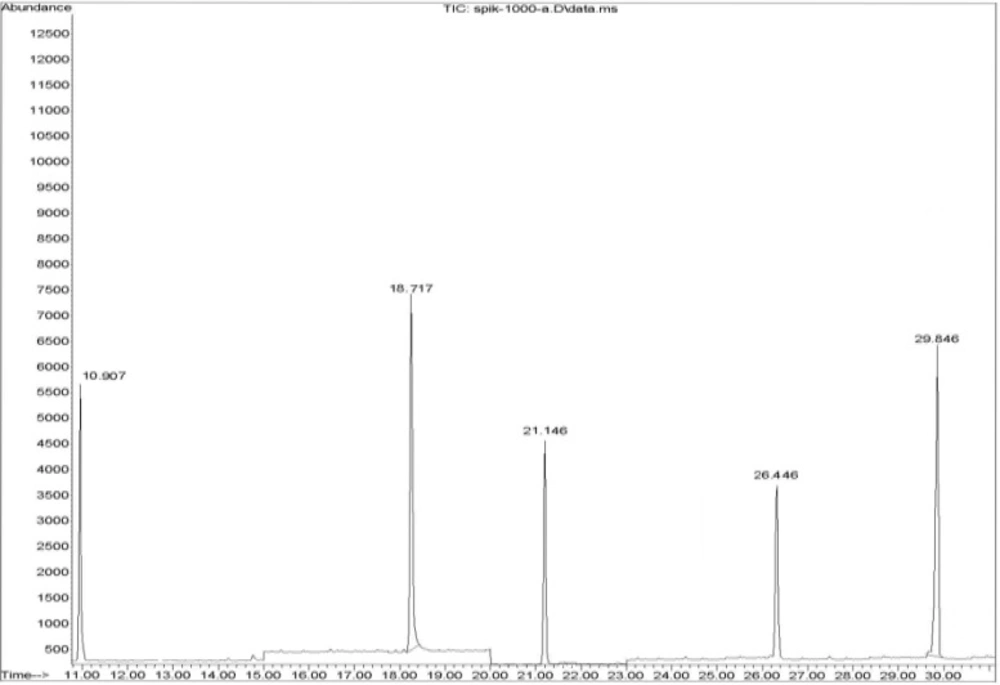
Figure 2
A representative chromatogram obtained for the three pesticides (propoxur, Rt = 10.91, 21.14; Carbaryl, Rt =18.72; pirimicab, Rt = 26.45) and internal standard ( TPM, Rt = 29.85 ).
Method validation
Linearity of the standards in spiked calibration curves
The three pesticides showed linearity in the SIM mode. Linear spiked calibration curves for all the carbamate pesticides were obtained with correlation factors > 0.999. The spiked calibration curve for pirimicarb in rice sample is shown in Figure 3 as a representative.
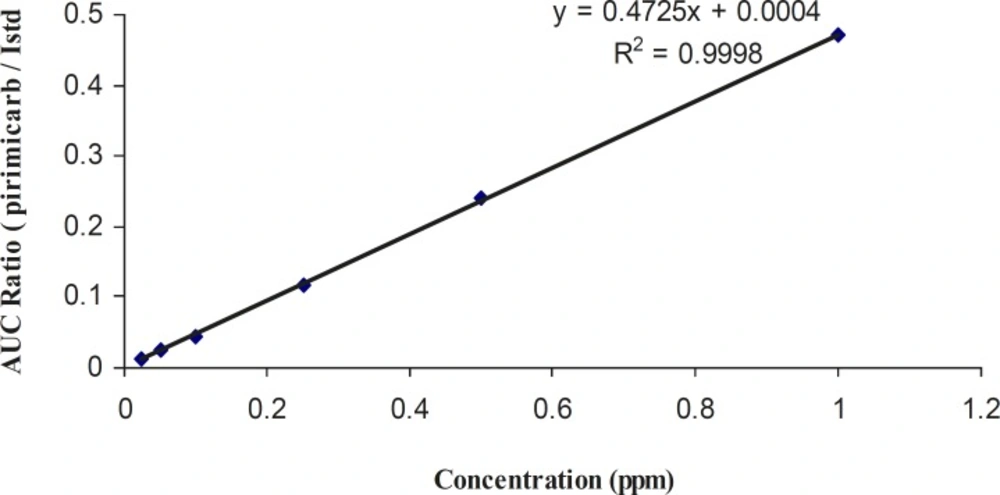
Figure 3
Spiked calibration curve for pirimicarb in cooked rice
Limitation of quantification
Limits of quantification (LOQs) of the proposed method were calculated by considering a value 10 times more than that of background noise. The LOQs for all the three pesticides in this method were calculated as 25 ppb.
Recovery
Table 3 presents the recovery and repeatability for the three concentration levels. The recovery of pesticides at these three levels was in the range of 89.47-100.24%. In terms of repeatability, the vast majority of pesticides gave RSD < 10% with n = 3 at each spiking level. The recoveries and repeatabilities are in accordance with the criteria set by SANCO Guideline (Commission of the European Communities, 2006).
Table 3
Average recoveries (%) and range of relative standard deviations (%) obtained by GC-MS analysis of rice at 3 spiking levels (n = 3) in rice samples
| Compound | Average recovery (%) (n=9) | RSDr (%) (n =3) |
|---|---|---|
| Propoxur | 100.24 | 4.01-14.01 |
| Carbaryl | 101.66 | 7.18 - 10.99 |
| Pirimicarb | 89.47 | 4.26 - 10.22 |
The reduction of pesticides after cooking
The results of percentage of reduction for each carbamate after the boiling process is presented in table 4.
Table 4
Average reduction (%) and range of relative standard deviations (%) obtained by GC-MS analysis of spiked rice at 3 spiking levels (n = 3) after cooking
| Compound | Average reduction (%) (n=3) | RSDr (%) (n =3) | ||
|---|---|---|---|---|
| 25 | 100 | 500 | ||
| poxur | 50.97** | 64.53*** | 10.88-16.91 | |
| Carbaryl | 99.65*** | 68.48*** | 67.30*** | 0.5 - 16.61 |
| Pirimicarb | 35.46 | 27.06 | 42.99 | 6.56 - 31.96 |
Figure 4 shows an overlaid chromatogram of carbaryl in spiked rice samples before (a) and after (b) cooking.
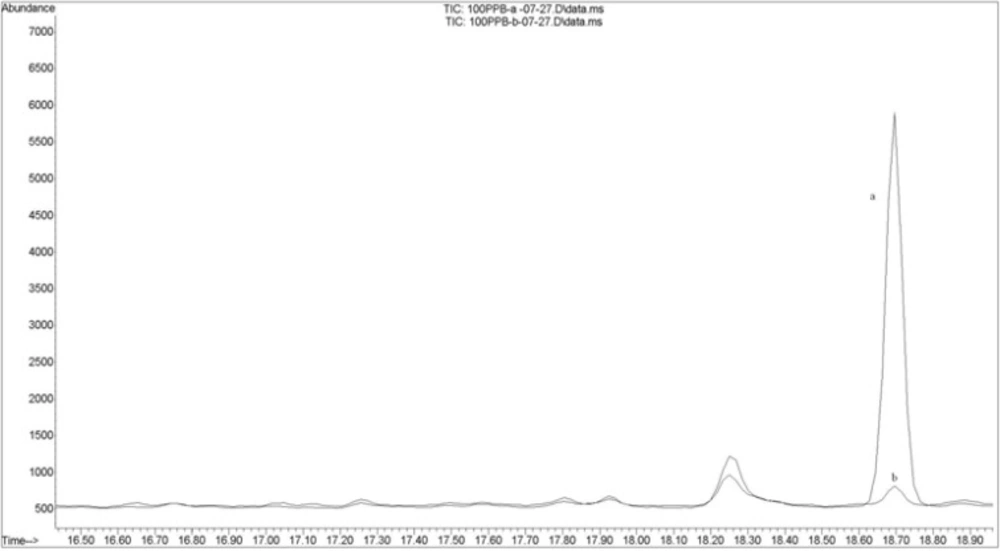
Figure 4
The overlaid chromatogram ;(a) Blank rice which is spiked with carbaryl (100 ppb) after the cooking; (b) Blank rice which is spiked with carbaryl (100ppb) before the cooking
The carbamates are a family of compounds whose general structures are shown in Figure 5. They are esters of carbamic acid with different substituents. The great success of carbamates in agricultural applications has led to a continued increase in the use of these pesticides, but their acute toxicity is of great concern and calls for their accurate determination in food stuff (18).
Food is the basic necessity of life and food contaminated with toxic pesticides is associated with severe effects on the human health. It is therefore of significance to develop simple, cost effective methods to enhance food safety and prevent the possible harms caused by pesticides.
The disappearance of pesticide residues from boiling extract could be due to the decomposition by the effect of heat, the stronger adsorption of pesticide onto plant tissues and/or the poor solubility of pesticides in water (12). Processes involving heating, can increase volatilization, hydrolysis or the other chemical degradation and thus reduce the residue levels (14).
In this study, we evaluated the effect of boiling on the reduction of three carbamate pesticide residues in rice. The selected pesticides, including those for which MRL is issued by The Institute of Standards of Iran (19), include carbaryl and pirimicarb. The other pesticide is propoxur as widely consumed pesticide in rice.
The results of this study show that the cooking process decreases the amount of the three mentioned carbamates. Carbaryl showed the highest reduction after cooking (78.47% in average) while pirimicarb showed the lowest reduction (34.5% in average). No strong correlation was found between a single physico-chemical property of each of the three pesticides and the percentage of their reduction after the cooking. Since several parameters including rate of hydrolysis, volatility (vapor pressure), water solubility and molecular weight could affect the amount of reduction after cooking, no decisive conclusion could be drawn about the extent that each parameter contributes to the total loss of pesticides residue after cooking. Investigating the effect of cooking process on the amount of reduction for a larger group of carbamates could help to find out more about mechanisms involved in this process.
Conclusion
An accurate method was developed to determine residues of the three carbamate insecticide in cooked rice, a main food in the Iranian food basket. The method which consists of a simple sample preparation and GC– SQ-MS-SIM analysis showed a high sensitivity and confirmatory power necessary for the determination of pesticide residues at MRL levels in rice set by The Institute of standards and industrial research of Iran (ISIRI).
The results of present study proves that the traditional Iranian rice cooking which involves long boiling time, significantly reduces the amount of carbamate residues. From the safety
and toxicological point of view, this could be considered as an advantage for this type of food processing.